
Abstract
Building upon fully convolutional networks (FCNs), deep learning-based salient object detection (SOD) methods achieve gratifying performance in many vision tasks, including surface defect detection. However, most existing FCN-based methods still suffer from the coarse object edge predictions. The state-of-the-art methods employ intricate feature aggregation techniques to refine boundaries, but they are often too computational cost to deploy in the real application. This paper proposes a semantics guided detection paradigm for salient object detection. Guided atrous pyramid module is first applied on the top feature to segment complete salient semantics. Query context modules are further used to build relation maps between saliency and structural information from the top-down pathway. These two modules allow the semantic features to flow throughout the decoder phase, yielding detail enriched saliency predictions. Experimental results demonstrate that the proposed method performs favorably against the state-of-the-art methods on surface defect detection and SOD benchmarks. In addition, this method can detect at 27 FPS in a fully convolutional fashion without any post-processing, which has the potential for real-time detection.
1 Introduction
The human visual system has an excellent attention mechanism, which can capture the most important part of a visual scene for the first time. Salient object detection (SOD) is an effective way to imitate this system. Unlike other dense-labeling visual tasks, SOD methods aim to distinguish the most visually prominent areas in a frame. Usually, SOD serves as the first step to benefit other downstream visual tasks, including image segmentation [1], visual tracking [2, 3], video abstraction [4], and content-aware image editing [5].
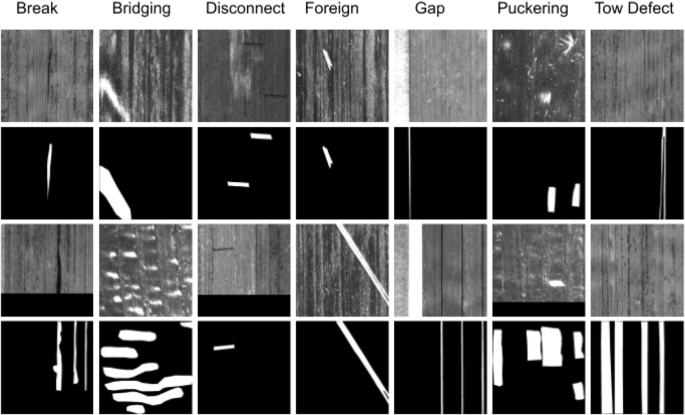
Examples of CFRP defect dataset, labeled with pixel-level ground truths (GTs)
Recently, deep learning [6]-based convolutional neural networks (CNNs, e.g. ResNet [7] and VGG [8]) trained for image classification have been adopted into salient object detection via transfer learning. Fully convolutional network (FCN) [11] sets a paradigm for dense-labeling tasks, surpassing the traditional methods by a large margin [9, 10]. However, the imperfection of FCN-like models is that they suffer from coarse edge refinements. The consecutive down-sampling operations in CNNs result in the loss of spatial information, which is critical for object reconstruction.
To address the aforementioned problem, feature aggregation mechanisms are introduced to refine the high-level features with local information in a recursive way. Feng et al. [12] adopted feature pairs to build ternary attention maps, transmitting multi-level information throughout the whole decoder stage. Xie et al. [13] used an effective feature aggregation mechanism to resolve the object boundaries. Wang et al. [14] learned residual features from integrating deep and shadow features to generate multi-context information. Although these strategies have brought satisfactory improvements, the boundaries of salient objects are still not explicitly modeled. The relations between salient object information and edge information are not fully evacuated. Besides, there are some methods using Superpixel [15] or CRF [16,17,18] as post-processing to preserve the object boundaries, and EGNet [55] introduced extra supervision specially designed for edge refinement. The main inconvenience with these approaches is their computation cost and low inference speed.
This paper concentrates on proposing a salient-guided object detection paradigm and bringing query mechanism to explore latent relations between salient and edge information, which does not need any costly post-processing. In order to help semantics to locate the target and restore clear boundaries, these two types of information are fully integrated and the relationships between them are fully evacuated. In general, our model consists of two primary modules on the base of the encoder-decoder network: a guided atrous pyramid module (GAPM) and a query context module (QCM). GAPM contributes to capturing complete and accurate salient objects, which uses as guide information for rebuilding. The GAPM consists of atrous convolution blocks with different artous rates. Then, high-level semantic information collected by GAPM can be successively delivered to feature maps at all pyramid levels, building relation maps between salient and edge information across all stages. The relation map fully evacuates the relationships between these two features, refining predictions from coarse to fine. Without sophisticated edge refinement modules, the proposed model can well locate the target with complex edges and make accurate predictions. In addition, extra supervise is introduced to different stages of the decoder to optimize the training process.
Besides that, the proposed method has been transferred to surface defect detection tasks. We construct a carbon fiber-reinforced plastics (CFRP) defect dataset. CFRP is a kind of material widely used in aerospace, transportation, and energy [19,20,21], which is superior in many aspects, including lightweight, high strength, and high-temperature resistance compared to traditional materials [22]. The target defects of CFRP datasets such as break, bridging, disconnect, foreign, gap, puckering and tow defects are shown in Fig. 1 . Compared with the natural image, the semantic information contained in the defect image is scarcer, and the object edge is difficult to recognize, which poses a greater challenge to restore the exquisite boundaries.
In summary, this paper makes three major contributions:
-
Query Context Network (QCNet) is proposed to explicitly build relations between salient objects and edge information to make fine edge predictions.
-
We further transfer the model to surface defect detection tasks and contribute a CFRP defect dataset to test the generality of the proposed method.
-
The proposed model can run at a real-time speed of 27 FPS and achieves state-of-the-art performance on multiple popular salient object detection and surface defect detection benchmarks.
2 Related work
2.1 Salient object detection
Salient object detection aims to distinguish the most visually obvious areas. Traditional SOD models make predictions mainly based on various saliency cues, including local contrast [23], global contrast [24], and background prior [40]. Recently, CNN-based SOD models have achieved promising performance. Qin et al. [52] proposed a predict-refine architecture to segment the salient object regions effectively and used a hybrid loss to supervise the training process at three different levels. In [25], Yan et al. proposed a size divide and conquer mechanism which separates and learn the feature of different size, achieving good results on many tasks. Wang et al. [16] combined background prior with the analysis of boundary property to enhance salient objects and restrain the backgrounds in an image. Qin et al. [59] proposed a two-level nested U-structure model which is able to capture more contextual information from different scales. Based on the U-shape architecture, Liu et al. [58] used a global guidance module and feature aggregation modules to fuse the multi-level features in a top-down way. Although these models use multi-scale features from different perspectives, they ignore the implicit relationships between semantic and structural features. Our model proposes an explicit pipeline to model these two different features and efficiently uses the information carried by different features to make final predictions.
2.2 Atrous convolution
Salient object detectors often use classification models (ResNet [7], VGG [8]) as feature extractors in the first stage, which shows their efficiency in many semantic segmentation tasks. However, these models are designed for classification tasks, consecutive down-sampling operations significantly reduce the spatial resolution of resulting features, which is essential for segmentation tasks.
Atrous convolution is a type of convolution that inflates the kernel by inserting holes between the kernel elements. It can expand the receptive field of the model without introducing additional parameters. Models based on atrous convolution have been actively explored for semantic segmentation. Wu et al. [26] experimented with the effect of modifying atrous rates for capturing long-range information. In [27], Chen et al. proposed atrous spatial pyramid pooling (ASPP) to exploit multi-scale features by employing multiple parallel filters with different rates. ASPP probes an incoming convolutional feature layer with filters at multiple sampling rates and effective fields-of-views, thus capturing objects and image context at various scales. However, this kind of structure often causes grid artifact [28], harming the model performance. At the same time, as the network depth increases, a large rate may cause the degradation of the convolution kernel. We propose guided atrous pyramid module for better global feature extraction. Besides different receptive field features, we use a one-to-one guild on each branch to guarantee the continuity of features.

The pipeline of proposed approach. Our network is in an encoder–decoder fashion. We denote the output feature maps of encoder and decoder as \(E^{(l)}\) and \(D^{(l)}\), receptively, where \(l \in (1, 2, 3, 4)\). The input image is first passed through the encoder to extract the multi-level features. Then, Guided Atrous Pyramid Module is applied on the top feature to extract \(E^{(5)}\). The decoder consists of four Query Context Modules to fuse \(E^{(5)}\) and the lower features \(E^{(1)} \sim E^{(4)}\) to make prediction. Each stage of the decoder has additional supervision to guarantee prediction quality
2.3 Attention models
Attention models are popularly used in recent neural networks. The main idea is the model should pay more attention to the region of interest to obtain more detailed information about the target so as to suppress other useless information. The visual attention mechanism dramatically improves the efficiency and accuracy of visual information processing. Islam et al. [29] applied gate units between each encoder and decoder blocks as attention models. These gate units control the feedforward message passing for the sake of filtering out ambiguous information. However, these message filters only happen between different level features within the encoder, which lack feature filter in the decoder phase. To avoid this, our query context module builds relationships between different level features based on high-quality semantic predictions step by step, making predictions while filtering ambiguous information.
2.4 Automatic surface inspection
Over the past two decades, numerous methods based on computer vision have been introduced to automatic surface inspection (ASI) problems [30,31,32], which can be generally divided into traditional detection approaches and deep learning-based approaches.
Traditional methods have mainly relied on hand-crafted features, such as statistical information [33], texture [17], distribution pattern [34]. Despite its efficiency, hand-crafted features are mostly focused on structural characteristics. The lack of semantic representations causes limited performance. Most of these models are heavily dependent on expertise, bring another obstacle to their application.
With the rapid development of deep learning, CNN-based methods have been introduced to the ASI field, surpassing the traditional methods by significantly improving [32]. Since Long et al. [11] proposed FCN to predict semantic labels at a pixel level, FCN-based models have been popularized in surface inspection fields, further improving the efficiency and accuracy of detection results. Yang et al. [35] used feature pyramid to transfer multi-scale context information from deep to shallow features and then used side networks to generate predictions, achieving good performance on pavement crack detection. Yan et al. [36] proposed defect type classification plus defect area segmentation task mode and mixed supervision network architecture, achieving good performance in four ASI tasks. In [37], Yang et al. proposed a multi-scale feature-clustering-based fully convolutional autoencoder method for texture defect detection. Although good results were achieved, most of these methods focus more on high-level features but neglect the importance of low-level edge features or relationships between them. In contrast, we use guided atrous pyramid module to extract more effective semantic information and then model the relationships between different resolution features with proposed query context modules, making more refined predictions step by step.
3 The proposed method
In this paper, we propose a Query Context Network (QCNet) with a novel Guided Atrous Pyramid Module (GAPM) and Query Context Modules (QCMs) to predict salient objects with entire object and exquisite boundaries. In this section, we begin by describing the complete pipeline of the model and then introduce the guided atrous pyramid module in Sect. 3.2, query context module in Sect. 3.3, segmentation head in Sect. 3.4, respectively.
3.1 Network overview
Similar to most previous approaches for salient object detection, we choose the ResNet50 [7] and VGG16 [8] as our backbone network and develop it in an encoder–decoder style. The network illustration is shown in Fig. 2. Four pairs of encoder and decoder blocks are denoted as \(E^{(l)}\) and \(D^{(l)}\); the corresponding prediction maps are denoted as \(S^{(l)}\), respectively (\(l \in {1, 2, 3, 4}\) represents the stage number). The output feature of GAPM denoted as \(E^{(5)}\).
Encoder network We modify the backbone network into a fully convolutional network by casting away the last fully connected layers. \(E^{(1)} \sim E^{(4)}\) are features after each stage, the downsample rate is 4, 8, 16, 32, respectively.
Guided atrous pyramid module The GAPM, described in Sect. 3.2, takes advantage of atrous convolution, extracting high-quality context semantic information from \(E^{(4)}\). This is the guide cue of the whole decoder phase.
Decoder network The decoder network consists of four QCMs and segmentation heads. We discuss the implementation details in Sects. 3.3 and 3.4. When training the network, every \(D^{(l)}\) estimates saliency maps \(S^{(l)}\) respectively, each is supervised by the same ground truth G. Particularly, we use binary cross-entropy loss on \(S^{(1)}\) and binary dice loss for others.
3.2 Guided atrous pyramid module
In this section, we revisit the structure of ASPP and design a guided atrous pyramid module for better semantic extraction. GAPM has three different atrous convolution branches, and the atrous rates are 12, 24, 36, respectively, which is larger than the ASPP module. Larger atrous rates bring wider receptive field, help capture global information, but cause degradation of convolution layer. So we add a global average pooling branch to alleviate the grid effect by set a basic vector to each feature map. Besides that, a one-to-one guide branch is added after each branch. The guide feature has complete spatial information; combined with global context from other branches, we can get the resulting feature map with richer semantic expressions. We add a weight merge mechanism before output for better feature reuse. The structure of GAPM is shown in Fig. 3.
GAPM is applied on the top feature of backbone outputs, which is denoted as \(E^{(4)}\):
where \(W_1\) denotes a 1x1 convolution layer.
Then, we use three convolution layers with different atrous rates and a global pooling layer to get multi-scale feature maps.
where (1) \(F_{concat}\) represents feature concatenation. (2) \(F^{a_i}\) denotes atrous convolution layers, \(a_i \in \{12, 24, 36\}\). (3) \(F_{gap}\) denotes a global average pooling layer.
We use weight merge in the output phase to guarantee better feature fusion.
where \(W_2\) denotes a global average pooling layer and a 1x1 convolution layer for weight calculation, \(W_3\) denotes a 1x1 convolution layer for output channel adjustment.

Illustration for guided atrous pyramid module

Architecture of query context module
3.3 Query context module
We control the message passing between encoder and decoder blocks via Query Context Module (QCM). QCM is a special information matching and filtering module, which takes the high-order semantic features as the key and the low-order structural features as the value. QCM will calculate the relationships between these two different type features in a pixel-wise manner, establishing correspondence between high-level semantic features and low-level structural features more accurately, thereby reducing the sharp step to object contour. The top semantic feature processed by GAPM (denote as \(E^{(5)}\)) has filtered most invalid information; thus, the accuracy of subsequent feature matching calculation can be guaranteed. At the same time, the matching calculation between different stage features can also help to screen out the redundant and incorrect information, and get the accurate predictions. Figure 4 shows the architecture of query context module.
The top feature of backbone (denoted as \(E^{(4)}\)) is first pass to GAPM, the output denoted as \(E^{(5)}\). \(E^{(5)}\) has more accurate and complete semantic features, which is the basis of the subsequent step. We denote \(x={x_{i}}_{i=1}^{N}\) as the feature map of one semantic feature (after upsampled by 2), \(y={y_{i}}_{i=1}^{N}\) as the feature map of one structure feature, respectively, where N is the number of positions in the feature map (\(N=H \cdot W\)), c denotes the global context feature, and z denotes the output of QCMs. We define a temporary variable t as:
The global context feature can be calculated as:
so the QCM can be expressed as:
where (1) i is the index of semantic feature and j is structure feature positions, respectively. (2) \(W_1\) and \(W_2\) denote linear transformation matrices (1x1 convolution layer in model). (3) LN denotes the Layer Normalization. (4) \(\delta \) (\(\cdot \)) denotes of fusion function to aggregate the spatial context and channel context.
The decoder phase consists of four QCM, which restores the target contour step by step, and finally obtains the prediction result.
3.4 Segmentation head
The downsample rates of \(D^{(1)} \sim D^{(4)}\) are 4, 8, 16, 32, respectively. The consecutive bilinear upsampling layers are applied on the feature map for matching the spatial resolution with \(D^{(1)}\). Then, we sum up all feature maps to pass through the segmentation head, which is a transposed convolution layer and a bilinear upsampling layer to get the final prediction, denoted as S. We also add segmentation head on four original feature maps to get the auxiliary prediction maps denoted as \(S^{(1)} \sim S^{(4)}\) to further supervise model training.
where \(i = {1, 2, 3, 4}\). \(F_{T}\) denotes a transposed convolution layer, and its exponent represents the number of uses. \(F_{head}\) denotes a transposed convolution layer and a bilinear upsampling layer.
The final prediction is represented as:
We use binary cross-entropy loss on the main branch and binary dice loss on four auxiliary branches for better object completeness. The loss function can be expressed:
where K denotes the number of auxiliary predictions (four in our model), \(L_{bce}\) denotes Binary Cross-Entropy (BCE) Loss, and \(L_{dice}\) denotes Binary Dice Loss.
BCE loss is widely used in binary segmentation tasks, which indicates the difference in the probability distribution between the predicted value and the ground truth, defined as:
Since the BCE loss focuses on estimating the overall classification accuracy of all pixels indiscriminately, we further adopt binary dice loss to enhance the regional consistency.
where \(N=H \cdot W\).
4 Experiment
4.1 Implementation details
We train our model using the DUTS-TR dataset and CFRP defect dataset. We choose ResNet50 [7] and VGG16 [8] as the backbone networks, which are commonly used in salient object detection models. Our system is implemented in PyTorch. We train our network on TianXp GPU for 50 epochs, with a base learning rate 0.0001, momentum 0.9, and weight decay 0.000001. The batch size is set to 7. The parameter of backbone is pretrained on ImageNet [38]. For other convolutional layers, we initialize the weights using Kaiming uniform [39]. We choose Adam optimizer to train our neural networks.
While inference, we cast all the auxiliary branches and use the output of the main branch as the final salient map.
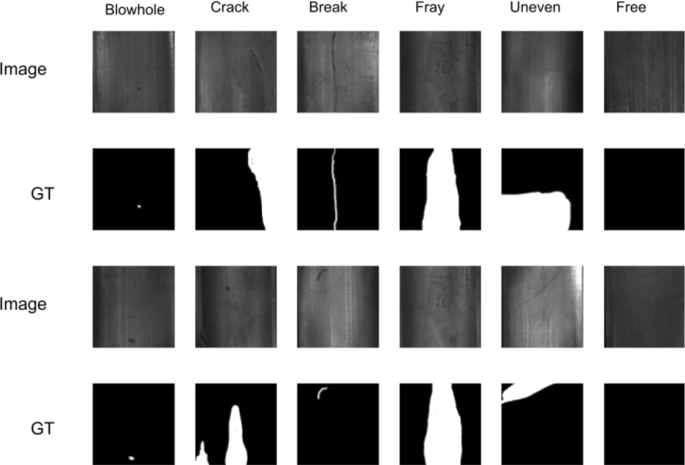
Examples of magnetic tile defect dataset
4.2 Datasets and evaluation metrics
To evaluate the performance of proposed method, we conduct experiments on five widely used salient object detections benchmarks: DUT-OMRON [40], DUTS [41], ECSSD [42], HKU-IS [43], PASCAL-S [44] and two ASI datasets: CFRP defect dataset and magnetic tile defect dataset [45].
DUT-OMRON [40] consists of 5168 high-quality images manually selected from more than 140000 images. This dataset is quite challenging since images could have more than one salient object, and its background is relatively complex. DUTS [41] contains 15572 images, 10553 for training and 5019 for testing. DUTS is the largest publicly available salient object detection benchmark; most of its images are challenging on both scale and scene. ECSSD [42] has 1000 images with various complex scenes. HKU-IS [43] contains 4777 images, 2500 for training, 500 for validation and 2000 for testing, many of which have more than one salient object. Disconnections of objects bring an extra difficulty to detection. PASCAL-S [44] contains 850 images which are hand-picked from the validation dataset of PASCAL VOC segmentation dataset [46].
CFRP dataset has a total of 460 images; we split the data into the training set and testing set according to the ratio of 7:3. The spatial size of all images is 1000x1000 and can be divided into seven categories according to different defect types: Break, Bridging, Disconnect, Foreign, Gap, Puckering, and Tow Defect. Magnetic tile defect dataset [45] contains 1344 images; the ROIs of the concerning surface of magnetic tile are cropped. There are six different defect types in this dataset, which are Blowhole, Crack, Fray, Break, Uneven, Free, receptively, shown in Fig. 5.
We apply horizontal flip as data augmentation method, and each image is resized to 384 (512 for ASI images) and normalized using the mean and std value provided by ResNet.
We evaluate the performance of our approach and other state-of-the-art methods with four widely used metrics: F-measure score, mean absolute error (MAE) [47], S-measure score [48] and E-measure score [49]. F-measure score, denoted as \(F_{\beta }\) , is the weighted harmonic mean of average precision and average recall, can be computed as follows:
we set \(\beta ^2\) to 0.3 suggested in [24] to weight precision more than recall. Following most salient object detection methods [50, 51], we report the maximum F-measure from all precision-recall pairs. The MAE [47] score is a measurement of the similarity between saliency map S and the ground truth G , formulated as:
where W and H denote the width and height of the saliency map, respectively. S-measure [48] is a structure-based metric, which is concentrated on structural information in the saliency maps. Compared to the above metrics, S-measure is more close to human visual perception, computed as:
where \(S_o\) and \(S_r\) denote the region-aware and object-aware structural similarity, \(\gamma \) is set to 0.5 by default.
E-measure [49] focuses more on global means of the image and local pixel matching, which can be represented as:
\(\phi _{s}\) denotes the enhanced alignment matrix, which reflects the correlation between S and G after subtracting their global means.
4.3 Comparison with the state-of-the-art
In this section, we compare our model with ten state-of-the-art methods, including BASNet [52], NLDF [53], CPD [54], EGNet [55], PiCANet [56], R3Net [57], PoolNet [58], U2Net [59], HVPNet [60] and SAMNet [61]. All the saliency maps are produced by running source codes or pre-computed by the authors.
Results on common salient object detection benchmarks. We evaluate the performance of the proposed method on five widely used salient object detection datasets in terms of F-measure, MAE, S-measure and E-measure. Tables 1 and 2 show the test results. We can conclude that our model can achieve SOTA results on natural images while keeping a fast inference speed.
Results on CFRP defect dataset Besides common SOD benchmarks, we conduct experiments on CFRP defect dataset to prove the generality of the proposed method. In this scenario, our model needs to predict the most notable object from the single-channel frames, which is slightly different from the previous tasks. Images from CFRP dataset are primarily in grayscale, detectors mainly focus on the change of image gray and morphological characteristics of the defect to get the final prediction. We evaluate the performance of our model with other SOTA SOD models in terms of F-measure, MAE, S-measure and E-measure, as shown in Table 3. It can be seen that our model outperforms other methods on all four evaluation metrics by a large margin. The F-measure, MAE, S-measure and E-measure are improved 8.25%, 2.04%, 4.06% and 3.40%, respectively. Note that this is achieved without any post-processing.
Results on magnetic tile defect dataset To further prove the effectiveness of the proposed method, we test it on the magnetic tile defect dataset. Our model can be easily applied to many ASI tasks without any specific process. The result is shown in Table 3. Our model achieves the sota performance on all four metrics.
Real-time performance comparison. From Tables 1, 2, and 3, we can see our model can run at 38 fps with an input size of 384 (ECSSD, HKU-IS, PASCAL-S, DUT-O, DUTS-TE) and 27 fps with an input size of 512 (CFRP and Magnetic Tile defect dataset), which achieves good performance while keeping a real-time inference speed. We further tested the CPU inference time of each model as a reference (Intel i7 7700), and the results are also shown in tables.

Visualization of heat map

Visual comparison with state-of-the-art methods
4.4 Ablation experiments
In this section, we explore the effect of proposed components in QCNet. All experiments are based on the DUTS-TE and CFRP datasets, respectively, and use ResNet50 as the backbone network. For comparison, we set a baseline model that replaces the GAPM and QCM with ASPP and FPN, respectively.
4.4.1 Extractor of semantic feature
In this subsection, we explore the effectiveness of the proposed GAPM. In the baseline model, we use ASPP to extract semantic information. The output of the backbone model \(E^{(4)}\) is passed into the ASPP module. We denote the result semantic feature as \({\hat{E}}^{(5)}\). We replace the ASPP with proposed GAPM, and extract the \(E^{(5)}\) and \({\hat{E}}^{(5)}\) from two models and compare their completeness and accuracy of semantic information. The resulting heat map is shown in Fig. 6. The middle two columns and the last two columns show the heat maps of the DUTS-TE and CFRP datasets, respectively. We can see that the model with GAPM can locate the target more accurately and suppress the interference elements well. At the same time, we test the performance of these two strategies, shown in the second row of Tables 4 and 5. Both results show proposed GAPM works better in semantic feature extraction, which sets a better basis for the following process.
4.4.2 Bottom-up feature propagation
In this subsection, we explore the superiority of the proposed QCM. Compared to baseline, we remove all FPN Blocks and replace them with QCM in the decoder phase. The test result is shown in the third row of Tables 4 and 5. We can find that QCM can significantly improve model performance on four evaluation metrics. Meanwhile, combined with GAPM, the final evaluation result greatly improved from baseline, shown in the fourth row of Tables 4 and 5. The model was beyond baseline at 2.21%(7.64%) on F-measure, 7.89%(6.25%) on MAE, 1.14%(3.05%) on S-measure and 1.04%(3.17%) on E-measure, respectively.
4.4.3 Visual comparison
To further illustrate the superiority of the proposed method, we show the qualitative comparison with other ten SOTA models. As shown in Fig. 7, our model is able to accurately segment the target in both natural scenes (first four rows) and ASI tasks (last four rows). In addition, the segmentation results of our model have better completeness and sharper boundaries.
5 Conclusion
This paper proposes a salient-guided salient object detection paradigm, which has excellent segmentation results and less computational cost. Based on this idea, we first extract salient object information under multiple different adaptive fields. Then, we propose a query context module to build relations between salient and edge information, which gradually restores object boundaries stage by stage. The whole network is capable of capturing complete objects and preserving exquisite edges. Meanwhile, the proposed model can be easily transferred to the surface defect detection field. This model performs favorably against the state-of-the-art methods on salient object detection and surface defect detection benchmarks without any post-processing. Besides that, our model can run at a real-time speed of 27 FPS.
In the future, we will focus on two directions as follows: The one is data augmentation technology due to the expensive manual annotations in defect detection datasets. The other is extending our work to 3D detection tasks.
Data Availability
The code and data used to support the findings of this article are available at: https://github.com/sunjie97/QCNet.
References
Donoser, M., Urschler, M., Hirzer, M., Bischof, H.: Saliency driven total variation segmentation. In 2009 IEEE 12th international conference on computer vision, pp. 817-824 (2009)
Borji, A., Frintrop, S., Sihite, D. N., Itti, L.: Adaptive object tracking by learning background context. In 2012 IEEE computer society conference on computer vision and pattern recognition workshops, pp. 23-30 (2012)
Hong, S., You, T., Kwak, S., Han, B.: Online tracking by learning discriminative saliency map with convolutional neural network. In International conference on machine learning, pp. 597-606 (2015)
Zhao, H., Mao, X., Jin, X., Shen, J., Wei, F., Feng, J.: Real-time saliency-aware video abstraction. Vis. Comput. 25(11), 973–984 (2009)
Cheng, M.M., Zhang, F.L., Mitra, N.J., Huang, X., Hu, S.M.: Repfinder: finding approximately repeated scene elements for image editing. ACM Trans. Graph. 29(4), 1–8 (2010)
LeCun, Y., Bengio, Y., Hinton, G.: Deep learning. Nature 521(7553), 436–444 (2015)
He, K., Zhang, X., Ren, S., Sun, J.: Deep residual learning for image recognition. In Proceedings of the IEEE conference on computer vision and pattern recognition, pp. 770-778 (2016)
Simonyan, K., Zisserman, A.: Very deep convolutional networks for large-scale image recognition. arXiv preprint arXiv:1409.1556. (2014)
Liu, Z., Xiang, Q., Tang, J., Wang, Y., Zhao, P.: Robust salient object detection for RGB images. Vis. Comput. 36(9), 1823–1835 (2020)
Liu, Z., Tang, J., Zhao, P.: Salient object detection via hybrid upsampling and hybrid loss computing. Vis. Comput. 36(4), 843–853 (2020)
Long, J., Shelhamer, E., Darrell, T.: Fully convolutional networks for semantic segmentation. In Proceedings of the IEEE conference on computer vision and pattern recognition, pp. 3431-3440 (2015)
Feng, M., Lu, H., Ding, E.: Attentive feedback network for boundary-aware salient object detection. In Proceedings of the IEEE/CVF conference on computer vision and pattern recognition, pp. 1623-1632 (2019)
Xie, S., Tu, Z.: Holistically-nested edge detection. In Proceedings of the IEEE international conference on computer vision, pp. 1395-1403 (2015)
Wang, B., Chen, S., Wang, J., Hu, X.: Residual feature pyramid networks for salient object detection. Vis. Comput. 36(9), 1897–1908 (2020)
Wang, P., Chen, P., Yuan, Y., Liu, D., Huang, Z., Hou, X., Cottrell, G.: Understanding convolution for semantic segmentation. In 2018 IEEE winter conference on applications of computer vision, pp. 1451-1460 (2018)
Wang, L., Wang, L., Lu, H., Zhang, P., Ruan, X.: Salient object detection with recurrent fully convolutional networks. IEEE Trans. Pattern Anal. Mach. Intell. 41(7), 1734–1746 (2018)
Bai, X., Fang, Y., Lin, W., Wang, L., Ju, B.F.: Saliency-based defect detection in industrial images by using phase spectrum. IEEE Trans. Industr. Inf. 10(4), 2135–2145 (2014)
He, Y., Song, K., Meng, Q., Yan, Y.: An end-to-end steel surface defect detection approach via fusing multiple hierarchical features. IEEE Trans. Instrum. Meas. 69(4), 1493–1504 (2019)
Jumaat, M.Z., Rahman, M.M., Alam, M.A.: Flexural strengthening of RC continuous T beam using CFRP laminate: a review. Int. J. Phys. Sci. 5(6), 619–625 (2010)
Liu, Y., Zwingmann, B., Schlaich, M.: Carbon fiber reinforced polymer for cable structures-a review. Polymers 7(10), 2078–2099 (2015)
Soutis, C.: Fibre reinforced composites in aircraft construction. Prog. Aerosp. Sci. 41(2), 143–151 (2005)
Baker, A.: Bonded composite repair of fatigue-cracked primary aircraft structure. Compos. Struct. 47(1–4), 431–443 (1999)
Klein, D. A., Frintrop, S.: Center-surround divergence of feature statistics for salient object detection. In 2011 International conference on computer vision, pp. 2214-2219 (2011)
Cheng, M.M., Mitra, N.J., Huang, X., Torr, P.H., Hu, S.M.: Global contrast based salient region detection. IEEE Trans. Pattern Anal. Mach. Intell. 37(3), 569–582 (2014)
Yan, S., Song, X., Yu, C.: SDCNet: Size divide and conquer network for salient object detection. In Proceedings of the Asian conference on computer vision. (2020)
Wu, Z., Shen, C., Hengel, A. V. D.: Bridging category-level and instance-level semantic image segmentation. arXiv preprint arXiv:1605.06885 (2016)
Chen, L.C., Papandreou, G., Kokkinos, I., Murphy, K., Yuille, A.L.: Deeplab: semantic image segmentation with deep convolutional nets, atrous convolution, and fully connected crfs. IEEE Trans. Pattern Anal. Mach. Intell. 40(4), 834–848 (2017)
Mehta, S., Rastegari, M., Caspi, A., Shapiro, L., Hajishirzi, H.: Espnet: Efficient spatial pyramid of dilated convolutions for semantic segmentation. In Proceedings of the European conference on computer vision, pp. 552-568 (2018)
Amirul Islam, M., Rochan, M., Bruce, N. D., Wang, Y.: Gated feedback refinement network for dense image labeling. In Proceedings of the IEEE conference on computer vision and pattern recognition, pp. 3751-3759 (2017)
Zhang, H., Jin, X., Wu, Q.J., Wang, Y., He, Z., Yang, Y.: Automatic visual detection system of railway surface defects with curvature filter and improved Gaussian mixture model. IEEE Trans. Instrum. Meas. 67(7), 1593–1608 (2018)
Wang, H., Zhang, J., Tian, Y., Chen, H., Sun, H., Liu, K.: A simple guidance template-based defect detection method for strip steel surfaces. IEEE Trans. Industr. Inf. 15(5), 2798–2809 (2018)
Dong, H., Song, K., He, Y., Xu, J., Yan, Y., Meng, Q.: PGA-Net: pyramid feature fusion and global context attention network for automated surface defect detection. IEEE Trans. Industr. Inf. 16(12), 7448–7458 (2019)
Win, M., Bushroa, A.R., Hassan, M.A., Hilman, N.M., Ide-Ektessabi, A.: A contrast adjustment thresholding method for surface defect detection based on mesoscopy. IEEE Trans. Industr. Inf. 11(3), 642–649 (2015)
Xie, X., Mirmehdi, M.: Texture exemplars for defect detection on random textures. In International conference on pattern recognition and image analysis, pp. 404-413 (2005)
Yang, F., Zhang, L., Yu, S., Prokhorov, D., Mei, X., Ling, H.: Feature pyramid and hierarchical boosting network for pavement crack detection. IEEE Trans. Intell. Transp. Syst. 21(4), 1525–1535 (2019)
Yan, S., Song, X., Liu, G.: Deeper and mixed supervision for salient object detection in automated surface inspection. Math. Probl. Eng. (2020)
Yang, H., Chen, Y., Song, K., Yin, Z.: Multiscale feature-clustering-based fully convolutional autoencoder for fast accurate visual inspection of texture surface defects. IEEE Trans. Autom. Sci. Eng. 16(3), 1450–1467 (2019)
Deng, J., Dong, W., Socher, R., Li, L. J., Li, K., Fei-Fei, L.: Imagenet: a large-scale hierarchical image database. In 2009 IEEE conference on computer vision and pattern recognition, pp. 248-255 (2009)
He, K., Zhang, X., Ren, S., Sun, J.: Delving deep into rectifiers: surpassing human-level performance on imagenet classification. In Proceedings of the IEEE international conference on computer vision, pp. 1026-1034 (2015)
Yang, C., Zhang, L., Lu, H., Ruan, X., Yang, M. H.: Saliency detection via graph-based manifold ranking. In Proceedings of the IEEE conference on computer vision and pattern recognition, pp. 3166-3173 (2013)
Wang, L., Lu, H., Wang, Y., Feng, M., Wang, D., Yin, B., Ruan, X.: Learning to detect salient objects with image-level supervision. In Proceedings of the IEEE conference on computer vision and pattern recognition, pp. 136-145 (2017)
Yan, Q., Xu, L., Shi, J., Jia, J.: Hierarchical saliency detection. In Proceedings of the IEEE conference on computer vision and pattern recognition, pp. 1155-1162 (2013)
Li, G., Yu, Y.: Visual saliency based on multiscale deep features. In Proceedings of the IEEE conference on computer vision and pattern recognition, pp. 5455-5463 (2015)
Li, Y., Hou, X., Koch, C., Rehg, J. M., Yuille, A. L.: The secrets of salient object segmentation. In Proceedings of the IEEE conference on computer vision and pattern recognition, pp. 280-287 (2014)
Huang, Y., Qiu, C., Yuan, K.: Surface defect saliency of magnetic tile. Vis. Comput. 36(1), 85–96 (2020)
Li, Y., Hou, X., Koch, C., Rehg, J. M., Yuille, A. L.: The secrets of salient object segmentation. In Proceedings of the IEEE conference on computer vision and pattern recognition, pp. 280-287 (2010)
Borji, A., Cheng, M.M., Jiang, H., Li, J.: Salient object detection: a benchmark. IEEE Trans. Image Process. 24(12), 5706–5722 (2015)
Fan, D. P., Cheng, M. M., Liu, Y., Li, T., Borji, A.: Structure-measure: a new way to evaluate foreground maps. In Proceedings of the IEEE international conference on computer vision, pp. 4548-4557 (2017)
Fan, D. P., Gong, C., Cao, Y., Ren, B., Cheng, M. M., Borji, A.: Enhanced-alignment measure for binary foreground map evaluation. arXiv preprint arXiv:1805.10421. (2018)
Hou, Q., Cheng, M. M., Hu, X., Borji, A., Tu, Z., Torr, P. H.: Deeply supervised salient object detection with short connections. In Proceedings of the IEEE conference on computer vision and pattern recognition, pp. 3203-3212 (2017)
Liu, N., Han, J.: Dhsnet: deep hierarchical saliency network for salient object detection. In Proceedings of the IEEE conference on computer vision and pattern recognition, pp. 678-686 (2016)
Qin, X., Zhang, Z., Huang, C., Gao, C., Dehghan, M., Jagersand, M.: Basnet: boundary-aware salient object detection. In Proceedings of the IEEE/CVF conference on computer vision and pattern recognition, pp. 7479-7489 (2019)
Luo, Z., Mishra, A., Achkar, A., Eichel, J., Li, S., Jodoin, P. M.: Non-local deep features for salient object detection. In Proceedings of the IEEE conference on computer vision and pattern recognition, pp. 6609-6617 (2017)
Wu, Z., Su, L., Huang, Q.: Cascaded partial decoder for fast and accurate salient object detection. In Proceedings of the IEEE/CVF conference on computer vision and pattern recognition, pp. 3907-3916 (2019)
Zhao, J. X., Liu, J. J., Fan, D. P., Cao, Y., Yang, J., Cheng, M. M.: EGNet: Edge guidance network for salient object detection. In Proceedings of the IEEE/CVF international conference on computer vision, pp. 8779-8788 (2019)
Liu, N., Han, J., Yang, M. H.: Picanet: learning pixel-wise contextual attention for saliency detection. In Proceedings of the IEEE conference on computer vision and pattern recognition, pp. 3089-3098 (2018)
Deng, Z., Hu, X., Zhu, L., Xu, X., Qin, J., Han, G., Heng, P. A.: R3net: recurrent residual refinement network for saliency detection. In Proceedings of the 27th international joint conference on artificial intelligence, pp. 684-690 (2018)
Liu, J. J., Hou, Q., Cheng, M. M., Feng, J., Jiang, J.: A simple pooling-based design for real-time salient object detection. In Proceedings of the IEEE/CVF conference on computer vision and pattern recognition, pp. 3917-3926 (2019)
Qin, X., Zhang, Z., Huang, C., Dehghan, M., Zaiane, O.R., Jagersand, Martin: U2-Net: going deeper with nested U-structure for salient object detection. Pattern Recogn. 106, 107404 (2020). https://doi.org/10.1016/j.patcog.2020.107404
Liu, Y., Gu, Y.-C., Zhang, X.-Y., Wang, W., Cheng, Ming-Ming.: Lightweight salient object detection via hierarchical visual perception learning. IEEE Trans. Cybern. 51(9), 4439–4449 (2021). https://doi.org/10.1109/TCYB.2020.3035613
Liu, Y., Zhang, X.Y., Bian, J.W., Zhang, L., Cheng, M.M.: Samnet: stereoscopically attentive multi-scale network for lightweight salient object detection. IEEE Trans. Image Process. 30, 3804–3814 (2021)
Acknowledgements
The work was supported by the Key Program of the National Natural Science Foundation of China (Grant No. 91948301) and the Key Research and Development Plan of Zhejiang (No. 2020C01039).
Author information
Authors and Affiliations
Corresponding author
Ethics declarations
Conflict of interest
The authors declare no known potential conflicts of interest with respect to financial interests or the research, authorship, and publication of this article.
Additional information
Publisher's Note
Springer Nature remains neutral with regard to jurisdictional claims in published maps and institutional affiliations.
Rights and permissions
Open Access This article is licensed under a Creative Commons Attribution 4.0 International License, which permits use, sharing, adaptation, distribution and reproduction in any medium or format, as long as you give appropriate credit to the original author(s) and the source, provide a link to the Creative Commons licence, and indicate if changes were made. The images or other third party material in this article are included in the article’s Creative Commons licence, unless indicated otherwise in a credit line to the material. If material is not included in the article’s Creative Commons licence and your intended use is not permitted by statutory regulation or exceeds the permitted use, you will need to obtain permission directly from the copyright holder. To view a copy of this licence, visit http://creativecommons.org/licenses/by/4.0/.
About this article

Cite this article
Sun, J., Yan, S. & Song, X. QCNet: query context network for salient object detection of automatic surface inspection. Vis Comput 39, 4391–4403 (2023). https://doi.org/10.1007/s00371-022-02597-w
Accepted:
Published:
Issue Date:
DOI: https://doi.org/10.1007/s00371-022-02597-w