
Abstract
This research aims to examine the machinability and form tolerances in die sinking EDM for Ni-based superalloy with different diameter internally engraved hole of the multi-hole copper electrode. Manufacturing of superalloys with close tolerances is becoming a major area for primary research in defence and aerospace industries due to their particular characteristics. Therefore, this work focuses on an experimental analysis to improve the productivity and Material Removal Rate of Inconel-718 with close tolerances. The most dominating process constraints, viz. hole diameter of Multi-hole electrode (D), Peak current (Ip), Pulse on Time (Ton) and dielectric fluid pressure were selected as process constraints to conduct experimental trials. The Material Removal Rate, EWR and form tolerances were considered as output responses. The experimental outcomes were optimized by Taguchi analysis and multi-parametric optimization method GRA. A Fuzzy logic model using Matlab was developed for the prediction of performance parameters, namely MRR, EWR, circularity and cylindricity with respect to changes in input parameters. Three MF’s (‘Trimf-triangular membership functions’) were allocated to each input response, whereas five MF’s were allocated to output responses. The Fuzzy model shows the 94.01% accuracy between the experimental values and the predicted values. From the results, it is concluded that the use of a multi-hole electrode leads to a higher rate of MRR. Moreover, the form tolerance deviation improves with the increment of Ton value. The optimized parameters showed a considerable improvement in the process and will facilitate the aerospace and defence industries to improve the productivity of Inconel-718 with close tolerance.
1 Introduction
Highly precise products with close tolerances are manufactured by non-conventional machining methods in aerospace and defence industries. Specifically, electric discharge machining (EDM) is practically versatile applications of non-conventional machining in precision manufacturing industries to manufacture precise and close tolerance parts with higher accuracy. Therefore, it is the requirement that regular estimations should be made to measure the form tolerances [1,2,3,4,– 5].
The schematic of the EDM is illustrated in Fig. 1. When a suitable voltage is supplied across the cathode (tool) and anode (workpiece), an electrostatic field of high strength is established which cause emission of an electron from the tool. The emitted electrons get accelerated towards workpiece and collide with the dielectric fields molecules, breaking them into electrons and ions [6, 7]. The produced electrons accelerate and dislodge. As a result, a spark is produced between anode and cathode and a very high temperature is developed on the electrode. The high temperature causes melting and vaporization of the material. EDM is used to manufacture precise and difficult- to- machine materials such as superalloys [8,9,10].
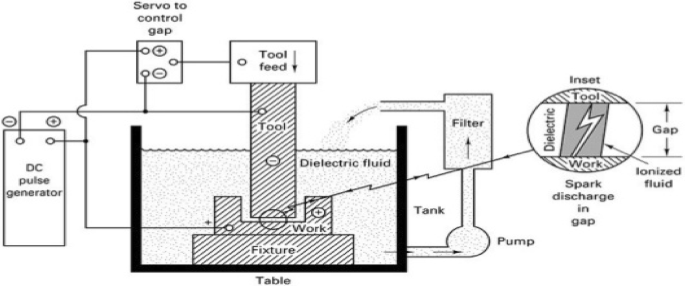
Schematic of electric discharge machining (EDM)
Nickel-based superalloys are extensively used in high precision components because of its excellent properties [11,12,13]. However, based on the properties Inconel 625 is a well identified difficult-to-machine superalloy [14]. Inconel 625 wrought superalloy has a high cutting temperature due to its lesser thermal conductivity and specific heat. Furthermore, built-up edge (BUE) engrave at the tip of the tool, when this super-alloy is machined by using traditional machining processes. Therefore, EDM has been explored for the machining of this superalloy by using copper and brass electrodes [15).
Various researchers have been reported work on EDM to measure the influence of input parameters on performance parameters. As an attempt to use the EDM process effectively, researchers reported the dominance of EDM parameters in hole drilling of nickel-based superalloy [16].
Narender Singh presented multiple performance characteristics optimizations for EDM constraints by applying the Taguchi based Grey relational Analysis method (GRA) for AL-10% SiC composites. Li demonstrated the application of grey-fuzzy logic based orthogonal array (OA) for optimization [15].
Form Tolerance may be described as the deviation between the maximal and minimal limits and the total measure that a particular dimension is allowed to deviate. Tolerances are specified generally by two methods; unilateral tolerance and the bilateral tolerance. Unilateral tolerance allows the variance for a nominal measure in one direction only, whereas the bilateral tolerance allows the dimensional variation in both the directions from the specified value [2, 17, 18].
Specification of Cylindricity/Circularity Tolerance is the condition of a cylindrical and cone surface in which entire points of the intersected surface by the plane perpendicular to an axis are at equal distance from that axis. It is a geometric tolerance that restrains the radial difference between the highest and lowest points in an element. It never uses a datum feature reference and can only be applied to a circular cross-section (i.e. sphere, cylinder, cone etc.). Tolerances for circular shape elements are lobbying, ovality and irregular shape. Circularity is a perfect condition & it results in perfect circular elements. However, the perfect conditions cannot be developed, therefore, it’s essential to determine the tolerance for deviation from circularity. Cylindricity is the circumstance of a surface rotation where all levels of the surface are at equal distance from the common axis. It never uses a datum reference and can only be applied to a single cylindrical element. Cylindricity tolerance is the deviation permitted on a cylindrical surface. Cylindricity tolerance zone is the length between two axial cylinders & this distance is equalising to the tolerance value 8, 10, 19, 20] (Fig. 2).

Test for a standard-compliant circularity/cylindricity specification
Stanislaw [8] investigated the importance of cylindricity measurement by using the reference method. Adamczak presented the principle of reference method and also presented the method for comparing the cylindrical profile [22, 23] measured and analyzed the cylindricity, diameter, roundness, straightness and taper for EDM micro-holes by using coordinate measuring machine (CMM). Therefore, the importance of form tolerance in manufacture components was discussed.
Volkan Yilmaz and Murat Sarikaya et al. [24,25,26] optimized the EDM performance parameters namely machining rate, WR (wear rate), AOC (average over-cut) and taper angle by using Taguchi, RSM, Regression analysis and ANNs (artificial neural networks) for µ-EDD (Electrical discharge drilling) of AISI-304 SS and Hand field steel. The authors concluded that discharge current had the most significance on performance parameters. Guren Meral et al. [27] statistically optimized the Ra value, torque and thrust force for two drill geometries on AISI-4140 using Taguchi based GRA method.
Some researchers have been reported the use of different shape Cu electrodes and multihole electrodes to predict the machinability in the EDM process [28,29,30,31,32,33,34,35,36,37,38,39]. Wl-Taweel [28] concluded that the Al-Cu-Si-TiC powder sintered electrodes are more sensitive to Ton (pulse on time) and peak current. Khan [29] demonstrated the effect of Cu and brass electrodes to measure electrode wear and MRR (material removal rate) during EDM of Al and mild steel. The author concluded that the Cu electrode has a low wear rate and highest MRR as compared to the brass electrode. The wear rate increases with the increase in both voltage and current. Kin et al. [35] concluded that the machinability of Cu electrode is higher and the bigger DIA. Of multihole electrode reduces the MRR. Govindan and Murugesan et al. [36, 37] investigated and optimized the EDM parameters by GRA method using multihole electrodes.
From the literature survey, it is ascertained that no plausible works were reported to measure form tolerances such as cylindricity and circularity on an Inconel-718 Ni-based superalloy using a different diameter circular shape multi-hole copper electrode in EDM process. Therefore, this experimental analysis and multi-objective optimization work being undertaken to improve the form tolerances in EDM by Taguchi analysis, Fuzzy logic and GRA method.
2 Experimental setup
Design-of-experiments (DoE) needs cautions scheduling, practical layout of the trials, Taguchi has identical procedures for every DoE application steps and the DoE can dramatically decrease the number of trials [21, 40] Thus, the four major process constraints viz. Hole DIA. Of multi-hole electrode, Peak current (Ip), pulse on time (Ton) and dielectric fluid pressure had selected for the governing parameter, and each parametric quantity had three levels, as designated in Table 1.
Bruker SI turbo Analyzer and Hardness Tester HT-7 were used to measure the chemical composition and the hardness values of Inconel-718 plate. As per DoE (design of experiment), the experiments were performed on 15 amps rated die-sinking SPARONIX-EDM. The different diameters of multi-holes were engraved by laser drilling. The EDM set-up and different diameters multi-hole copper electrodes used for experimentation are shown in Fig. 3a, b.

a Experimental set-up of die sinking SPARKONIX-EDM; b Different DIA, multi-hole Cu electrodes
The Inconel-718 workpiece was used in the form of a 4 mm thick rectangular plate. The workpiece and the electrodes were linked up with +ve and –ve polarity in the D.C. power source, respectively. Die-electric kerosene along with various pressure ranges was used with centre flushing technique for the experimental work. The weight of the electrodes and workpiece was measured before and after machining for every trial run with digital weight-balance (up to 0.001-g accuracy).
The mathematical relation used to evaluate the material removal rate (MRR) is given in Eq. 1.
The mathematical relation used to calculate the electrode wear rate (EWR) is given below in Eq. 2.
Each trial was evaluated thrice and the mean values were obtained. The form tolerances namely cylindricity and circularity were measured by using a TESA Micro-Hite 3D co-ordinate measuring machine (CMM).
3 Form tolerance analysis
The aim of this experimental analysis is to increase the MRR and to minimize the value of form tolerances namely cylindricity and circularity. In the present experimentation work, L9 (3**4) orthogonal array (OA) was chosen. This OA has 9 constraints combinations, therefore; the total numbers of 9 experiments were conducted to measure the interactions between the various factors. The parameter combinations using the L9 OA are expressed in Table 2.
For accurate measurements minimum, three values were taken for each specimen and the mean value was selected. The mean values of the MRR, EWR and form tolerances such as circularity and cylindricity are shown in Table 3.
3.1 Taguchi analysis of circular profile multi-hole Cu electrode
Taguchi analysis is used for the selection of best-optimized parameter value for the individual process parameter and to measure the influence of each parameter at different levels.
3.1.1 Dominance of input constraints on MRR
The ANOVA main effect plot for data means shows the effect of an individual parameter at a different level of MRR. For the measurement of MRR, larger is better (S/N) was utilized because the maximum value of MRR means the higher rate of production. Therefore, for the measurement of MRR, ‘Larger is better’ ratio is used.
The MRR value is maximum at the level-2 of Elec. Hole DIA., level-3 of (Ip), level-3 of (Ton) and level-2 of dielectric fluid pressure, as givenn in Table 4. Therefore, these are the best-optimized values of parameters for MRR. The rank is given as 1, 2 3 & 4 in Table 5 shows the most influencing parameters for MRR. For MRR, peak current (Ip) and dielectric fluid pressure is the most influencing constraint, whereas the Ton and DIA. of an electrode has the least significance.
The influence on MRR in relation to changes in input variables is presented in Fig. 4.

Dominance on MRR in relation to change of process constraints a Ip and dielectric fluid pressure; b Ton and Toff
3.1.2 Influence of input constraints on EWR
The ANOVA main effect plot for data means indicate the effect of an individual parameter at a different level of EWR (electrode wear rate). For the measurement of EWR, Smaller is better (S/N) was utilized because the minimum value of EWR means the higher accuracy of production and tool life. Therefore, for the measurement of EWR, ‘Smaller is better’ ratio is used.
From the main effect for data means the EWR is minimum at the 3rd level of DIA. of the multi-hole electrode, 2nd level of Ip, 2nd level of Ton and 3rd level of dielectric fluid pressure, as given in Table 7. Therefore, these are the best-optimized values of parameters for EWR. The rank is given as 1, 2 3 & 4 in Table 6 shows the most influencing parameters for EWR. For EWR, Ton is the most dominating constraint whereas the DIA. of the multi-hole electrode has the least significance.
The influence on EWR in relation to changes in input variables is illustrated in Fig. 5.

Influence on EWR in relation to change of process constraints a Elec. Multi-hole diameter and dielectric fluid pressure; b Ip and Ton
3.1.3 Dominance of input parameters on circularity
The ANOVA main effect plot presents the effect of an individual parameter at the different level of form tolerance namely circularity. For the measurement of circularity, smaller is better (S/N) was utilized because the minimum value of circularity deviation means the higher precision and accuracy. Therefore, for the measurement of circularity, ‘Smaller is better’ ratio is used.
From the main effect for data means the circularity form tolerance is minimum at the 1st level of DIA. of the multi-hole electrode, 2nd level of Ip, 2nd level of Ton and 1st level of dielectric fluid pressure, as given in Table 8. Therefore, these are the best-optimized values of parameters for circularity. Dielectric fluid pressure and Ip are the most influencing constraint for circularity, whereas the DIA. of multi-hole electrode and Ton has the least significance, as shown in Table 9.
The influence on circularity in relation to changes in input variables is presented in Fig. 6.

Influence on Circularity in relation to change of process constraints a Elec. Multi-hole DIA. and dielectric fluid pressure; b Ip and Ton
3.1.4 Dominance of input parameters on cylindricity
The ANOVA main effect plot is showing the effect of an individual parameter at a different level of Cylindricity tolerance. For the measurement of cylindricity form tolerance, smaller is better (S/N) ratio was used because the minimum value of cylindricity deviation means the highest precision and accuracy. Therefore, for the measurement of cylindricity, ‘Smaller is better’ ratio is used.
From the main effect for data means, cylindricity form tolerance is minimum at the 3rd level of DIA. of the multi-hole electrode, 2nd level of Ip, 3rd level of Ton and 1st level of dielectric fluid pressure, as given in Tables 10 and 11. Therefore, these are the best-optimized values of parameters for cylindricity. Dielectric fluid pressure and DIA. of Multihole electrode are the most influencing parameter for cylindricity, whereas the Ton and IP have less significance.
The influence on Circularity in relation to change of variables is presented in Fig. 7.

Influence on Cylindricity in relation to change of a Ip and dielectric fluid pressure; b Ton and Elec. Multi-hole DIA
4 Multi-parametric optimization using the Grey relational method
The steps used for multi-parametric optimization using the Grey relational analysis are discussed below [40, 41]:
(a) Normalization of the all experimental results of MRR, EWR, Machining Time and form tolerances such as the angle and flatness: Linear normalization of experimental values is performed in the range of 0 and 1. The normalized values for output responses were calculated by using the standard formula:
where yij = ith experiment results in jth experiment.
(b) Calculation for the Grey relational coefficients:
Grey relational coefficients are evaluated to express the relation between the ideal and factual experimental consequences. The standard formula used for the computation of Grey relational coefficients is given below:
where \({x^\circ_{i} - x_{i} }\) = ideal normalized result.
(c) Calculation for the Grey relational grade:
Grey relational grades as shown in Table 12 are evaluated by the average of Grey relational coefficient using the formula given below:
where
-
αj = Grey relational grade
-
m = No. of execution grade characteristics.
(d) Calculation of the optimum levels: optimum levels are calculated to find the significant parameters as shown in Table 13.
(e) Selection of the optimal levels of process parameters by taking the highest values of levels for each parameter from the optimum level table. The Response table is clearly indicating the level values for process parameters. The highest value of process parameters for each parameter showed the best-optimized value.
(f) Confirmation of experiment and verification of the optimized process parameters.
4.1 Confirmation of experiment
After obtaining the optimized values of process parameters the last step is to confirm the experimentation as shown in Table 14.
The estimated Grey relational grade can be calculated from the following given relation:
where αm = Total mean of the Grey relational grade at optimum level, q = No. of process parameters.
5 Fuzzy logic modelling for performance predictions
For Fuzzyfication, the triangular-shaped function was used to describe the input variables and trimf- shaped functions were practised for output variables. ‘Trimf (triangular MF’s) is frequently used because this function has inclined and decline features with one certain value’. Three trimf MF’s were used for each variable as input, namely Low (L), Medium (M) and High (H) and five trimf MF’s were used for the output variables (MRR, EWR and form tolerance) namely Very Low (VL), Low (L), Average (Avg.), Good and Excellent. The linguistic variables and fuzzy expressions are mentioned in Table 15. The MF’s for fuzzy-set input are engraved hole diameter of Multi-hole electrode (D), Peak current (Ip), Pulse on Time (Ton) and dielectric fluid pressure whereas the membership functions of fuzzy set output (MRR, EWR and form tolerance) are shown in Fig. 8

Trimf MF’s for Input and output variables (fuzzy-logic designer)
5.1 Structure of fuzzy rules
The Fuzzy rules as illustrated in Fig. 9 were built based on the actual observational results and a set of 9 rules were constructed as given below:
-
1.
If (Electrode hole DIA. is Small) and (Ip is L) and (Ton is L) and (Dielectric fluid pressure is L) then (MRR is VL) (EWR is H) and (Circularity is Avg.) and (Cylindricity is Avg.).
-
2.
If (Electrode hole DIA. is Small) and (Ip is M) and (Ton is M) and (Dielectric fluid pressure is Avg.) then (MRR is Good) (EWR is Avg.) and (Circularity is VL) and (Cylindricity is VL).
-
3.
If (Electrode hole DIA. is Small) and (Ip is H) and (Ton is H) and (Dielectric fluid pressure is H) then (MRR is Excellent) (EWR is Avg.) and (Circularity is L) and (Cylindricity is H).
-
4.
If (Electrode hole DIA. is M) and (Ip is L) and (Ton is M) and (Dielectric fluid pressure is H) then (MRR is Avg.) (EWR is L) and (Circularity is L) and (Cylindricity is VH).
-
5.
If (Electrode hole DIA. is M) and (Ip is M) and (Ton is H) and (Dielectric fluid pressure is L) then (MRR is Good) (EWR is L) and (Circularity is VL) and (Cylindricity is VL).
-
6.
If (Electrode hole DIA. is M) and (Ip is H) and (Ton is M) and (Dielectric fluid pressure is Avg.) then (MRR is Excellent) (EWR is VH) and (Circularity is L) and (Cylindricity is Avg.).
-
7.
If (Electrode hole DIA. is Large) and (Ip is L) and (Ton is H) and (Dielectric fluid pressure is Avg.) then (MRR is Avg.) (EWR is L) and (Circularity is VH) and (Cylindricity is VL).
-
8.
If (Electrode hole DIA. is Large) and (Ip is M) and (Ton is L) and (Dielectric fluid pressure is H) then (MRR is Avg.) (EWR is L) and (Circularity is L) and (Cylindricity is Avg.).
-
9.
If (Electrode hole DIA. is Large) and (Ip is H) and (Ton is M) and (Dielectric fluid pressure is L) then (MRR is Avg.) (EWR is L) and (Circularity is VL) and (Cylindricity is VL).

Trimf MF’s for Input and output variables
Mamdani Fuzzy logic was used to simulate the experimental results as shown in Fig. 10. The obtained results are explained herewith:

Influence on output responses in relation to change of input variables (fuzzy model)
5.2 Accuracy of fuzzy model’s
To measure the Fuzzy model accuracy, as shown in Fig. 11, the predicted values were calculated by using the fuzzy model and keeping the same set of input values. Error and Accuracy of the model are measured by the following relations:
where \( \varvec{e}_{{\varvec{i }}} \) = individual error, \( \varvec{H}_{\varvec{m}} \) = measured value and \( \varvec{H}_{\varvec{p}} \) = predicted value.

Comparison of fuzzy logic model with experimental results
Accuracy is the closeness of predicted value to the measured value. The accuracy and error for Fuzzy model are shown in Table 16. The mathematical relation used to calculate the accuracy is given below:
where A = accuracy of the model and N = number of experiments.
6 Results and conclusion
The EDM process parameter for Ni-based superalloy (Inconel-718) has been optimized by Taguchi analysis and multi-objective optimization method GRA to obtain an optimal solution. The optimized parameters for the response of MRR, EWR and form tolerance are: Ø 0.16 mm DIA. of the multi-hole electrode, 8 Amps Ip, 600 µs Ton and 0.1 kg/m2 dielectric fluid pressure. The optimal solutions have been calculated from output responses. An attempt has also been made to attain the Max. and Min. Evaluation of MRR and form tolerances respectively. The attained outcomes had also been examined through a real experiment and established to be satisfactory. The experimental results showed considerable advancement in the process. From Taguchi analysis, the obtained results are: For MRR, Ip and dielectric fluid pressure are the most significant constraints, whereas the Toff has the least significance. The MRR improves with an increase in spark discharge area which is higher for the multihole electrode. For EWR, DIA. of a hole in the multihole electrode is the most influencing parameters, whereas the Ton has the least significance. Ton and Ip are the most influencing constraint for circularity, whereas the DIA. of the multi-hole electrode has less significance. For cylindricity form tolerance, Dielectric fluid pressure is the most influencing parameter, whereas the Ton has less significance.
The utilization of a multi-hole electrode improves the MRR as well as the form tolerances and minimizes the EWR. The Fuzzy model has been developed to measure the output results. The accuracy and percentage of the model is 96.45% respectively. This model may be used to predict the accurate output responses (MRR, EWR and form tolerance) of Ni-based superalloy. The attained optimal outcomes had been tested by conducting a real experiment trial and found to be acceptable. Therefore, these experimental results will facilitate the aerospace and defence industries to improve the productivity, performance and MRR of Inconel-718 superalloy with closer tolerances.
References
Corrado A, Polini W (2016) Manufacturing signature in variational and vector-loop models for the tolerance analysis of rigid parts. Int J Adv Manuf Technol 88(5–8):2153–2161. https://doi.org/10.1007/s00170-016-8947-z
Corrado A, Polini W (2017) Manufacturing signature in jacobian and torsor models for tolerance analysis of rigid parts. Robot Comput Integr Manuf 46:15–24
Wan N, Liu P, C Zhiyong, Chen Zezhong C (2018) The machining surface localization of free-form blade considering form tolerance. Int J Adv Manuf Technol 95:4469–4483. https://doi.org/10.1007/s00170-017-1495-3
Wilma P, Glovannl M (2015) Manufacturing signature for tolerance analysis. J Comput Inf Sci Eng ASME 15:1–5
Polini W, Corrado A (2016) Geometric tolerance analysis through Jacobian model for rigid assemblies with translational deviations. Assem Autom 36(1):72–79
Tzeng YF, Chen FC (2007) Multi-objective optimisation of high-speed electrical discharge machining process using a Taguchi fuzzy-based approach. Mater Des 28:1159–1168
Puertas I, Luis CJ (2003) A study on the machining parameters optimization of electrical discharge machining. J Mater Process Technol 143–144:521–526
Adamczak S, Janecki D, Stępien K (2006) The comparison of cylindricity profiles using normalized cross-correlation function. Meas Sci Rev 6(1):18–21
Bharti PS, Maheshwari S, Sharma C (2010) Experimental investigation of Inconel 718 during die-sinking electric discharge machining. Int J Eng Sci Technol 2(11):6464–6473
Vogtel P, Klocke F and Lung D (2014) High performance machining of profiled slots in nickel-based-superalloys In: 6th CIRP International conference on high performance cutting, HPC2014, Procedia CIRP 14: 54–59
Rahman M, Seah WKH, Teo TY (1997) The machinability of Inconel 718. J Mater Process Technol 63:199–204
Azad MS, Puri AB (2012) Simultaneous optimization of multiple performance characteristics in micro-EDM drilling of titanium alloy. Int J Adv Manuf Technol 61:1231–1239
Manikandan R, Venkatesan R (2012) Optimizing the machining Parameters of Micro-EDM for Inconel 718. J Appl Sci 12:917–977
Jemielniak K (2009) Rough turning of Inconel 718. Adv Manuf Sci Technol 33(3):5–15
Li L, Lin G, Xi X, Zhao W (2012) Influence of flushing on performance of EDM with bunched electrode. Int J Adv Manuf Technol 58:187–194
Kuppan P, Rajadurai A, Narayanan S (2007) Influence of EDM process parameters in deep hole drilling of Inconel 718. Int J Adv Manuf Technol 38(1–2):74–84. https://doi.org/10.1007/s00170-007-1084-y
Selvarajan L, Sathiya Narayanan C, Jeyapaul R (2014) Optimization of process parameters to improve form and orientation tolerances in EDM of MoSi2-SiC composites. Mater Manuf Process 30(8):954–960. https://doi.org/10.1080/10426914.2014.962041
Homri L, Goka E, Levasseur G, Dantan JY (2017) Tolerance analysis—form defects modeling and simulation by modal decomposition and optimization. Comput Aided Des 91:46–59
Yan Y, Bohn M (2018) Complementing and enhancing definitions of line profile composite tolerance imposed by ISO geometrical product specification. J Mach Eng 18(2):74–84
Zhang Z, Liu J, Ding X, Shao N (2018) Tolerance analysis of annular surfaces considering from errors and local surface deformations. Procedia CIRP 75:291–296
Cilak O (2012) Investigation on machining performance of Inconel 718 under high pressure cooling conditions. J Mech Eng 58:683–690
Kao JY, Tsao CC, Wang SS, Hsu CY (2010) Optimization of the EDM parameters on machining Ti-6Al-4 V with multiple quality characteristics. Int J Adv Manuf Technol 47:395–402
Su JC, Kao JY, Tarng YS (2004) Optimization of the electrical discharge machining process using a GA- based neural network. Int J Adv Manuf Technol 24(1–2):81–90. https://doi.org/10.1007/s00170-003-1729-4
Sarikaya M, Yilmaz V (2018) Optimization and predictive modeling using S/N, RSM, RA and ANNs for micro-electrical discharge drilling of AISI 304 stainless steel. Neural Comput Appl 30(5):1503–1517. https://doi.org/10.1007/s00521-016-2775-9
Yilmaz V, Sarikaya M, Dilipak H (2015) Deep micro-hole drilling for Hadfield steel by electro-discharge machining (EDM). Mater Tehnol 49(3):377–386
Sarikaya M, Gullu A (2015) Multi-response optimization of minimum quantity lubrication parameters using Taguchi-based Grey relational analysis in turning of difficult-to-cut alloy Haynes 25. J Clean Prod 91:347–357
Meral G, Sarikaya M, Mia M, Dilipak H, Seker U, Gupta MK (2018) Multi-objective optimization of surface roughness, thrust force, and torque produced by novel drill geometries using Taguchi-based GRA. Int J Adv Manuf Technol. https://doi.org/10.1007/s00170-018-3061-z
El-Taweel TA (2009) Multi-response optimization of EDM with Al-Cu-Si-TiC P/M composite electrode. Int J Adv Manuf Technol 44:100–113. https://doi.org/10.1007/s00170-008-1825-6
Khan AA (2008) Electrode wear and material removal rate during EDM of aluminum and mild steel using copper and brass electrodes. Int J Adv Manuf Technol 44:100–113. https://doi.org/10.1007/s00170-008-1825-6
Ferreira JC (2007) A study of die helical thread cavity surface finish made by Cu-W electrodes with planetary EDM. Int J Adv Manuf Technol 34:1120–1132. https://doi.org/10.1007/s00170-006-0687-z
Li L, Lin G, Xi X, Zhao W (2012) Influence of flushing on performance of EDM with bunched electrode. Int J Adv Manuf Technol 58:187–194. https://doi.org/10.1007/s00170-011-3357-8
Bozdana AT, Ulutas T (2015) The effectiveness of Multi-channel electrodes on drilling blind holes on Inconel 718 by EDM process. Mater Manuf Process 1:1. https://doi.org/10.1080/10426914.2015.1059451
Zhao WS, Gu L, Li L, Xia YG, Li L (2007) Bunched-electrode for electrical discharge machining. In: Proceedings of the 15th international symposium on electromachining (ISEM 15), Pittsburgh, America, pp: 41–44
Li L, Gu L, Zhao WS (2009) Research on machining characters of bunched-electrode electrical discharge machining. J Shanghai Jiao Tong Univ 43(1):30–32
Kim CH (2012) Improvement of the ED-drilling machinability using multihole electrodes. J Korean Soc Manuf Process Eng 11(5):88–93
Murugesan S, Balamuruga K (2012) Optimization by Grey relational analysis of EDM parameters in machining AlC MMC using multihole electrode. J Appl Sci 12(10):963–970
Govindan P, Joshi SS (2011) Investigation into performance of dry EDM using slotted electrodes. Int J Precis Eng Manuf 12(6):957–963
Singh NK, Pandey PM, Singh KK (2016) EDM with air assisted multi-hole tool. Mater Manuf Process 31:1872–1878
Rajesha S, Sharma AK, Kumar P (2012) On electro discharge machining of inconel 718 with hollow tool. J Mater Eng Perform 21(6):882–891
Kumar S, Subramani P (2018) Hybrid optimization of WEDM parameters to predict the influence on surface roughness and cutting speed for Ni-based Inconel 600 wrought superally. Int J Mech Prod Eng Res Dev 8(2):865–872
Yusoff Y, Ngadiman MS, Zain AM (2011) Overview of NSGA-II for optimizing machining process parameters. Procedia Eng 15:3978–3983
Author information
Authors and Affiliations
Corresponding author
Ethics declarations
Conflict of interest
The authors declare that the have no Conflict of interest.
Additional information
Publisher's Note
Springer Nature remains neutral with regard to jurisdictional claims in published maps and institutional affiliations.
Rights and permissions
About this article

Cite this article
Kumar, S., Dhanabalan, S. Influence on machinability and form tolerance of Inconel 718 in Edm using different diameter multi hole Cu electrodes. SN Appl. Sci. 1, 396 (2019). https://doi.org/10.1007/s42452-019-0403-x
Received:
Accepted:
Published:
DOI: https://doi.org/10.1007/s42452-019-0403-x