
Abstract
There has been no dearth of promises, slogans, new programmes and schemes ever since Mr. Narendra Modi commenced his first innings in 2014 as India’s Prime Minister.
You have full access to this open access chapter, Download chapter PDF
1 Background
There has been no dearth of promises, slogans, new programmes and schemes ever since Mr. Narendra Modi commenced his first innings in 2014 as India’s Prime Minister. Starting from his 2014 election manifesto, Mr. Modi has made promises to revolutionise Indian farming. The list of these promises broadened and expanded in the subsequent five years. Some of the most prominent and striking promises are listed below:
-
1.
In the election manifesto of 2014,Footnote 1 the following promises appeared prominently:
-
a.
Radically transform the Food Corporation of India (FCI) by unbundling its operations into procurement, storage and distribution for greater efficiency.
-
b.
Leverage technology to disseminate real-time data, especially to farmers—on production, prices, imports, stocks and overall availability.
-
c.
Evolve a single “National Agriculture Market”.
-
d.
Promote and support area-specific crops and vegetables linked to the food habits of people.
-
e.
Setting up a price stabilisation fund.
-
f.
Take steps to enhance the profitability of agriculture. These include (i) ensuring product prices that give at least 50% profits over the cost of production, (ii) delivering cheaper agricultural inputs and credit, (iii) introducing the latest farming technologies and high yielding seeds and (iv) linking MGNREGA to agriculture.
-
g.
Introduce soil assessment-based crop planning and setting up mobile soil testing labs.
-
h.
Implement a farm insurance scheme to take care of crop loss due to unforeseen natural calamities.
-
a.
-
2.
Other prominent promises or launch of schemes during the five years between 2014–15 and 2018–19 were as follows:
In its election manifesto, BJP had stated that “In 2022, we will be celebrating 75 years of India’s Independence. In Indian culture, this is celebrated as Amrit Mahotsav. For us, every day and every step, every journey and every process will be dedicated to make Amritmay Bharat. And all this will be done by all of us, for all of us!” Propelled by this spirit and wanting to make 2022 a big year, PM Modi, once in office, made big commitments centred round it: for one, he promised to double farmers’ real incomes by 2022–23. He even committed to halving urea consumption by 2022–23; although that dream has long been lost, the dream of doubling incomes continues to be mentioned and is the focus in ongoing government discussions and deliberations.
To achieve the big dreams, PM Modi started some important initiatives, including the following.
-
1.
In March 2016, to simplify the leasing of farmland, under PM Modi’s direction, NITI Aayog prepared the Model Land Leasing Act to facilitate states to enact their leasing laws to improve, inter alia, long-term credit flow to tenant operated agricultural lands. This will incentivise tenant farmers to increase investments on land and increase productivity.
-
2.
In April 2016, comprehensive crop insurance under the Pradhan Mantri Fasal Bima Yojana (PMFBY) was launched.
-
3.
A progressive and facilitative model Agricultural Produce and Livestock Marketing (Promotion and Facilitation) Act, 2017 (APLM Act 2017) was also introduced in April 2017, which, inter alia, provided for (i) notifying a whole state as one unified market; (ii) allowing the setting up of private markets, farmer-consumer markets and direct marketing; (iii) declaring warehouses/cold storages as market yards; (iv) rationalising market fee and commission charges; and (v) providing a single point levy of market fee and a unified single trading licence for e-trading. The government has approved a scheme for Gramin Haats to work as centres of aggregation and for direct purchase of agricultural commodities from farmers.
-
4.
In August 2017, the “per drop, more crop” initiative was launched to encourage micro-irrigation for optimal utilisation of water.
-
5.
In March 2018, the Paramparagat Krishi Vikas Yojana (PKVY) was launched to promote organic farming.
-
6.
The Pradhan Mantri Annadata Aay Sanrakshan Abhiyan (PM-AASHA) was launched in September 2018 to ensure remunerative prices to farmers for their produce.
-
7.
To provide an impetus to agricultural exports, in December 2018, the government released its comprehensive “Agriculture Export Policy” aimed at doubling agricultural exports and integrating Indian farmers and agricultural products with global value chains.
-
8.
To provide assured income support to the small and marginal farmers, the government launched the Pradhan Mantri Kisan Samman Nidhi (PM-KISAN) in February 2019, just before the Parliamentary elections in April–May.
In this chapter, we look at some of the biggest schemes/announcements and evaluate them for their effectiveness in alleviating farmer problems.
The chapter is organised as follows: Section 11.2 outlines the performance of Indian agriculture during Prime Minister Modi’s first five-year term. Section 11.3 outlines and provides a brief evaluation of the biggest schemes while Sect. 11.4 presents the conclusions from the analysis.
2 Performance of Indian agriculture in the five years
Agricultural gross domestic product (AGDP) grew at an average rate of 2.9% in the five years since Narendra Modi took over. Incidentally, AGDP grew at the same rate even during 1998–99 to 2003–04, i.e. when PM Modi’s political party, i.e. the Bharatiya Janata Party (BJP) (then as NDA), was last in power. In the last three decades (since 1990–91), India’s AGDP grew the fastest between 2009–10 and 2013–14—at an average annual rate of 4.3 % (Fig. 11.1).

Source MOSPI, GOI. Note CV stands for coefficient of variation
AGDP trends in last three decades: growth rate and volatility.
In terms of volatility (measured as coefficient of variation) in growth, the most volatile growth in AGDP was observed in the five years between 1998–99 and 2003–04 and the most stable growth in the five years between 2009–10 and 2013–14 (Fig. 11.1). It may not be incorrect to deduce that the country’s AGDP grew the fastest and in the most stable manner during the UPA2 period.
The volatility in the performance of the Indian agricultural sector is closely linked to the rains the country receives during its four monsoon months, i.e., June, July, August and September. With 49 % of the 198 million hectares of the country’s gross cropped area (2014–15) under assured irrigation (Ministry of Agriculture, GOI) and the remainder, i.e. more than half, depending on rains for meeting its irrigation needs, monsoon rains become important for a country that is still agrarian, poor and food insecure at the micro-level (Fig. 11.2).

Source IMD and MOSPI. Note(i) A drought is defined as a situation when actual rainfall received in the monsoon months falls below the normal level by 10% or more and (ii) LPA stands for long period average
Trends in agricultural GDP and performance of monsoon rainfall (per cent deviation from LPA).
In the last 18 years (2000–01 to 2018–19), India faced droughts in five years (2002, 2004, 2009, 2014 and 2015) and in all of those, India’s agricultural GDP growth rate and food grain production fell. The sharpest fall in food grain production was in the year 2002–03 when the rainfall inadequacy was 19.2% and the annual food grain production fell by more than 38 MMTs (Source: Ministry of Agriculture and IMD). In 2009–10, which was the worst drought year in recent years, the fall in food grain production was lower compared to 2002–03 at 16.4 MMTs even though the rainfall inadequacy was higher at 21.8% (Source: Ministry of Agriculture and IMD).
Last five years
Incidentally, since PM Modi took over the reins of the country, the agricultural sector suffered at the hands of climate. In all five years, the monsoon rains were below normal and there were droughts in two, i.e. 2014 and 2015 (Fig. 11.3).

Source MOSPI and IMD
Agriculture GDP growth (%) and rainfall deviations from long period average (LPA) (%) since 2014–15.
A look at 118 years of rainfall history highlights two peculiarities about the last five years.
-
1.
Consecutive drought years are a rare event—Since 1901, India has faced consecutive droughts four times in 1904 and 1905, 1965 and 1966, 1986, and 1987, and 2014 and 2015.
-
2.
Negative deviation of actual rains from its LPA for five consecutive years—This has never happened in Indian rainfall history since 1901.
Apart from rains, the major challenges faced by Indian agriculture during the Modi 1.0 period included the following.
-
1.
Cyclicality and volatility in domestic prices: During the last five years, while PM Modi started his tenure amidst rising prices and angry consumers, it ended with crashing prices and farm distress.
-
2.
Crash in global prices: An unprecedented fall in global prices to the extent that it affected the competitiveness of India’s agricultural produce resulted in a crash in agricultural exports.
-
3.
There was rapid rise in food grain production in the domestic market.
-
4.
Implementation gaps in policy reforms such as the introduction of e-NAM and FPOs had an adverse impact on farm profitability.
-
5.
There was also the snowballing burden of unfulfilled political promises.
-
6.
And there was demonetisation that resulted in loss of market liquidity and sentiment.
3 Analysing Selected Schemes
In this section, selected GoI schemes are analysed and presented. These schemes are clustered under four broad heads (Fig. 11.4):

Broader heads of schemes analysed
We start with an analysis of India’s grain mangement system which caters to the country’s largest food-based welfare program ie. the Public Disribtion System (PDS) or the National Food Secuirty act (NFS) 2013. When PM Modi took over in May 2014, one of the first expert committees he set up was on reforming the grain management system, in particular the Food Corporation of India (FCI), and reorienting its historical role. With this announcement, he raised expectations because the inefficiencies of the FCI were palpable, pervasive and perhaps presumed incorrigible.
By announcing the setting up of an expert panel to review the role of the FCI, the ecosystem geared up for aggressive reforms in the agriculture and food space. However, not much happened on ground on that account. In fact, there were some trends, explained below, that indicate a worsening of the situation on account of food subsidy.
3.1 Analysing India’s Grain Management System
India has a grain management system characterised by high levels of government intervention. The government procures large quantities of wheat and rice at minimum support prices (MSPs), stores these and then distributes it under the public distribution system (PDS) to a large number of identified beneficiaries at highly subsidised prices through almost 500,000 fair price shops (FPS) spread throughout the country. In terms of the number of beneficiaries, India’s PDS is the largest in the world. In 2013, the PDS was replaced with a blanket scheme under the National Food Security Act, 2013 (NFSA 2013), which, inter alia, expanded the coverage under PDS, increased the extent of grain subsidisation, legalised the right to food and opened up scope for the substitution of grain entitlement with cash. For running the system smoothly, the Food Corporation of India (FCI), which is the nodal agency for implementing the NFSA, annually procures and distributes about 61.4 MMTs of grains to about 813 million people, i.e. about 67% of India’s total population.
The GOI makes an annual budgetary allocation for running the PDS under the head “food security”. The allocation is made to the Ministry of Consumer Affairs, Food and Public Distribution. Data on food subsidy is presented in Fig. 11.5.

Source Union Budget documents
India’s food subsidy (INR lakh crore).
In the 17 years since 2001–02, food subsidy expenditure increased 10 times. Barring three years (2005–06, and 2016–17 and 2017–18), food subsidy expenditure has consistently increased every year.
In 2005–06, the fall in subsidy was minor. However, the drop observed in 2016–17 and 2017–18 is significant—from highs of Rs. 1.39 lakh crore in 2015–16 to Rs. 1.1 lakh crore in 2016–17 and further down to Rs. 1 lakh crore in 2017–18 (Fig. 11.5).
We analyse this fall in expenditure in this section.
Every year, food subsidy is calculated as excess of expenditure (captured as economic cost incurred by GOI for running PDS) over revenue (the grains are sold at highly subsidised prices called the central issue price (CIP) to beneficiaries).Footnote 2 Between 2015–16 and 2017–18, while the economic cost of wheat and rice rose from Rs. 21.3 and Rs. 31.3 per kg, respectively, to Rs. 23 and Rs. 32.8 per kg, respectively, price realisation stagnated at Rs. 2 and Rs. 3 per kg, respectively (the CIP has been fixed at these levels since 2013). Besides, in the two years, both grain offtake (from FCI godowns for distribution under PDS) and grain procurement (for distribution under PDS) went up (Fig. 11.6). Interestingly, the number of beneficiaries remained the same as before.

Source FCI. *Provisional. Food grain is rice & wheat. The figure is adapted from Financial Express article by Das (2019). Accessed on May 24, 2019. Link: https://epaper.financialexpress.com/c/39661440
Offtake of food grains by states and procurement (MMTs).
If both the components of food subsidy, i.e. excess of cost over price and the amount of grain handled under the system increased, how did the expenditure on food subsidy as reported in the budget fall?
We can begin answering that by first acknowledging that the downward trend in food subsidy expenditure did not continue as the expenditure rose to Rs. 1.71 lakh crore in 2018–19 and is now budgeted at Rs. 1.84 lakh crore for 2019–20.
Within a year, food subsidy expenditure grew by 71% in 2018–19 (Fig. 11.7). This is an unprecedented rate of annual growth rate.

Source Based on data from Union Budget documents
Annual increase in food subsidy since 2001 (%).
What then explains the drop in the food subsidy bill in 2016–17 and 2017–18?
An analysis of FCI’s accounts reveals that the answer lies in FCI’s pending bills (orange bars in the Fig. 11.8). These are the bills which are unpaid or unsettled by the GOI in that year and the balance is taken forward to the next year. FCI had unpaid bills of Rs. 0.5 lakh crore in 2015–16, Rs. 0.8 lakh crore in 2016–17 and Rs. 1.36 lakh crore in 2017–18 (even rising above the year’s budgeted annual subsidy).

Source Union budget documents and FCI *unaudited. Data on outstanding dues is adapted from Financial Express article by Das (2019). Accessed on May 24, 2019. Link: https://epaper.financialexpress.com/c/39661440
Accounts of FCI: subsidy received and outstanding (INR lakh crore).
For running operations smoothly, FCI has had to borrow money from other sources.
On 1 April 2019, the outstanding bills of FCI stood at Rs. 1.86 lakh crore while the budgeted subsidy was Rs. 1.84 lakh crore.
Clearly, the union budget does not reveal the full extent of food subsidy. In 2018–19, the amount of food subsidy should be the sum of the budgeted amount and the FCI’s outstanding amount as on 31 March 2019, i.e. the sum of Rs. 1.71 lakh crore and Rs. 1.86 lakh crore, which amounts to Rs. 3.6 lakh crore!
Burden of excess stocks
In addition to the burden of unpaid bills, the FCI is also saddled with excess stocks. As on 1 July 2019, the FCI had a total food grain stock of 75.25 MMTs, of which 28.4 MMTs was rice and about 45.83 MMTs was wheat. In addition to this, the FCI was to receive about 10.5 MMTs of rice from the millers. As per the buffer stocking norms, FCI is to only hold about 41.12 MMTs of grains on July 1, comprising about 13.5 MMTs of rice and 27.6 MMTs of wheat. This means that FCI is holding more than 34 MMTs of extra grain with an additional 10 MMTs of paddy still with the millers.
Inefficiencies of the FCI and the Shanta Kumar panel Committee Report
From expensive food grain management systems to the wastage of grain due to insufficient storage, logistical mismanagement and leakages and pilferages of grain in the value chain, the inefficiencies of FCI have existed for long and continue to mar the system. Among the first expert panels created by PM Modi was a high-level Committee under the Chairmanship of Mr. Shanta Kumar, former Union Minister for Food in the Vajpayee government, with a mandate to define the roadmap for “reorienting the role and restructuring of FCI”. The Committee submitted its report in January 2015. Its major recommendations included (i) gradually replacing the existing grain transfers by moving towards direct cash transfers, (ii) scaling down FCI’s procurement operations, especially in states like Andhra Pradesh, Haryana, Madhya Pradesh and Punjab, while increasing procurement price support to the hitherto neglected states/regions of Eastern Uttar Pradesh, Bihar, West Bengal, etc., (iii) reducing coverage of people under NFSA to 40% of the population instead of 67% as provided for under the NFSA, and increasing the grain entitlement of the really vulnerable beneficiaries, (iv) outsourcing stocking operations to state agencies and the private sector (v) and encouraging competition in every step of the food grain supply chain, with a focus on upgrading the chain with bulk handling and computerisation and reducing reliance on manual operations, which is one of the major reasons for large-scale corruption.
Despite this roadmap, the government has undertaken only piece-meal reform of the grain management system. These reforms include the introduction of direct benefit transfer (DBT), where cash replaces grain entitlements in the UTs of Chandigarh, Puducherry and D&N Haveli and introducing point-of-sale (POS) devices at ration shops among others. No major Indian state is even considering shifting to DBT, though they have undertaken most operational and delivery reforms.
The slow pace of reform of the grain management system has saddled the government with greater stocks and deepened the system’s fiscal and operational inefficiencies.
3.2 Pricing and Other Agricultural Marketing Reforms
As of 31 March 2018, there are 6676 (DCR Vol. 4, p. 64) regulated wholesale markets in the country. These markets, however, are not sufficient to meet dynamically changing marketing requirements and meeting the aspirations of farmers for better and competitive price realisation.
The policy drive by the GOI in agricultural marketing is well represented through its various schemes, initiatives and policies such as the following:
-
1.
Launch of the Model Act “The––State/Union Territory Agricultural Produce and Livestock Marketing (Promotion & Facilitation) Act, 2017” (APLM 2017)
-
2.
Development of Rural Haats into GraminAgricultural Markets (GRAMs) 2018–19
-
3.
National Agriculture Market (NAM) and its electronic platform, i.e. e-NAM launched in 2016
-
4.
PM-AASHA in September 2018
-
5.
Agricultural Export Policy 2018
-
6.
Contract Farming and Adoption of Model Contract Farming Act, 2018: The State/UT Agricultural Produce & Livestock Contract Farming and Services (Promotion & Facilitation) Act, 2018
-
7.
Removal of Licensing Requirements, Stock Limits and Movement Restrictions on Specified Foodstuffs Order, 2016
-
8.
Raising MSPs to above 50% of costs of production in 2018–19
APLM 2017 Versus APMC 2003
To create efficient, inclusive and broader markets, the Government of India formulated and circulated a model APMC Act in 2003 to be adopted by states/UTs on the recommendation of the Inter-Ministerial Task Force on Agricultural Marketing Reforms (TFAMR 2002). The aim was to give farmers the option to sell their produce directly to agricultural businesses, like processors or bulk buyers, at a lower transaction cost and in the quality/form required by buyers. The Model Act also allowed for contract farming and direct marketing by private trade.
Over the last 15 years since the circulation of the Model APMC Act 2003, most states made only partial and minimal reforms; thus, there was no noticeable progress, except in a few states like Maharashtra, Gujarat, Karnataka and Rajasthan. Sikkim has an APMC Act, but it never implemented it. Bihar implemented the APMC only to later withdraw it in 2006. States and UTs like Kerala, Manipur, Andaman and Nicobar Islands, Lakshadweep Islands, Dadar and Nagar Haveli and Daman Diu implemented the model APMC.
Farmers all over the country suffer from inefficient, non-transparent and monopolistic agricultural markets. To improve the situation, in April 2017, the government through the Ministry of Agriculture & Farmers Welfare formulated the model APLM Act, 2017, and circulated it to states/UTs for adoption to reform the marketing of agriculture and livestock products.
The Model APLM Act, 2017 proposes, inter alia, the following changes in APMC Act of the states,
-
1.
Notifying the whole state as one unified market
-
2.
Allowing the setting up of private markets, farmer-consumer markets and direct marketing
-
3.
Declaring warehouses/cold storages as market yards
-
4.
Rationalising market fees and commission charges
-
5.
Clear provision for e-trading, a single-point levy of market fees and unified single trading licence.
As of May 2019, states are at various stages of adopting the model act, barring Arunachal Pradesh that has completely adopted the 2017 Act as APAPLM (Arunachal Pradesh Agriculture Produce and Livestock Marketing Act) (Source: Agricoop, MOA, GOI).
To give a further thrust to agricultural marketing, in the Union Budget 2018–19, the government declared its intention to develop and upgrade rural haats/shandies into GRAMs, discussed next.
Development of Rural Haats into Gramin Agricultural Markets (GRAMs)
Located in rural and interiors areas, rural haats act as markets for a great majority of Indian farmers, particularly small and marginal farmers. There are 22, 941 haats in India and as per Union Budget 2018–19, 22,000 of these will be upgraded into GRAMs. Upgrading would involve, inter alia, the following:
-
1.
Strengthening physical infrastructure using government schemes such as Mahatma Gandhi National Rural Employment Guarantee Act (MGNREGA);
-
2.
Ensure that the GRAMs are exempted from APMC regulations and linked to e-NAM to provide farmers the facility to make direct sales to retail and bulk consumers.
To strengthen marketing infrastructure, the GOI, with NABARD, created an Agricultural Market Infrastructure Fund (AMIF) with corpus of Rs. 2000 crore to upgrade 10,000 GRAMs and 585 APMCs. As for March 2019, the AMIF fund is still to play out and most states have not even identified potential rural haats to be developed into GRAMs (Source: Agricoop).
The provisions under the APLM and the creation of GRAMs, among other things, were to provide a base for the creation of a unified national market, also referred to as the National Agriculture Market (NAM), discussed below.
Electronic National Agriculture Market (e-NAM)
The government approved the setting up of the National Agriculture Market (NAM) through the Agri-Tech Infrastructure Fund (ATIF) on 1 July 2015, with a budget of Rs. 200 crore. The project was to be implemented in the period 2015–18. PM Modi launched e-NAM on 14 April 2016, in eight states—Gujarat, Telangana, Rajasthan, Madhya Pradesh, Uttar Pradesh, Haryana, Himachal Pradesh and Jharkhand, covering 21 markets. The aim was to achieve higher transparency in the farming sector, increase farmers’ income and provide them access to a larger number of buyers from within and outside the state.
As a concept, e-NAM did not imply a marketplace separate from and parallel to the existing APMCs. It is an electronic trading platform that is offered as a plug-in to any market yard (APMC or private). It aims to leverage the existing physical infrastructure of the mandis, connect them to the online trading platform, offering sellers a larger number of buyers sitting in the local area.
There are three prerequisites for any state wanting to on-board e-NAM:
-
1.
They have to ensure a single unified trading licence applicable across the state.
-
2.
There has to be a single point levy or market fee across the state.
-
3.
They have to provide for e-auction as a mode of price discovery.
Only those states/UTs that have provided for these three prerequisites will be eligible for inclusion in the scheme. On the basis of their priorities, states will specify the APMC markets that they wish integrated with e-NAM, which will then be considered by the Government of India for integration.
So far, 585 APMC markets in 16 states and 2 union territories have been integrated into the e-NAM platform (Source: e-NAM portal). A target to integrate an additional 415 markets by March 2020 has also been declared.
More than 50% of the 585 mandis are in four states: UP, Gujarat, Maharashtra and MP. Himachal and Uttarakhand are front runners, adding e-NAM to 34 and 28% of their existing regulated markets. Only 6.7% of the mandis in Maharashtra, 5.5% in Rajasthan and 2% in Odisha have been integrated with e-NAM (Fig. 11.9).

Source Portal of e-NAM and Dalwai Committee Report
Mandis under e-NAM: share of states and Mandis.
These 585 mandis have benefitted about 1.66 crore farmers, i.e. about 11% of all Indian farmers. About 18.7 MMTs have been traded on e-NAM till date.
In January 2019, e-NAM undertook a major initiative by encouraging states to begin inter-state trade. Earlier, trade used to happen either within the APMC or between two APMCs situated within the same state. As of 7 February 2019, 21 e-NAM mandis of eight states, namely Uttar Pradesh, Uttarakhand, Andhra Pradesh, Telangana, Rajasthan, Gujarat, Maharashtra and Madhya Pradesh, have joined hands to start inter-state trade on e-NAM.
The three main problems faced by the portal are the following.
-
1.
The data reflected on the e-NAM portal is artificially inflated by adding the value of MSP-procurement operations by states like Haryana. Including such transactions made at fixed prices (MSP) by a fixed buyer (procurement agency) onto the e-NAM platform violates the true spirit of e-NAM, i.e. of free and competitive marketing.
-
2.
Additionally, according to the Department of Agriculture Co-operation and Farmers’ Welfare, most reported transactions are intra-mandi transaction. Inter-mandi and inter-state trading on the platform are minimal. What this means is that the states on e-NAM have not been able to provide farmers with better price discovery in other mandis of the same state or across states.
-
3.
The department also acknowledges that e-payment facilities are not available in most mandis and that there is no competitive bidding reported in these states. This clearly implies that the monopoly of the APMCs continues unabated in the 18 states/UTs, and the aim of creating a truly unified NAM with an efficient price discovery mechanism is still a far-fetched dream.
Pradhan Mantri Annadata Aay Sanrakshan Abhiyan (PM-AASHA)
The first year of Prime Minister Modi’s tenure, 2014, was a drought year that was followed by another, more severe, drought in 2015. The production of food grain in the two years fell by 13.03 and 0.5 MMTs and that of pulses fell by 2.1 MMTs and about 0.8 MMTs, respectively. Food inflation rose with lower grain supplies. The highest inflation was observed in the case of pulses (see Fig. 11.10). Inflation measured through the wholesale price index (WPI) of pulses averaged about 35% in 2015. The consumer price of pulses too increased by about 33% in the first half of 2016.

Source Ministry of Agriculture and MOSPI, GOI
Indian pulses: production, availability and inflation.
To contain and reverse inflation, particularly in the case of pulses, the government undertook measures to increase its production and availability to consumers. These included aggressive increases in the MSP of pulses and the creation of a pulse buffer stock under the Price Stabilisation Fund (PSF) in 2016. These measures were complemented by better rains in subsequent years. Consequently, production increased and with continued high imports of pulses, domestic availability improved, moderating the domestic prices of pulses. But by 2017–18, pulse prices fell sharply. The situation was similar in the case of oilseeds. To contain farmer distress, the government launched PM-AASHA.
In summary, when PM Modi started office in 2014, he fought rising prices of pulses and an angry and vociferous consumer lobby, to counter which he created the PSF but when farm prices for most crops began to fall, particularly after 2017–18, faced with farmer agitations, PM Modi started PM-AASHA.
The objective of the Pradhan Mantri Annadata Aay Sanrakshan Abhiyan (PM-AASHA) is to ensure remunerative prices to farmers for their produce. The details of the three sub-schemes are:
-
a.
Under the Price Support Scheme (PSS), central nodal agencies, actively aided by state governments, are required to procure pulses, oilseeds and copra. In addition to NAFED, the Food Cooperation of India (FCI) has also been asked to take up PSS operations in states/districts. The procurement expenditure and losses due to procurement are to be borne by the central government as per norms.
-
b.
Under the Price Deficiency Payment Scheme (PDPS), it was proposed to cover all oilseeds for which MSP is notified. Direct payment of the difference between the MSP and the selling/modal price was to be made to pre-registered farmers selling his produce in the notified market yard through a transparent auction process. All payments were to be made directly into the farmer’s registered bank account. This scheme did not involve any physical procurement of crops as farmers were to be paid the difference between the MSP price and sale/modal price on disposal in notified markets. The central government support for PDPS was to be given according to laid down norms.
-
c.
The government had also decided that the participation of the private sector in procurement operations needed to be piloted and, based on past experience the ambit of private participation in procurement operations be increased. Therefore, in addition to PDPS, it was decided that for oilseeds, states will have the option to roll out the Private Procurement Stockist Scheme (PPSS) on a pilot basis in selected districts/APMC(s).
These operations will be undertaken on the request of the state governments/union territories. PSS will be implemented to procure pulses, oilseeds and copra of fair average quality (FAQ) at the minimum support price (MSP), whereas the PDPS will be implemented in the case of oilseeds. However, states/UTs have the options to choose either the PSS or PDPS in a given procurement season with respect to a particular oilseed crop for the entire state. Besides, PPSS will also be implemented for oilseeds on a pilot basis and states have the option of implementing the scheme through private stockists in a district/selected APMC(s) of a district.
In the first year of its roll-out, no state had started with the PPSS, and one state proposed to implement a pilot under the PDPS scheme. The PSS is already being criticised for its inadequate operations with market prices ruling below prevailing MSPs for several crops. The PSS is discussed in greater detail below.
The major kharif crop in India is paddy. In addition to paddy, we studied price trends for maize and soybean in the 2018–19 kharif season to see if mandi (wholesale or WH market) sales were happening at above, below or at the prevailing MSP (Figs. 11.11, 11.12, 11.13 and 11.14).

Paddy: price and arrival pattern in Kharif 2018–19

Soybean: price and arrival pattern in Kharif 2018–19

Tur (arhar): price and arrival pattern in Kharif 2018–19

Source Agmarknet
Maize: price and arrival pattern in Kharif 2018–19.
In all major producing states, the prices for all the four crops were below the MSP at least during the peak arrival season.
Loss Incurred by farmers because of failure of PM-Aasha
By multiplying the monthly arrivals (shown above) with the difference between the wholesale price and the MSP, we estimated the loss (in case the WH price was below MSP) or gain (in case the WH price was above MSP) that was incurred by farmers because they sold at prices lower than the MSP. The results are presented Fig. 11.15.

Source Estimated by authors based on data from Agmarknet
Crop-wise losses incurred in Kharif 2018–19.
For kharif 2018–19, farmers in the largest producing states suffered losses as farmers sold at prices below MSP. The largest loss was suffered by UP paddy farmers, who lost the Rs. 837 crore that they would have earned had they sold their produce at MSP. Similarly, farmers in other states and crops also suffered losses.
This estimate of the loss is lower than the loss actually incurred by farmers because these estimates are based on Agmarknet prices, i.e. prices reported from the mandi. The proportion of farmers, especially small and marginal farmers, who do not bring their produce to the mandis but sell them at the farm-gate are likely to have sold at prices much lower than those prevailing in these mandis.
Clearly, PM-AASHA has failed to deliver. But was the MSP fixed too high compared to the market signal where the ongoing glut may have warranted a lower price? This requires a much deeper analysis and is beyond the purview of the current work.
Promise to deliver an MSP that is 50 per cent above cost of production
Delivering on his 2014 election manifesto promise of delivering 50% profits over costs to Indian farmers, the Union Budget 2018–19 announced MSPs that were at least 1.5 times the cost of cultivation. We present the MSP changes below.
The cost of cultivation that is taken as the base for increasing MSPs is the A2 + FL costs, that is, the sum of actual paid-out costs and the imputed cost of family labour (FL) (Table 11.1).
In the election manifesto, PM Modi promised to increase MSP by fifty per cent above the cost of cultivation. It was, however, not clarified which cost estimate would be taken as the base cost. The costs which are paid-out by farmers are referred to as A2 costs and upon adding the imputed value of family labour (FL), capital and land to A2, an estimate of comprehensive cost of cutlivation, called C2, is derived. On an average, A2 + FL cost is about 38% below C2 cost. Even though the election manifesto did not clarify on this point, the expectations were that the MSPs will be raised to deliver 50 percent profits over C2 costs, in line with the proosals of the Swaminathan Committee. In reality, as we see the MSPs were raised benchmarking the A2+FL costs.
In terms of economics, however, the prices (in this case MSP) should not be misaligned to the overall demand and supply situation of the commodity/crop in the country (Gulati et al. 2018). So, if MSPs would be raised to deliver a profit of 50% over C2, it would have had an adverse impact on the domestic market and on the global competitiveness of the country in that commodity. As global prices collapsed in the year, it would have made GOI the residual buyer of large stocks of grains if PM Modi would have delivered on its original promise and would have had an adverse impact on the country’s fiscal situation, let alone the impact it would have on the prices domestically. In fact, it was because of the faith the markets had in the inability of the MSP regime to deliver even after increases in MSP that none of the above fears came true. Farmer distress continued as the procurement regime failed the farmer again.
Contract Farming
To promote and expand contract farming in the country, “The State/UT Agricultural Produce & Livestock Contract Farming and Services (Promotion & Facilitation) Act, 2018” was formulated and released in May 2018 by the Ministry of Agriculture for adoption by states/UTs. The Model Act, inter alia, provides for.
-
1.
constituting a “Registering and Agreement Recording Committee” or “designating officer” at district/block/taluka level
-
2.
keeping contract farming activity outside the ambit of the APMC Act
-
3.
engaging FPOs/FPCs
-
4.
ensuring that there is no change/transfer of farmers’ rights, title ownership, etc.
-
5.
setting up contract farming facilitation groups (CFFGs) to promote contract farming and services at the village/panchayat level
-
6.
setting up a dispute settlement mechanism at the lowest level possible for quick disposal of disputes.
Except for Tamil Nadu, which legislated the “Tamil Nadu Agricultural Produce Contract Farming (Promotion and Facilitation) Act 2018”, in all other states/UTs, the Act is still under consideration.
Like other schemes, this initiative too seems to have lost steam.
Now, we move on to evaluate some of the reforms on the input side.
3.3 Input Side Reforms
Improving resource use efficiency is as important, if not more, as improving monetisation of produce if the dream of doubling farmers’ real incomes by 2022 is to be achieved. To improve the efficiency of input use, PM Modi’s government undertook several reforms. Some of the prominent schemes are presented below.
Pradhan Mantri Krishi Sinchayee Yojana (PMKSY)
PMKSY was announced in 2015. In a year, the GOI had identified 99 priority projects (a total of 106 including sub-projects), which would together provide irrigation to 6.8 million hectares.Footnote 3 These projects were scheduled to be completed by December 2019 in a mission-mode exercise. To give a thrust to the initiative and provide resources for timely completion of the 99 projects, the GOI announced the Long-Term Irrigation Fund (LTIF) in the budget of 2016–17. It had an initial corpus of Rs. 20,000 crore that was later increased to Rs. 40,000 crores to be raised by NABARD.
According to the command area development and water management (CAD&WM) website, in 71 projects, there is no or less than 10% progress in creating field channels. Less than half the targeted field channels have been created in the case of 87 projects. As in February 2019, considerable progress was made in only four projects (more than 90%) (Gulati et al. 2019b). At the all-India level, only 51.4% of total targeted potential appears to be achievable by December 2019.
PMFBY or crop insurance scheme
In kharif 2016, PM Modi launched one of his major initiatives, the Pradhan Mantri Fasal Bima Yojana (PMFBY) or crop insurance scheme. It built on the earlier crop insurance scheme called Modified National Agricultural Insurance Scheme (MNAIS) initiated by UPA II, but the premium to be paid by farmers was reduced to 2% (for kharif crops) and 1.5% (for rabi crops). The premium for commercial crops was retained as before at 5%. Since 2017–18, PMFBY enrolment has been made Aadhaar-based.
The cap on sum insured was also removed under the new scheme. Due to the cap, farmers under MNAIS received only a fraction of the cost of cultivation in the case of crop loss. Under PMFBY, insurance was linked to the total cost of cultivation and this helped farmers claim much higher amounts in case of crop failure.
Only 22% of the gross cropped area was covered under the crop insurance in 2015–16. PM Modi set out to achieve a target of covering at least 50% of GCA by 2019. In 2016–17, the coverage increased to 29% but in 2017–18, it came down to 26.37%. In 2018–19, the area coverage stands at 29.33% (Table 11.2).
About 1.43 crore farmers in 2016–17 and 1.56 crore farmers in 2017–18 received claims under PMFBY.
Between 2016–17 and 2017–18, the number of farmers and area insured under crop insurance went down. The fall is attributable to three factors (GOI 2018Footnote 4): (i) introduction of Aadhar-based enrolment which helped detect duplication and resulted in several beneficiaries being removed, (ii) the introduction of farm loan waiver schemes in many states which corrupted the credit culture and adversely affected people wanting to take new loans and (iii) an expected normal monsoon in the year 2017–18.
The scheme appears to have benefited insurance companies more than it supported farmers in distress, a claim also elaborated by Gulati et al. (2019a). The biggest criticisms of the scheme include the following.
-
1.
The net gainers were insurance companies, who gained because the premiums received were greater than the claims settled.
-
2.
State governments tend to delay payment of premiums, leading to a delay in claim settlement when distress arises.
-
3.
Delays in negotiation and finalisation of bids by state governments risks raising premiums. IMD releases its first monsoon forecast by April; unless state governments negotiate the premium before this release, the premium amount is likely to be influenced by the rainfall prediction.
-
4.
The fact that the premiums are negotiated by state governments for only a year pushes up the overall costs of insurance over years. Despite efforts by state governments, they are unable to get insurance companies to negotiate premium terms for at least two, if not three years. This is because of increasing climate variability because of which no company wants to take a risk without covering themselves through the reinsurer, who in turn is unwilling to negotiate long-term contracts because of the unpredictability of weather conditions. All this pushes up the cost of taking insurance.
-
5.
There is delay in the claim-settlement procedure, partially because of inefficiencies in crop-cutting experiments.
-
6.
There is virtually no focus on insuring horticulture and allied activities. Even though there is now a policy for insuring livestock, there has been no substantial ground adoption and penetration. Similarly, despite being high-value crops, horticultural crops are not insured in many states.
Based on the experience gained and analysis of the implementation of the scheme over two years and with a view to ensure better transparency, accountability and timely payment of claims to farmers, the government revised the operational guidelines (OGs) of PMFBY. The revised guidelines came into effect from 1 October 2018, i.e. from the 2018–19 rabi season. The brief features/changes in the revised OGs are as follows.
-
a.
Provision of penalties/incentives for states, insurance companies and banks—A 12% interest rate per annum is to be paid by the insurance company to farmers for delays in settlement claims beyond the prescribed 10-day cut-off date for payment of claims.
-
b.
Similarly, state governments have to pay 12% interest rate for delays in the release of states’ share of subsidy beyond the prescribed three-month cut-off date/submission of requisition by insurance companies.
-
c.
To rationalise the methodology for calculation of threshold yield (TY), the threshold yield used to calculate the claim amount will be estimated using a moving average of the best five out of the latest seven years.
-
d.
The time for change of crop name for insurance has been increased to up to two working days prior to the cut-off date for enrolment instead of the earlier provision of 1 month before the cut-off date.
-
e.
Farmers have been given more time to intimate individual claims—Instead of the 48 hours earlier, farmers now have 72 hours to report; reporting can be done through any relevant official and/or directly on the portal.
-
f.
Post-harvest losses because of hailstorms, apart from those caused due to unseasonal and cyclonic rainfall, have been brought within the ambit of insurance.
One of the biggest setbacks anticipated now is that the interest penalty on insurance companies will be passed into the system as increased premiums and therefore, premiums for kharif 2019–20 are expected to rise. Can an already fiscally constrained country afford this? Does it reflect unpreparedness and lack of clarity on the part of the government?
Ironically, there appears a falling policy thrust on PMFBY in recent times. In fact, Gulati et al. (2019a) point to the fact that systemic inefficiencies and non-transparent operations are forcing private insurance companies to quit the PMFBY scheme. But can a country that is susceptible to massive weather fluctuations and is highly dependent on rains for sustaining agriculture afford to not get its crops (and farmers) insured? And if the private sector exits, can the government agencies offer the desired coverage? Some questions remain unanswered.
3.4 Pradhan Mantri Kisan Samman Nidhi (PM-KISAN)
To increase farm incomes, the Pradhan Mantri Kisan Samman NidhiYojana (PM-KISAN) was launched by PM Modi just before the Parliamentary elections in 2019. Under the scheme, all small and marginal farmersFootnote 5 (i.e. those who operate on landholdings of less than 2 hectares) in the country were to be given an unconditional cash transfer of Rs. 6000 per year in three instalments of Rs. 2000 each. This amount was to be paid directly into the bank account of the identified beneficiaries every four months.
Among the first announcements Mr. Modi made after getting re-elected as the country’s PM in May 2019 was about the extension of the PM-KISAN scheme. The scheme was extended to cover all farmers instead of only small and marginal farmers.
Farmer families owning less than 2 hectares of land are eligible to receive payments under PM-KISAN. A family for this purpose is defined as “a family comprising of husband, wife and minor children who collectively own cultivable land up to 2 hectares as per land records of the concerned state/UT”. According to the Agricultural Census 2015–16, India has over 14.6 crore farmers of whom 86.2% or 12.6 crore are small and marginal farmers.
With an annual budget of Rs. 75,000 crore for 2019–20, the scheme was retrospectively launched from the previous financial year, i.e. 2018–19, for which an additional budget of Rs. 20,000 crore was provided. The allocation for 2018–19 was to be used to make the payment of the first instalment of Rs. 2000 before 1 April 2019. As on 7 March 2019, about 2.2 crore beneficiaries had received the first instalment of Rs. 2000 directly into their bank accounts.
It is a central government scheme, and the entire financial liability is being borne by the Government of India. The responsibilities of state and UT governments include identifying beneficiaries, creating the database and integrating banking infrastructure with GOI’s Public Financial Management System (PFMS) among others.
Main features of the scheme:
-
1.
Beneficiaries:
-
a.
Targeted at only landowners—Only landowners are entitled to receive benefits under the scheme and the existing land ownership system is to be used for identifying beneficiaries. This implies that sharecroppers and the landless labourers are not entitled to receive benefits under this scheme
-
b.
Owners of non-cultivable land—only land which is cultivable entitles its owner for benefits under the scheme
-
c.
Landowners who are not entitled to benefit under the schemes are:
-
1.
Institutional landowners
-
2.
Families with one or more members having a government job, with an income tax paying member, with a member receiving a monthly pension of at least Rs.10,000, or with a member who is professionally qualified and is practising as a chartered accountant, doctor, lawyer, engineer or architect or any other profession
-
1.
-
a.
-
2.
Amount to be transferred
-
a.
Unconditional cash transfer—The entitled amount will be transferred directly into the bank accounts of identified beneficiaries.
-
b.
The entitlement is Rs. 6000 per year to be paid in three equal instalments of Rs. 2000 each for every four-month period.
-
c.
Purpose of the amount—It is an unconditional transfer, and the farmer can use it for anything including procuring inputs related to agriculture and allied activities and meet domestic needs.
-
d.
Conditionality of production—Farmers who receive the money are not required to undertake farming activities.
-
a.
-
3.
Responsibility of the scheme:
-
a.
Financial Liability: It is an entirely central government funded scheme
-
b.
Identifying beneficiaries –State/UT governments are responsible for identifying the landholder families eligible for benefit under the scheme. The government(s) will use the existing land-revenue database to identify the beneficiaries.
-
a.
-
4.
Aadhaar enrolment is compulsory
What does Rs. 6,000 per year mean to a farmer?
-
a.
On the income side,Footnote 6 the pay out of Rs. 6000 per farmer per year works out to between five and seven per cent of the estimated annual income of marginal farmers (those owning less than 1 ha) and five per cent of the estimated annual income of small farmers (those owning 1–2 ha) for 2018–19 (Fig. 11.16).
Fig. 11.16 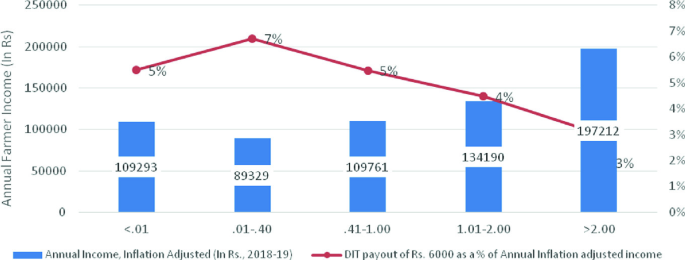
Source NAFIS 2015–16, indexed for inflation and brought forward to 2018–19
Comparing annual farmer incomes (2018–19) with DIT of Rs. 6000/year.

-
b.
On the basis of the weighted average cost of cultivationFootnote 7 for major crops in India, Rs. 3000 per farmer per season (or Rs. 6000 per year) is approximately 10% of the estimated cost of cultivation in the case paddy, 11% in the case of maize, 12% in the case of wheat, 9% in the case of cotton and 5% in the case of sugarcane for 2018–19 (Fig. 11.17).
Fig. 11.17 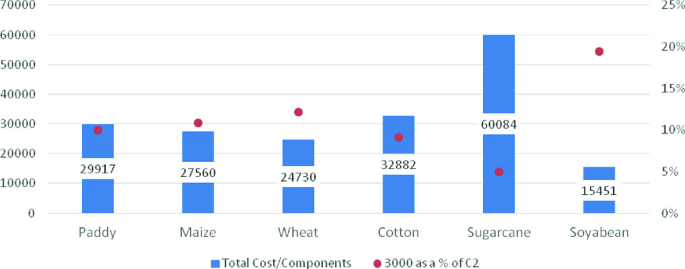
Source Directorate of Economics and Statistics 2015–16, indexed for inflation and brought forward to 2018–19
Comparing DIT with cost of cultivation (C2) (INR/acre) of major crops.

Challenges related to PM-KISAN
-
1.
Adequacy of amount: Prima facie, an amount of Rs. 6000/year/farmer family or Rs. 17/day, appears to be extremely inadequate. But farmers’ incomes and costs of agricultural inputs vary significantly across states in India. The implications and importance of Rs. 6000/year/farmer family, therefore, will be significant in some regions but inadequate in others. Further, the fact that this payment is not indexed to inflation and is instead fixed at least for the FY 2019–20 may lead to the net impact of this income support being negligible.
-
2.
Exclusion of sharecroppers, tenants and landless: PM-KISAN, in its present version, covers only landowning small and marginal farmers under its ambit and excludes sharecroppers, tenant farmers and landless agricultural labourers. This, despite the fact that agricultural workers form a significant proportion of the overall agricultural labour force, renders a community of agricultural workers in financial distress almost invisible. PM-KISAN’s counterpart KALIA, in Odisha, on the other hand, covers these sections and hence, is more inclusive.
-
3.
High chances of inclusion and exclusion: The operational guidelines of PM-KISAN lay out a detailed exclusion criterion for beneficiaries such that the benefits of the scheme reach only the targeted audience. While parameters such as institutional ownership of land, former or present employees of government bodies, etc., do hold merit, a better approach could have been using household level granular data available in SECC 2015–16, which lays out information on household asset ownership, sources of household income, etc. Using this information as a means of exclusion/inclusion could have led to a more focused and targeted approach based on a realistic assessment of welfare among agricultural households. The present criteria could also give rise to a situation in which relatively prosperous households end up getting benefits of the scheme at the expense of those who may fall under one or more categories of exclusion for PM-KISAN but still may be under extreme financial distress. A more robust design, such as that of the 9-Point Action Plan for Public Distribution System (PDS),Footnote 8 would have minimised these concerns.
-
4.
Inadequately updated land records: PM-KISAN uses landownership and land-holding size as a means to target and identify farmers. However, the fact that land records across Indian states/UTs, despite initiatives like the Digital India Land Record Modernisation Programme (DILRMP) being enforced by the Union Government since 2008 are inaccurate raises questions about the degree of success of PM-KISAN.
-
5.
Last-mile connectivity: Low banking density restricts the success of PM-KISAN as banking density or last-mile banking connectivity is crucial for delivering the direct cash benefits conceptualised under the scheme. Last-mile connectivity, which depends on the penetration of banking and financial institutions in rural areas, remains low despite institutionalised efforts in the form of the Pradhan Mantri Jan Dhan Yojana (PMJDY) (Fig. 11.18).
Fig. 11.18 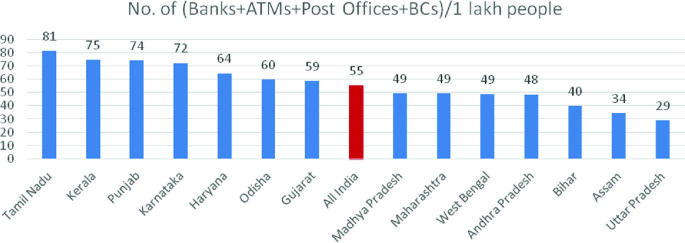
Source No. of Bank Branches, ATMs: RBI: Sep 2018; No. of Post Offices: Department of Posts, Ministry of Communications & IT, 2014–15; No. of BCs: SLBC, Respective States/UTs
Banking density across different states/UTs in India.

The combined number of bank branches, ATMs, banking correspondents and post offices per 1 lakh people is the highest for Tamil Nadu (81), Kerala (75) and Karnataka (72), while it is the lowest for Uttar Pradesh (29), Bihar (40) and Andhra Pradesh (48). The all India average is 55.
-
6.
Crowding out investment: PM-KISAN involves huge costs. The question is who pays for it? In the wake of the huge fiscal implications of PM-KISAN, and the limited scope for generating alternative stream of revenues, it is imperative for the government to reduce investments in areas other than agriculture in coming years. Crowding out investment from other essential key areas of the economy could lead to a self-defeating situation for India in which the price of PM-KISAN may be borne by an already struggling manufacturing sector, for instance. The best way, therefore, would have been to convert input subsidies, say on fertilisers, into direct income transfers. One hopes that it can still be done; otherwise, this additional expenditure on PM-KISAN may start eating into potential public investments in agriculture.
-
7.
Fiscal implications: Rs. 75,000 crore is approximately 0.4% of the 2018–19 GDP, a huge sum for a country whose fiscal deficit for 2018–19 was reportedly 115% of its FY target and approximately 3.3% of the GDP for FY 2018–19.Footnote 9 An increase in the coverage of the scheme or amount of benefit/farmer could further put tremendous pressure on the fiscal health of the economy. A high fiscal deficit, coupled with payments for DIT and interest on loans by government, instead of infrastructure investment, could lead to a worsening of the fiscal situation, which would result in more than normal inflation, the burden of which will again fall on the poor the most.
We now turn to the issue of farm loan waivers.
3.5 Farm Loan Waiver
Although farm loan waiver was not an all-India policy, but when PM Modi declared a complete loan waiver in an election rally in Uttar Pradesh, it triggered a spate of similar announcements from other states too. Seven Indian states had announced farm loan waiver (FLW) schemes ahead of their state elections. We present below facts about these loan waiver schemes (Table 11.1). Four features of loan waivers stand out.
-
a.
These promises are generally made by political parties before elections (Column 2).
-
b.
These waivers are distributed in a phased manner between years; thus, the amounts are spread through state budgets in subsequent years (Columns 4 and 5).
-
c.
As in other government schemes, there are large inefficiencies in the programme. For one, there is a very high exclusion error: the really needy, i.e. the poor and vulnerable farmer who does not have access to credit from institutions. As per NABARD’s NAFIS, only 30.3% of Indian agricultural households took loans from institutions; all others, i.e. about 70% of Indian peasantry did not take an institutional loan and thus do not stand to benefit from a FLW.
-
d.
A farm loan waiver has an adverse impact on the credit culture in the state as most people who take loans do not return it in anticipation of a farm loan waiver (Table 11.3)
Table 11.3 Loan waivers announced and allocated by various states since 2017–18
Overall, this type of farmer support is not only economically inefficient but is also not likely to yield much benefit to political parties because of the limited number of people it is likely to benefit.
3.6 Other Schemes
Innovation and Agricultural Entrepreneurship under RKVY-RAFTAAR—The Rashtriya Krishi Vikas Yojana (RKVY) is an important scheme of the Ministry of Agriculture and Farmers’ Welfare (MoA&FW) aimed at strengthening infrastructure in agriculture and allied areas. In order to promote agricultural entrepreneurship and agro-businesses by providing financial support and nurturing an incubation ecosystem, a new component under the revamped scheme RKVY- RAFTAAR was launched in 2018–19.
Promotion of Agricultural Mechanisation for in-situ Management of Crop Residue: The objective of the scheme is to address air pollution caused by in situ crop residue burning in the states of Punjab, Haryana, Uttar Pradesh and the NCT of Delhi. The scheme envisages establishing custom hiring centres to provide subsidised machinery and equipment to individual farmers to dispose of in situ crop residue. Financial assistance up to 50% of the cost of procuring equipment and machinery is to be provided to individual farmers. State governments, ICAR, KVKs, PSUs, etc., are also involved in taking up education and communication and information activities to spread awareness on in situ crop residue management techniques. Capacity building programmes, training, demonstration camps and mass awareness programmes are conducted for all interest groups to achieve zero straw burning.
Rashtriya GokulMission: The mission focuses on the development, preservation and conservation of indigenous breeds. This is done through selective breeding and genetic up gradation of non-descript cattle using elite indigenous breeds like Gir and Sahiwal. The mission also works towards increasing milk production and productivity and breed improvement programmes for indigenous cattle to increase stocks. Besides, there is a provision for the distribution of disease-free, high genetic merit bulls for natural service and the establishment of an e-market portal for bovine germplasm to connect breeders and farmers. The scheme subsumes the National Programme for Bovine Breeding, Indigenous Breeds and the new National Mission on Bovine Productivity.
Scheme for Assistance to Sugar Mills for the 2017–18 season: The scheme is being implemented to clear arrears of the 2017–18 sugar season and for previous sugar seasons due to record sugar production. The scheme aims to provide financial assistance to sugarcane farmers at the rate of Rs 5.5/quintal of cane crushed.
Pradhan Mantri Kisan SAMPADA Yojana (PMKSY)
The Ministry of Food Processing Industries (MoFPI) is implementing an umbrella central sector scheme the “Pradhan Mantri Kisan SAMPADA Yojana (PMKSY)” with a total allocation of Rs. 6000 crore. The implementation period is 2016–20. Under PMKSY, financial assistance as capital subsidy in the form of grants-in-aid is provided to eligible applicants against an expression of interest issued by the MoFPI from time to time. The PMKSY has seven component schemes, i.e. (i) mega food parks, (ii) integrated cold chain and value addition infrastructure, (iii) creation/expansion of food processing and preservation capacities, (iv) infrastructure for agro-processing clusters, (v) creation of backward and forward linkages, (vi) food safety and quality assurance infrastructure and (vii) human resources and institutions. Individuals, farmers, farmer producer organisations (FPOs), entrepreneurs, co-operatives self-help groups (SHGs), private companies and central/state PSUs, etc., are eligible for financial assistance. The scheme is being implemented in all states. The rate of subsidy ranges from 35 to 75% of the eligible project cost, subject to a maximum specified limit depending on the scheme and location of the project. However, state-wise allocation of funds has not been made under any of the schemes.
4 Way Forward
Unfulfilled promises and falling profitability in most crops have made farmers worse off in the last five years. Climate change and variability have only increased their woes and deepened the distress. From increasing MSP to giving farm loan waivers, all routes have been explored but have not brought about any amelioration of farm distress. So, what is the problem? Is the government unable to understand the problem? Or is the solution that is being advocated incorrect? Or is it that the solution is correct but there are gaps in the scheme or policy implementation because of which the farmers’ problems have persisted over the years? Or is it a mix of all these problems?
The solution lies in a more comprehensive review of the Indian agricultural policy landscape as one starts looking ahead under Modi 2.0. The focus must be on effective and timely implementation of various commendable programmes that the government under Prime Minister Modi has initiated, be it Fasal Bima Yojana or Krishi Sinchayee Yojana, or the creation of a national agriculture market. This requires dispassionate analysis of what has gone wrong, hard work and perseverance through a concurrent evaluation of all major programmes so that they can be tweaked in time for better delivery, and if need be, be replaced by better alternatives. The litmus test is whether the farmers’ economic situation improves, and whether the problems of poverty and malnutrition are alleviated faster. The thrust from the farming community will increase demand for manufacturing commodities, activating a multiplier effect on the overall economy. This truly will reflect “sabka saath,sabka vikas”, which is the motto of PM Modi.
Notes
- 1.
The 2014 election manifesto of BJP can be accessed at https://www.thehinducentre.com/multimedia/archive/03226/full_manifesto_eng_3226788a.pdf.
- 2.
Both revenue and expenditure values are given on per kg or per quintal basis and the food subsidy is estimated after multiplying the excess of expenditure over revenue with the total amount of grain handled in the year.
- 3.
Earlier, this target was 7.6 million hectares.
- 4.
- 5.
Farmers are defined as the landowners. This means that landless or tenant farmers were not covered under this scheme.
- 6.
Average annual farmer income as per NAFIS 2015–16, indexed for inflation and brought forward to 2018–19.
#Method for Inflation Indexing used throughout the paper: 1. Inflation indexed amount = [Amount in base year/CPI for base FY]*CPI current FY; CPI base FY has been calculated by taking the simple average of all the months in the FY; Source for Data for CPI: MOSPI.
- 7.
Weighted average calculated with data for C2, Directorate of Economics & Statistics 2015–16, indexed for inflation and brought forward to 2018–19.
- 8.
Circular No. PDS-64—Civil Supplies Corporation, GoI (2007).
- 9.
Reserve Bank of India Bulletin (2019, February).
References
APLM. (2017). Model Act The State/UT Agricultural Produce and Livestock Marketing (Promotion and Facilitation) Act 2017. Ministry of Agriculture, Government of India. https://agricoop.nic.in/sites/default/files/APLM_ACT_2017_1.pdf.
Das. (2019). Reforming FCI not a piece of cake. The Financial Express. https://www.financialexpress.com/opinion/reforming-fci-not-a-piece-of-cake/1586038/
DCR. (2018). Dalwai committee report volume 4. https://farmer.gov.in/imagedefault/DFI/DFI%20Volume%204.pdf..
Gulati, A., Chatterjee, T., & Hussain, S. (2018). Supporting Indian farmers: Price support or direct income/investment support? ICRIER Working Paper Number 357.
Gulati, Hussain, & Khurana. (2019a).Story of Indian crop insurance: Many successes, more challenges. Upcoming ICRIER working paper.
Gulati, A., Sharma, B., Banerjee, P., & Mohan, G. (2019b). Getting more from less: Story of India’s shrinking water resources. NABARD and ICRIER report, Indian Council for Research on International Economic Relations.
NFSA. (2013). National Food Security Act 2013. Government of India. http://www.egazette.nic.in/WriteReadData/2013/E_29_2013_429.pdf.
MOC. (2018). Ministry of commerce, agriculture export policy. https://commerce.gov.in/writereaddata/uploadedfile/MOC_636802088572767848_AGRI_EXPORT_POLICY.pdf..
TFAMR. (2002). Report of Taskforce on Agricultural Marketing Reforms. Directorate of Marketing and Inspection, Ministry of Agriculture. Government of India. https://dmi.gov.in/Documents/ReportTaskForceAMR.pdf.
Author information
Authors and Affiliations
Corresponding author
Editor information
Editors and Affiliations
Rights and permissions
Open Access This chapter is licensed under the terms of the Creative Commons Attribution 4.0 International License (http://creativecommons.org/licenses/by/4.0/), which permits use, sharing, adaptation, distribution and reproduction in any medium or format, as long as you give appropriate credit to the original author(s) and the source, provide a link to the Creative Commons licence and indicate if changes were made.
The images or other third party material in this chapter are included in the chapter’s Creative Commons licence, unless indicated otherwise in a credit line to the material. If material is not included in the chapter’s Creative Commons licence and your intended use is not permitted by statutory regulation or exceeds the permitted use, you will need to obtain permission directly from the copyright holder.
Copyright information
© 2021 The Author(s)
About this chapter

Cite this chapter
Saini, S., Gulati, A. (2021). Indian Agriculture Under PM Modi 1.0 2014–2018. In: Gulati, A., Roy, R., Saini, S. (eds) Revitalizing Indian Agriculture and Boosting Farmer Incomes. India Studies in Business and Economics. Springer, Singapore. https://doi.org/10.1007/978-981-15-9335-2_11
Download citation
DOI: https://doi.org/10.1007/978-981-15-9335-2_11
Published:
Publisher Name: Springer, Singapore
Print ISBN: 978-981-15-9334-5
Online ISBN: 978-981-15-9335-2
eBook Packages: Economics and FinanceEconomics and Finance (R0)