
Abstract
In the screening of complex mixtures, for example combinatorial libraries, natural extracts, and metabolic incubations, different approaches are used for integrated bioaffinity screening. Four major strategies can be used for screening of bioactive mixtures for protein targets—pre-column and post-column off-line, at-line, and on-line strategies. The focus of this review is on recent developments in post-column on-line screening, and the role of mass spectrometry (MS) in these systems. On-line screening systems integrate separation sciences, mass spectrometry, and biochemical methodology, enabling screening for active compounds in complex mixtures. There are three main variants of on-line MS based bioassays: the mass spectrometer is used for ligand identification only; the mass spectrometer is used for both ligand identification and bioassay readout; or MS detection is conducted in parallel with at-line microfractionation with off-line bioaffinity analysis. On the basis of the different fields of application of on-line screening, the principles are explained and their usefulness in the different fields of drug research is critically evaluated. Furthermore, off-line screening is discussed briefly with the on-line and at-line approaches.

Schematic view of an on-line bioaffinity analysis or HRS setup with MS based bioassay detection
Introduction
Within the pharmaceutical industry, microplate-based high-throughput screening (HTS) methodology is used for most bioaffinity screening applications from the early hit stage up to the phase of lead development. These approaches suffer from a number of limitations, especially the purity of the compounds screened. When dealing with mixtures, identifying the individual bioactive compounds can be a cumbersome endeavor. This is also true when combinatorial chemistry and parallel synthetic libraries are used as starting points for drug discovery.
Conventionally, when dealing with bioaffinity assessment of mixtures, they are first fractionated [1], the collected fractions are evaporated, and microplate bioassays are used to detect the bioactive fractions, eventually in parallel with compound identification by mass spectrometry (MS) and/or nuclear magnetic resonance (NMR) spectroscopy [2–7]. The general workflow of such a process is depicted in Fig. 1. The challenge in these procedures lies in the difficulty of correctly matching the dereplicated bioactive compounds in particular fractions with their chemical structure [8, 9]. Typical examples include fractionation of intact proteins before matrix-assisted laser-desorption ionization (MALDI) MS analysis [10], and many types of biochemical assay formats that are conducted after fractionation of bioactive mixtures, such as natural extracts [11, 12], metabolic mixtures [13], and environmental mixtures [14–17]. The main drawback is that the high resolution obtained from the separation step (chromatographic peaks of seconds to tens of seconds) is often lost in the low-resolution fractionation process (fractions in the minute range are common).

Traditional HTS with (often iterative) deconvolution processes: (1) chromatographic separation, (2a and 2b) split to MS and a fractionation device, (3) solvent evaporation step, (4) addition of biochemical assay reagents, (5) incubation step, (6) assay readout with a plate reader. Monitor screen, attempt to correlate low-resolution bioaffinity trace with the high resolution MS trace
Recent advances in separation science and detection technology have fuelled research into adjusted or newly designed bioassay formats [18, 19]. Our research interest is in bioassays hyphenated to analytical separation techniques. Pre and on-column bioaffinity screening formats will be reviewed by us in the near future [20]; this paper focuses on MS based post-column bioassay formats.
The direct on-line post-column coupling of a bioassay to a chromatographic separation is an effective alternative to HTS. This so-called high-resolution screening (HRS) demands rapid and straightforward on-line bioassays in order to achieve high resolution and sensitivity [21–23]. HRS was pioneered by the research groups of Przyjazny [24, 25] and Irth [26], using HRS systems based on UV or fluorescence detection. In this review, the focus is on HRS systems in which MS detection is an integrated part of the analytical approach. There are currently three general ways to implement MS detection in HRS:
-
1.
MS detection replaces UV or fluorescence detection, thus providing MS-based readout of the bioassay (Fig. 2a);
Fig. 2 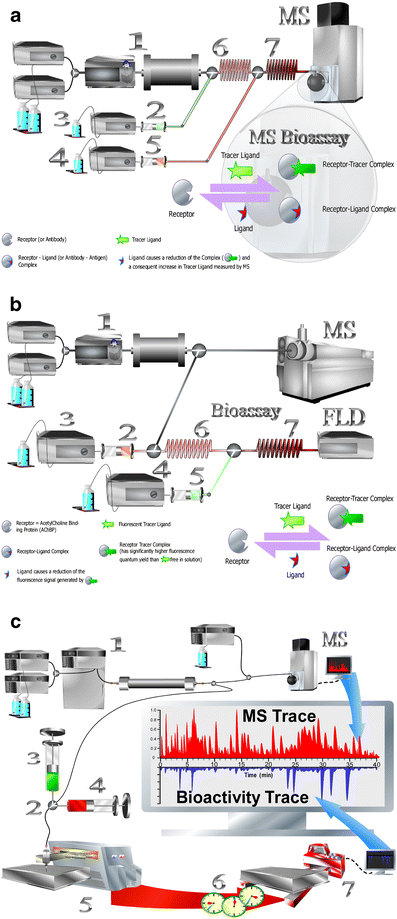
a. Schematic view of an on-line bioaffinity analysis or HRS setup with MS based bioassay detection. (1) Separation (a gradient LC system, an autoinjector, and a column are shown). The bioassay comprises, first, the on-line addition of receptor via a superloop (2) operated by an HPLC pump (3). Second, the tracer ligand is added in a similar fashion by another HPLC pump (4) and superloop (5). The first reaction coil (6) enables binding of eluting ligands followed by a second incubation step in the second reaction coil (7) where the tracer ligand is allowed to bind to the remaining free receptor binding sites before detection by MS. Inset: schematic representation of the biochemical binding process during on-line bioaffinity assay with MS readout. b. Schematic view of a HRS setup with fluorescence-based bioassay detection. (1) Separation with split to the on-line bioassay and MS. Part of the bioassay operation is the same as discussed for Fig. 2a (points 2 to 6). After on-line incubation of tracer in the second reaction coil (7) detection occurs with a fluorescence detector (FLD). Inset: Schematic representation of the biochemical binding process during on-line bioaffinity assays. Shown is the principle of fluorescence enhancement (for the AChBP). The assay type can be converted into an MS-based bioassay by continuous monitoring of the m/z of the (non-receptor bound) tracer ligand (Fig. 2a). c. Principle of at-line bioaffinity analysis mode. After mixture separation by gradient LC (1), one part of the column effluent is split to MS for compound identification. The remaining part is directed towards a mixing device (2) where it is mixed with all necessary biochemicals via syringes (3 and 4). Subsequently, this mixture is micro fractionated (5) and the so generated high-resolution well plate (384 or 1536 wells) is incubated for any amount of time (6) before it is prepared to be read on a plate reader (7) before eventual correlation with the MS trace
-
2.
MS detection is performed in parallel with the (fluorescence-based) on-line bioassay (Fig. 2b); and
-
3.
MS detection is performed in parallel with microfractionation before off-line bioassay (Fig. 2c).

In all three approaches, chemical information derived from MS detection can be directly correlated with the bioaffinity information [27–29]. Available examples of MS-based HRS systems are reviewed and the merits and limitations of the various approaches to MS-based HRS bioassays are discussed.
On-line bioaffinity analysis with direct MS readout
History
Initial proof-of-principle of HRS approaches was performed with colorimetric (UV–visible) and fluorescence readout. In these studies, high-affinity binding partners, for example biotin − (strept)avadin and/or digoxin − anti-digoxin antibodies were used. The HPLC eluent with biotin and biocytin as analytes was mixed with a continuous flow of an avidin solution, in which a dye ligand with increased absorption properties upon avidin binding provided the detection principle [24]. Subsequently, UV detection was replaced by fluorescence detection in a system in which biotin, upon binding, results in fluorescence enhancement of the fluorescently labeled avidin [25]. Although the fluorescence-based bioassay was more sensitive, the technique was intrinsically compromised by the need for unknown ligands to cause fluorescence enhancement upon binding. A ligand displacement approach with a fluorescent antibody tracer enabled analysis of unknown ligands by the use of an immobilized ligand affinity column before detection [26]. Various other applications were developed along these lines. Alternatives to the affinity trapping columns were also investigated, e.g., the use of hollow fibers to separate tracer ligand and antibodies [30], flow cytometry with analyte-coated beads [31], and free-flow electrophoresis to separate bound and unbound tracer analyte [32]. Theoretical concepts of on-line post-column bioaffinity analysis were discussed in detail by Oosterkamp et al. [33, 34].
MS for on-line bioassay readout
The first example of an on-line bioassay with electrospray ionization (ESI) MS rather than fluorescence readout was described by Hogenboom et al. [35]. A typical bioassay setup with direct MS readout is depicted in Fig. 2a. The competitive bioassay specifically used the high-affinity streptavidin and fluorescein-biotin interaction. Because the affinity interaction between biotin and streptavidin is one of the strongest currently known interactions (K a = 0.6 × 10¹⁵ L mol−1), this affinity complex is easily preserved during the ESI MS process. The use of fluorescein-biotin enabled straightforward comparison with the fluorescence readout demonstrated previously. A lower affinity interaction between anti-digoxin and digoxin (K a = approx. 109 L mol−1) was also tested and gave comparable results. An important consideration here is that in-solution dissociation constants cannot simply be correlated with the degree of conservation of non-covalent complexes in the gas phase. Typically, complexes involving electrostatic interactions are easily preserved or even strengthened because of the lack of solvent shielding in a vacuum. In contrast, complexes involving hydrophobic interaction tend to dissociate readily in the gas phase. This implies that for every target–ligand interaction, the optimum bioassay conditions for on-line MS based bioassays have to be determined.
Derks et al. demonstrated one of the main advantages of MS as readout, namely the ease of measuring different ligand − target interactions simultaneously in one bioassay [36]. They measured streptavidin − biotin and anti-digoxin antibodies − digoxin interactions in one bioassay format. The small ligand molecules (biotin and digoxin) were chromatographically separated before on-line bioaffinity analysis with direct MS readout.
When coupling the effluent of an LC separation on-line to a bioassay, one has to be aware of specific compatibility problems. First, the effluent has to be diluted to bioassay-compatible conditions. Therefore, the organic modifier concentration has to be lowered to a maximum of 5 to 10% for most (soluble) enzyme and receptor targets. This means that dilution by a factor of 10 to 20 has to be established, assuming that very high organic modifier concentrations are often used at the end of reversed-phase gradients. Furthermore, as many LC separations use acid modifiers, dilution (with bioassay buffer, target enzyme, and tracer ligand or substrate) must also result in a change in pH to a bioassay compatible pH. For this, the buffer capacity should be sufficient; but for MS compatibility, on the other hand, the buffer concentration should not be too high. For the process of mixing in the post-column bioassay, a standard inverted Y-piece suffices. The actual on-line incubation can occur in normal PEEK tubing, but when slightly longer reaction times are required (usually for enzymes), a knitted reaction coil can be used instead to reduce post-column band broadening. A typical advantage of this technique is that the very short post column incubation times enable use of slightly higher concentrations of organic modifier than with traditional bioassays.
With potential ESI ion source contamination and the associated ionization suppression in mind, one could raise questions against the concept of direct ESI MS readout in biochemical assays. Because of the continuous influx of proteins, buffers, and, eventually, other constituents of the bioassay into the ESI MS source, in several cases an on-line bioassay is not truly compatible with ESI MS readout. However, from the bioassay perspective, important benefits are achieved with MS readout compared with fluorescence readout. Most importantly, MS-based bioassays do not rely on the availability of fluorescent probes, tracers, or substrates. There are evident problems with fluorescent labeling because ligands, substrates, or other bioassay components must be chemically modified to incorporate the fluorescent label required. With MS readout, native ligands or substrates can be used. When, in addition, the bioassay is coupled on-line to LC separation in a continuous-flow format for bioaffinity assessment in mixtures, the MS can be used to simultaneously measure drug target–ligand/substrate interaction and identify the ligands/substrates [35]. For this purpose, the mass spectrometer is used in two modes:
-
1.
selected-ion monitoring (SIM) or selected-reaction monitoring (SRM) to detect and quantify the free ligand concentration (for ligand-binding assays) or the product formed (for enzymatic drug targets); and
-
2.
full-spectrum operation, eventually involving data-dependent switching to MSn acquisition, to identify the eluting ligands.
When looking in more detail at mass spectrometers that could be used for full-spectrum operation (mode 2), the advantages and disadvantages are the same as when performing normal LC–MS(–MS) analysis. One has to bear in mind, however, that when combining both bioassay monitoring (mode 1) and analyte/ligand identification (mode 2), the analyte/ligand identification part is hampered by the post-column bioassay dilution and buffer conditions that are less favorable for typically used positive ESI ionization (low organic modifier concentration at a bioassay-compatible pH of ~6 to 7.5). For the bioassay part (mode 1), usually a robust and convenient mass spectrometer should suffice (e.g. ion-trap or quadrupole) but, because the analyte identification part (mode 2) demands good sensitivity, resolution, and the possibility of analyte fragmentation, often a hybrid mass spectrometer is the first choice. When one deals with a bioassay with a very low rate of enzymatic product formation or a low concentration of enzyme in the bioassay, a triple-quadrupole mass spectrometer, which enables very specific and sensitive product monitoring, could be considered. Until now however, in most cases a Q-TOF (or ion-trap–time-of-flight) mass spectrometer has been the instrument of choice enabling mode 1 with sufficient sensitivity and specificity and mode 2 with sufficient sensitivity and resolution and the possibility of analyte fragmentation.
Figure 3 shows a typical example of results obtained with HRS methodology employing MS readout. In this particular case, inhibition of the protease cathepsin B was monitored (see below) [37]. Cathepsin B converts a continuously introduced peptide substrate (Z–Phe–Arg–AMC) into the two products Z–FR (CBZ–Phe–Arg) and AMC (7-amido-4-methylcoumarin), which are monitored by MS in SIM mode. Replicate injection of a concentration series of an inhibitor results in negative peaks, the height of which is related to the extent of protease inhibition. If the inhibitor was an unknown compound, its MS and MSn characteristics may have been retrieved from simultaneously acquired full-spectrum data also.

Traces of an on-line bioassay for cathepsin B operated in flow-injection analysis mode with MS as bioassay readout. An inhibitor is injected in triplicate in increasing concentrations, shown in the bottom MS trace, in order to identify eluting inhibitors. Bioaffinity is detected as negative peaks by monitoring changes in the concentrations of both resulting products AMC (middle AMC EIC trace) and Z-FR (upper Z-FR EIC trace) from the enzymatic cleavage
Next to the advantages, there are also some disadvantages and limitations of MS-based bioassay readout [38], some of which have already been discussed above. The disadvantages primarily lie in the requirements needed for ESI MS analysis. In general, (positive-ion) ESI MS is favored by a high organic modifier content and low mobile phase pH, which is incompatible with most bioassays. Second, ESI MS restricts the type of buffers, buffer strength, and other additives present. Generally, many non-volatile additives are used in bioassays to mimic physiological conditions, e.g., phosphate buffers, non-volatile salts such as sodium chloride, and co-factors. Blocking agents and/or detergents are sometimes needed to prevent adhesion of the target protein or protein complexes to the surface of the reaction coils and HPLC tubing. All these solvent constituents, necessary for good bioassay performance, cause significant ionization suppression in ESI MS. In several cases, the phosphate buffer in a bioassay can be easily replaced by volatile and MS-compatible alternatives, for example ammonium formate or ammonium acetate solutions (pH between 6 and 7.5). However, in general, compromises in solvent composition have to be made, and these, in turn, compromise the performance of both the bioassay and the ESI MS readout. Finally, the LC column effluents are diluted, typically by a factor of 10 to 20, when mixed with the biochemical reagents in the continuous-flow system for the post-column incubation step before MS readout. Moreover, band broadening occurs in the reaction coils during incubation.
Important aspects of getting an on-line MS-based bioassay to function properly are, in most cases, the use of volatile buffers at a slightly lower pH than 7 and a buffer strength that just has the capacity to neutralize the often acidic LC effluent. When cofactors and/or additional ions, e.g., magnesium, sodium chloride, are needed, these also must be used in the lowest possible concentration for the bioassay, which is often much lower than those used with traditional bioassays. The target enzyme or receptor is required in a (partly) purified form. Finally, one must realize that the MS might have to be cleaned somewhat more frequently than normally. Despite these disadvantages and limitations, MS readout is still an interesting option for HRS applications when no other appropriate bioassay alternatives are available. Some additional application examples are discussed below.
Applications of on-line bioassays with MS readout
Acetylcholinesterase (AChE) is an enzyme that hydrolyzes the neurotransmitter acetylcholine, producing choline and acetic acid. AChE is found at neuromuscular junctions and cholinergic synapses in the central nervous system, where its activity serves to terminate synaptic transmission. As such, AChE is the target of many Alzheimer's drugs, nerve gases (e.g. Sarin), and insecticides.
An on-line bioassay with MS readout for the identification of AChE inhibitors was described by de Jong et al. [39]. The native substrate acetylcholine was used and the product choline was monitored on-line by MS readout. Inhibitory compounds prevent product formation in the reaction coils before MS. Figure 4 shows the MS traces of both the substrate and the product in the on-line substrate conversion assay, and the MS trace of the injected inhibitor galantamine. It also shows the process of starting up the bioassay in the first 20 min of the chromatograms. The MS is operated in such a way that both inhibitor identification and on-line enzyme activity monitoring are achieved.

On-line monitoring of AChE-catalyzed hydrolysis of the native substrate acetylcholine (ACh, lower trace) into its product choline (Ch, middle trace). The bioassay start-up events are also shown. After ~5 min (1), ACh is continuously added, resulting in an increased baseline for the EIC trace of the m/z corresponding to ACh. Subsequent start-up of continuous addition of the enzyme AChE at ~15 min (2) starts the on-line enzymatic conversion detected as a reduced EIC trace of the m/z of ACh and an increased EIC trace the m/z of the product Ch. The upper trace shows the injected inhibitor galanthamine identified in the MS trace by its molecular mass. Inhibitory peaks are consequently detected in the lower two bioaffinity traces as negative peaks for Ch and positive peaks for ACh. (Adapted from de Jong et al. [39])
Phosphorylation and de-phosphorylation of proteins and peptides, and the formation and breakdown of cyclic phosphate molecules, e.g., cAMP and cGMP, are pivotal for most endogenous signaling processes [40]. Protein phosphatase and kinase enzymes are involved in these processes. Post-column on-line affinity-based analysis of phosphorylated peptides and proteins was described by Krabbe et al. [41, 42], who used a ligand-exchange reaction between eluting phosphopeptides/proteins and the metal–ligand complex iron(III)–methylcalcein blue, which releases the tracer ligand methylcalcein blue. The reaction is monitored by MS, switching between SIM and data-dependent MS–MS, enabling both quantification of the tracer and identification of the phosphopeptides. This proof-of-principle study also demonstrated that the approach, although elegant, lacks sufficient sensitivity for studies in which very low concentrations of phosphopeptides are involved, for example phosphoproteomics studies.
Different approaches to an on-line inhibition assay of a protease/peptidase were reported by de Boer et al. [37, 43, 44], who used the enzymatic conversion of a peptide substrate by cathepsin B into two products (Z-FR and AMC) as a model system. Product formation was continuously monitored by direct on-line ESI MS (Fig. 3). The enzymatic conversion rate was reduced on injection of an inhibitor, resulting in negative peaks in the MS readout. By combining SIM analysis of the products and full-spectrum analysis, unknown inhibitors can be detected and characterized, using the extracted-ion chromatogram (EIC), as shown in Fig. 5, where a fungal extract containing bioactive compounds is profiled. Correlation between SIM and EIC traces enables retention time and peak shape correlation between bioaffinity and chemical information (m/z of the inhibitor) [37]. In a follow-up study, high-temperature LC, enabling lower organic modifier concentrations, was demonstrated [43]. As the ESI MS source in direct monitoring of a biochemical reaction mixture is prone to contamination, miniaturization of the bioassay can be highly advantageous. Reduction of the flow-rate of the bioassay to the ESI MS source by a factor of 25–50 was achieved by use of microfluidics-based continuous flow [44].

HRS analysis of a fungal extract for Cathepsin B inhibitors. (a) Extracted ion chromatogram (EIC) of the enzymatic cleavage product AMC (m/z 176.0). (b) EIC of the other enzymatic cleavage product Z-FR (m/z 456.0). (c−g) EIC of various m/z values, which were present as an abundant peak in the mass spectrum recorded at t R = 43.3 min. c EIC of m/z 211.0. (d) EIC of m/z 230.0. (e) EIC of m/z 292.9. The EICs of m/z 677.3 (f) and of m/z 693.2 (g) have peaks with the same retention time and peak shape as the bioactive peaks, thus correlating bioaffinity with identity (in terms of m/z values measured; adapted from de Boer et al. [37])
On-line bioaffinity analysis with parallel MS detection
As discussed above, direct MS readout of bioassays is not always attractive, especially because of potential ionization suppression effects. However, it must be emphasized that on-line implementation of MS detection in HRS applications is necessary for compound identification. In that case, on-line MS detection is performed in parallel with the bioassay readout based on, e.g., fluorescence detection. This general setup is depicted in Fig. 2b. It features a post-column split with part of the column effluent being directed to the continuous-flow bioassay and another part to ESI MS (or MSn) for simultaneous chemical characterization of the eluting bioactive compounds. The parallel setup enables direct correlation of chemical and biological information (in a similar way as demonstrated for direct MS readout in Fig. 5). For analysis of bioactive mixtures, this setup is a powerful and versatile alternative to traditional fractionation processes followed by microplate bioassays.
In this section, various examples and applications of on-line bioaffinity analysis with parallel MS detection are reviewed. In this HRS format, ligand-binding and substrate conversion bioassays are most conveniently incorporated. For this, fast and straightforward bioassays are needed in order to allow sensitive detection and limited post-column band broadening in the reaction coils. However, a good percentage of targets with corresponding biochemical assay formats can be implemented efficiently in HRS systems. Examples include nuclear receptors, protein kinases, proteases, phosphodiesterases and phosphatases, and metabolic enzymes. In these cases, HRS can often give very rapid, robust and complete bioaffinity profiles of mixtures containing bioactive compounds.
Enzymatic conversion by AChE and binding to AChBP
Before the development of the MS-based on-line AChE bioassay, another, colorimetry-based, on-line bioassay was used [45] to enable the identification of inhibitors in extracts of the narcissus “Sir Winston Churchill” [46]. The alkaloid ungiminorine was found to have a mild inhibitory effect on AChE. A more sensitive AChE bioassay was achieved by the use of a substrate which is hydrolyzed to a highly fluorescent product [47]. Using this approach, various bioactive plant extracts from bulbs of Galanthus nivalis, Eucharis amazonica, Crinum powelli, and Nerine bowdenii were screened and compounds with strong AChE inhibitory activity were detected and characterized by parallel MS detection. The same HRS system was used by Marques et al. to screen microsomal metabolic incubations of the first-generation Alzheimer’s drug tacrine for bioactive metabolites [48]. Parallel MS and off-line NMR after fraction collection was performed to characterize the metabolites. This example demonstrates that in some cases MS and MSn characterization is insufficient for full identification of unknown bioactive compounds. The correlation between bioaffinity and MS-based chemical information obtained from HRS may direct fractionation. This improves the efficiency of purification and further structure elucidation, e.g., by NMR (see below).
Recently, an on-line bioaffinity screening approach related to the acetylcholine binding protein (AChBP) was described [49]. AChBP is a relevant model protein for the family of nicotinic acetylcholine receptors, important receptors possibly involved in many brain-related diseases, for example Alzheimer’s and Parkinson’s disease, ADHD (attention deficit/hyperactivity disorder) and chronic pain-related disorders. The bioaffinity detection is based on a specially developed tracer ligand the fluorescence of which is enhanced in the binding pocket of the protein. A schematic representation of the on-line bioassay principle is given as inset in Fig. 2b. Parallel MS detection was performed next to a parallel dual bioassay, one to assess the bioaffinity of the eluting ligands and the other a “blank” bioassay performed to detect native fluorescence properties of eluting compounds. The objective of the bioassay was analysis of small focused medicinal chemistry-like libraries and it enabled estimation of pK i values of known compounds after injection at only one concentration, even for ligands in a mixture [49].
Bioassays with soluble receptors
HRS screening of mixtures for receptor affinity can be performed in different bioassay setups. For instance, a fluorescently labeled receptor can be used in conjunction with an immobilized affinity column at the end of the reaction coil, as used in antigen–antibody interactions (see above) [26] and in the screening of ligand mixtures for the urokinase receptor [50].
Alternatively, a homogeneous continuous-flow bioassay (without filtration or affinity column separation steps) can be used, as, for instance, demonstrated for estrogen receptor binding. In this case, fluorescence enhancement with the natural fluorescent estrogenic tracer ligand coumestrol is monitored [51]. Eluting ligands that displace coumestrol provide negative peaks on the baseline. Eventually, especially to increase sensitivity, a restricted access column can be used at the end of the reaction coils to remove the fluorescent non-receptor-bound coumestrol fraction from the solvent stream. As an alternative to fluorescence enhancement, detection based on fluorescence polarization (FP) has also been reported [52].
In an MS-based HRS setup, an estrogen receptor (ER) bioassay is especially interesting in the analysis of natural compounds such as phytoestrogens [27, 53], environmental samples, screening for endocrine-disrupting compounds [54] and metabolic mixtures, and profiling bioactive drug metabolites [55–57].
Various parts of the pomegranate fruit (Punica granatum; Punicaceae), e.g., juice, seed oil, and peel extract, have been shown to exert suppressive effects on human breast cancer cells in-vitro. A crude mixture of pomegranate peel extract was separated by HPLC followed by on-line bioaffinity analysis for the ER-β with parallel MS and MS–MS detection [53]. Three estrogenic compounds (luteolin, kaempferol, and quercetin) were detected and identified by comparing the molecular masses and negative-ion atmospheric-pressure chemical ionization (APCI) MS–MS spectra with data from an estrogenic compound library.
In order to efficiently assess the contribution of drug metabolites to the overall therapeutic and adverse effects, profiling of bioactive metabolites in metabolic mixtures is important in drug discovery. The power of HRS in this area was first demonstrated for metabolites of the nonsteroidal antiestrogen tamoxifen, used in the hormonal therapy of human breast cancer and, moreover, as a chemopreventive agent for women with an enhanced risk of developing breast cancer. Tamoxifen is known to be metabolized into multiple mono and dihydroxylated and N-demethylated derivatives, some of which have a much higher bioaffinity than tamoxifen itself. Metabolites in metabolic mixtures of tamoxifen were identified with simultaneous bioaffinity profiles for the ER-α [55]. For production of metabolic mixtures, incubations with microsomal liver fractions containing the most important cytochrome P450 isoenzymes involved in phase I metabolism are usually conducted. The results found were in accordance with many separate studies from the past, based on conventional screening directed at the bioaffinity of specific metabolites only. Subsequently, the HRS system was combined with parallel at-line bioreactors that enabled simultaneous metabolic CYP incubations of antiestrogenic drugs followed by on-line solid-phase extraction (SPE) trapping, washing, and elution to the HRS part of the system [54, 56]. As a result, metabolic schemes could be constructed, including bioaffinity information per metabolite.
Metabolic profiling with MS and MS–MS detection often does not lead to complete structure elucidation of the metabolites. HRS was therefore incorporated in a wider approach capable of efficiently profiling metabolites for their individual bioaffinity in combination with total structure elucidation by high resolution MS with an ion-trap–time-of-flight hybrid MS (IT-TOF), fractionation by preparative LC, and off-line NMR spectroscopy [57]. Dual parallel bioassays for ER-α and ER-β were included in the approach. Metabolites of known estrogenic drugs were generated using conventional CYP incubation (with human liver microsomes) and genetically engineered BM3 mutants (mutants of bacterial CYPs) [58, 59]. A typical HRS result obtained by use of this system is shown in Fig. 6. Bioactivity chromatograms from the parallel (dual) ER-α/ER-β bioassays are shown for metabolic mixtures (from human liver microsomes) of α-estradiol and β-estradiol injected at two concentrations. Finally, the bottom chromatograms show EIC traces from parallel MS detection of the mixture of α-estradiol metabolites.

As metabolism of drugs can result in the formation of pharmacologically active metabolites, it renders them essential for early consideration in drug discovery and development programs. The figure shows HRS analysis used to rapidly enable the identification of individual estrogenic ligands in metabolic mixtures with simultaneous detection of their biological activity. Shown are analyses of metabolic mixtures, injected at two different concentrations depicted as superimposed solid and dotted bioaffinity chromatograms, of α-estradiol and β-estradiol. Parallel analysis of bioaffinity towards two ER subtypes (α and β) gives selectivity information. The m/z traces of expected and unexpected metabolites are plotted at the bottom of the figure to enable retention time and peak shape correlation in order to correlate bioactivities with identities. The m/z traces of the mother compounds are not shown. The second-last bioactive peak is from α-estradiol and the last one (longest retention time) is from β-estradiol. Metabolism was from human liver microsomes
Bioassays for phosphate-related ligands or substrates
As already indicated, phosphorylation and de-phosphorylation processes, and formation and breakdown of cyclic phosphate molecules (e.g. cAMP and cGMP) are pivotal for most endogenous signaling processes [40].
An HRS system for detection of phosphodiesterase (PDE) inhibitors in natural extracts, based on the conversion of the fluorescent substrate Mant-cGMP (2′-O-(N-methylanthraniloyl)guanosine-3′,5′-cyclic monophosphate) into the highly fluorescent Mant-GMP was developed by Schenk at al. [22]. The applicability of the system was shown by analyzing a plant extract spiked with two PDE inhibitors. Quantification of the active compounds was by evaporative light-scattering detection, thus enabling estimation of the IC50 values of the bioactive compounds directly from the crude extract.
A generic on-line bioassay for phosphate-consuming or releasing enzymes was developed and applied to measurement of continuous phosphate release from alkaline phosphatase and to detection of tetramisole in a plant extract as an inhibitor of the enzyme [60]. A fluorophore-labeled phosphate-binding protein with strong fluorescence enhancement on binding to inorganic phosphate was used for readout, and parallel MS for confirmation of identity of the inhibitor.
In the vast majority of signaling pathways, protein kinases play pivotal roles in transmitting ligand-mediated signals by (de)phosphorylating proteins. Therefore, protein kinases are important targets for inhibition screening. The MAP kinase p38α (p38) is important in some types of cancer and inflammation processes and is regarded as a (potential) drug target. The development of an HRS system based on fluorescence enhancement in the (ATP) binding pocket of protein kinase p38 was demonstrated by Falck et al. [61]. Parallel MS enabled efficient correlation between bioaffinity for p38 kinase and identity of the inhibitor compounds.
Bioassays for proteases and peptidases
Proteases (and peptidases) are important in many biological processes, for example different hormonal processes in which cleavage of peptides or proteins changes the bioaffinity of proteins involved, in protein homeostasis of the body, and in many physiological reactions, from food digestion to blood-clotting and apoptosis. Various HRS approaches to assay protease activity or inhibition have been reported. In addition to the systems with direct MS readout, already discussed, systems with parallel MS have also been reported.
The angiotensin-converting enzyme (ACE) is an exopeptidase that is important in blood pressure regulation. An HRS system with parallel MS was developed for screening of ACE inhibitors [62]. Accurate-mass data, MS–MS fingerprints, and protein database search procedures were used to identify bioactive peptides found in mixtures, such as hydrolyzed milk samples, digests, or fermentation products.
HRS screening for inhibitors of serine proteases, based on a fluorescently labeled peptide tracer that yields increased fluorescence on cleavage was recently demonstrated [63]. In order to keep the modifier concentration in the bioassay constant during gradient elution, a counter gradient was used that was parked in a semi-preparative LC column.
For analysis of the proteolytic enzyme activity of individual proteases in mixtures, the on-line combination of size-exclusion LC and ion-exchange chromatography under non-denaturing conditions and a bioassay has been developed by Schebb et al. [64]. Bioassay readout by UV detection is based on the protease cleavage of a p-nitroaniline-labeled peptide, releasing the colored p-nitroaniline. The method was applied to the characterization of the crude venom of the pit viper Bothrops moojeni and extracts of the pathogenic amoeba Acanthamoeba castellanii. It is a tool for serine protease screening in general by fast ESI MS–MS identification of active samples followed by the separation and isolation of active sample constituents in on-line bioaffinity analysis mode.
Off-line and at-line bioaffinity analysis with parallel MS detection
Although a great variety of bioassays can be converted into HRS systems with parallel MS detection, HRS is not always feasible, for instance because of the bioassay conditions demanded. It is difficult, or impossible, to use the HRS approach for bioassays requiring poorly soluble constituents, membrane-bound targets, and/or very long incubation times. Although use of gas-segmented post-column systems to reduce post-column band broadening effects has been demonstrated [65], such an approach provides only a very limited extension of the incubation time. Also, cellular bioassays [66–68] are currently out of reach. Targets present at very low concentrations and targets that require indirect means of detection are cumbersome to analyze with HRS methods. In such cases, the use of off-line or at-line techniques, which are still capable of correlating bioaffinity/bioactivity and chemical information on bioactive compounds in a mixture, can be considered [29]. Some examples are reviewed in the next section.
Off-line bioaffinity analysis
In the conventional approach to bioaffinity or bioactivity screening, which involves fractionation of the column effluent and subsequent plate reader-based bioassays, often using fluorescence readouts [69], MS is increasingly recognized as a universal, label-free tool for monitoring enzymatic reactions [70, 71], or determining the affinity of small molecules for a target protein [72]. MS is, therefore, increasingly being used for off-line screening of small molecules. A fully integrated platform with online sample cleanup, capable of sampling rates as fast as ~5–10 s per sample, is the so-called “RapidFire” technology [73–75]. The method involves rapid SPE purifications from assays conducted in 96 or 384-well plates after incubation. Extracted substrate(s) and/or product(s) from the incubations are rapidly eluted from the SPE cartridge into a triple-quadrupole mass spectrometer in order to quantify the substrate and product [76]. Figure 7 shows a schematic overview of the technology in combination with some typical results from a well plate analyzed. Bioassays for the screening of CYP inhibition [77], antibacterial substances [78], and others [79, 80] have been reported. The advantages of such an approach are the possibility of measuring not only one formed product, or converted substrate, but basically both, or even multiple products in a label-free manner. Until now, the technology has only been applied to pure compound screening.

Left. Schematic view of a RapidFire system. Only a microtiter well plate, the switch valves used for the rapid SPE steps, and a mass spectrometer are shown. Right. Typical results shown for five of the (96 or 384) wells analyzed. In well C6, an inhibitor prevented product formation, which is shown as a lower product peak (SRM trace of product m/z) and a higher substrate peak (SRM trace of substrate m/z)
A more-or-less generic approach for protein kinase screening involves use of a Caliper microfluidics platform based on parallel capillary electrophoretic separations and detection by laser-induced fluorescence [81–84]. In theory, the microfluidics platform could be placed on-line with MS, enabling label-free screening.
Another interesting off-line screening approach is based on the MALDI Flash Quant technology, basically a MALDI triple-quadrupole system operated in SRM mode to overcome interferences from the MALDI matrix [85, 86]. This technology has been used to determine the binding of small molecules to the murine GABA (gamma-aminobutyric acid) receptor mGAT 1 [87], to determine the inhibition of protein kinase A (PKA) [88], and, in a multiplexed system, to investigate the enzyme activity of a kinase and an esterase in a single analysis [89].
At-line bioaffinity analysis
At-line bioaffinity screening combines the traditional fractionation approach with on-line bioaffinity analysis [29]. This technique involves mixing of the necessary biochemicals with the column effluent just before the fractionation process (Fig. 2c) and microfractionation, that is fractionation in a seconds rather than minutes time frame, to retain the high-resolution chromatographic separation. This enables correlation of the bioaffinity data with the chemical data from the MS which is positioned parallel to the microfractionator. As the bioassay is performed virtually off-line in 384 or 1536-well plates, free choices in incubation time, necessary biochemical additives, and readout formats can be made, because separation and incubation are independent. Moreover, drying and mixing issues are circumvented as the microtiter plates already contain the homogenous bioassay mixture with the fractionated compounds ready for incubation before plate reader-based bioaffinity analysis. Additional post-column splits in both on-line and at-line approaches can be used to run several biochemical assays in parallel. At-line bioaffinity screening has so far been demonstrated for screening of PKA inhibitors [29] and antibacterial substances [90]. In both cases, reconstructed high-resolution bioaffinity chromatograms could be plotted and compared with the MS chromatograms for bioaffinity-to-identity correlation. In the latter case, a regio-isomeric mixture of N-alkylated neomycin derivatives was separated, mixed with bacterial inoculum, incubated for 18 h, and, after addition of readout reagent, the antibacterial effect of the eluting substances was determined. Elucidation of the structures of the different (bioactive) regio-isomers could be accomplished by MSn analysis on an IT-TOF MS instrument.
Conclusions and perspectives
A wide variety of bioassay formats for different biological targets and assay types have been successfully transformed into on-line or at-line bioassays with direct coupling to separation for mixture analysis. Additional bioassay formats involve pre-column and on-column techniques. Although all these hyphenated screening approaches can rapidly deliver comprehensive bioaffinity information with correlated compound identities, one must remember that after identification of the bioactive compounds found, traditional approaches have to take over. The hyphenated screening approaches are not suited to subsequent purification and/or synthesis of the bioactive compounds. There are three other main reasons why traditional approaches must be used after HRS-based identification of bioactive compounds in mixtures. First, most research facilities are adapted to traditional and integrated workflows of analyzing pure compounds from the hit stage to the lead development phase. Second, advances in more traditional screening now even enable elaborate and comprehensive “high content” analysis of single compounds that hyphenated bioassay-analytical screening methods can not yet compete with. Third, traditional techniques are applicable to a wider range of assays, from easy ligand-binding bioassays to high-content cellular biological assays with multiple readouts. Nevertheless, as a first and important step in finding and identifying bioactive compounds, HRS and related techniques discussed in this paper can play an important role, especially in the dereplication of bioactive mixtures. When an HRS strategy has been developed, bioactive mixture profiling can be performed more rapidly and in a more convenient fashion. Drug target classes that are most conveniently incorporated in on-line screening processes are, for instance, nuclear receptors, protein kinases, proteases, phosphodiesterases, phosphatases, and metabolic enzymes. Enzymes that are able to rapidly convert substrates into fluorescent products and receptors for which ligands are available that show fluorescence enhancement in the binding pocket are most suitable in this regard. For other enzyme and receptor drug targets, on-line MS-based bioassays or at-line screening methods are good alternatives, e.g., for bioassay formats for which only native substrates or ligands are available, bioassays that demand long incubation times, and other difficult bioassay formats, for example those involving membrane-bound drug targets and cellular assay formats. Although it is difficult to directly incorporate on-line and at-line approaches in traditional drug-discovery processes, efficient incorporation is certainly possible with modifications.
In summary, on-line and at-line strategies used to profile bioactive mixtures provide powerful tools for mixture analysis, capable of rapidly and straightforwardly correlating bioaffinity with compound identity. They do, however, need some development time and effort per drug target to be screened for and flexibility in terms of implementation into traditional drug-discovery workflows.
Abbreviations
- Mant-cGMP:
-
2′-O-(N-methylanthraniloyl)guanosine-3′,5′-cyclic monophosphate
- AMC:
-
7-Amido-4-methylcoumarin
- AChE:
-
Acetylcholinesterase
- AChBP:
-
Acetylcholine binding protein
- ATP:
-
Adenosine triphosphate
- APCI:
-
Atmospheric pressure chemical ionization
- Z-FR:
-
CBZ–Phe–Arg
- CYPs:
-
Cytochromes p450
- cAMP:
-
Cyclic adenosine monophosphate
- cGMP:
-
Cyclic guanosine monophosphate
- ESI:
-
Electrospray ionization
- ER:
-
Estrogen receptor
- EIC:
-
Extracted-ion chromatogram
- IT TOF:
-
Ion-trap–time-of-flight hybrid MS
- GST:
-
Glutathione-S-transferase
- HPLC:
-
High-performance liquid chromatography
- HRS:
-
High-resolution screening
- HTS:
-
High-throughput screening
- MALDI:
-
Matrix-assisted laser-desorption ionization
- MS:
-
Mass spectrometry
- NMR:
-
Nuclear magnetic resonance spectroscopy
- PKA:
-
Protein kinase A
- SIM:
-
Selected-ion monitoring
- SRM:
-
Selected-reaction monitoring
- SPE:
-
Solid-phase extraction
References
Tammela P, Wennberg T, Vuorela H, Vuorela P (2004) HPLC micro-fractionation coupled to a cell-based assay for automated on-line primary screening of calcium antagonistic components in plant extracts. Anal Bioanal Chem 380(4):614–618
Phillipson DW, Milgram KE, Yanovsky AI, Rusnak LS, Haggerty DA, Farrell WP, Greig MJ, Xiong X, Proefke ML (2002) High-throughput bioassay-guided fractionation: a technique for rapidly assigning observed activity to individual components of combinatorial libraries, screened in HTS bioassays. J Comb Chem 4(6):591–599
Hewitt LM, Marvin CH (2005) Analytical methods in environmental effects-directed investigations of effluents. Mutat Res 589(3):208–232
Trubetskoy OV, Gibson JR, Marks BD (2005) Highly miniaturized formats for in vitro drug metabolism assays using vivid fluorescent substrates and recombinant human cytochrome P450 enzymes. J Biomol Screen 10(1):56–66
Reineke N, Bester K, Huhnerfuss H, Jastorff B, Weigel S (2002) Bioassay-directed chemical analysis of river Elbe surface water including large volume extractions and high performance fractionation. Chemosphere 47(7):717–723
Sreelatha T, Hymavathi A, Murthy JM, Rani PU, Rao JM, Babu KS Bioactivity-guided isolation of mosquitocidal constituents from the rhizomes of Plumbago capensis Thunb. Bioorg Med Chem Lett 20 (9):2974–2977
Dastmalchi K, Ollilainen V, Lackman P, GBa G, Dorman HJD, Järvinen PP, Yli-Kauhaluoma J, Hiltunen R (2009) Acetylcholinesterase inhibitory guided fractionation of Melissa officinalis L. Bioorg Med Chem 17(2):867–871
Mishra KP, Ganju L, Sairam M, Banerjee PK, Sawhney RC (2008) A review of high throughput technology for the screening of natural products. Biomed Pharmacother 62(2):94–98
Lam KS (2007) New aspects of natural products in drug discovery. Trends Microbiol 15(6):279–289
Mueller DR, Voshol H, Waldt A, Wiedmann B, Van Oostrum J (2007) LC–MALDI MS and MS/MS—an efficient tool in proteome analysis. Subcell Biochem 43:355–380
Yu S, Park JS, Paredes V, Song MC, Baek NI, Lee SI, Lim JS, Cho NY, Yoon J, Baek K (2010) Screening and isolation of a natural dopamine D1 receptor antagonist using cell-based assays. J Biotechnol 145(3):304–309
Nyila MA, Leonard CM, Hussein AA, Lall N (2009) Bioactivities of Plectranthus ecklonii constituents. Nat Prod Commun 4(9):1177–1180
Ebada SS, Edrada RA, Lin W, Proksch P (2008) Methods for isolation, purification and structural elucidation of bioactive secondary metabolites from marine invertebrates. Nat Protoc 3(12):1820–1831
Brack W, Klamer HJ, Lopez de Alda M, Barcelo D (2007) Effect-directed analysis of key toxicants in European river basins a review. Environ Sci Pollut Res Int 14(1):30–38
Brack W, Schmitt-Jansen M, Machala M, Brix R, Barcelo D, Schymanski E, Streck G, Schulze T (2008) How to confirm identified toxicants in effect-directed analysis. Anal Bioanal Chem 390(8):1959–1973
Schulze T, Weiss S, Schymanski E, von der Ohe PC, Schmitt-Jansen M, Altenburger R, Streck G, Brack W Identification of a phytotoxic photo-transformation product of diclofenac using effect-directed analysis. Environ Pollut 158 (5):1461–1466
Kuch B, Kern F, Metzger JW, von der Trenck KT Effect-related monitoring: Estrogen-like substances in groundwater. Environ Sci Pollut Res Int 17 (2):250–260
Kool J, Lingeman H, Niessen W, Irth H High throughput screening methodologies classified for major drug target classes according to target signaling pathways. Comb Chem High Throughput Screen 13 (6):548–561
Shi SY, Zhou HH, Zhang YP, Jiang XY, Chen XQ, Huang KL (2009) Coupling HPLC to on-line, post-column (bio)chemical assays for high-resolution screening of bioactive compounds from complex mixtures. Trends Anal Chem 28(7):865–877
Jonker N, Kool J, Irth H, Niessen WMA Recent developments in protein–ligand affinity mass spectrometry. Anal Bioanal Chem (In Press) doi: 10.1007/s00216-010-4350-z
Kool J, Eggink M, van Rossum H, van Liempd SM, van Elswijk DA, Irth H, Commandeur JN, Meerman JH, Vermeulen NP (2007) Online biochemical detection of glutathione-S-transferase P1-specific inhibitors in complex mixtures. J Biomol Screen 12(3):396–405
Schenk T, Breel GJ, Koevoets P, van den Berg S, Hogenboom AC, Irth H, Tjaden UR, van der Greef J (2003) Screening of natural products extracts for the presence of phosphodiesterase inhibitors using liquid chromatography coupled online to parallel biochemical detection and chemical characterization. J Biomol Screen 8(4):421–429
Kool J, van Liempd SM, Harmsen S, Beckman J, van Elswijk D, Commandeur JN, Irth H, Vermeulen NP (2007) Cytochrome P450 bio-affinity detection coupled to gradient HPLC: on-line screening of affinities to cytochrome P4501A2 and 2D6. J Chromatogr B Anal Technol Biomed Life Sci 858(1–2):49–58
Przyjazny A, Kjellstrom TL, Bachas LG (1990) High-performance liquid chromatographic postcolumn reaction detection based on a competitive binding system. Anal Chem 62(23):2536–2540
Przyjazny A, Hentz NG, Bachas LG (1993) Sensitive and selective liquid chromatographic postcolumn reaction detection system for biotin and biocytin using a homogeneous fluorophore-linked assay. J Chromatogr A 654(1):79–86
Irth H, Oosterkamp AJ, van der Welle W, Tjaden UR, van der Greef J (1993) On-line immunochemical detection in liquid chromatography using fluorescein-labeled antibodies. J Chromatogr 633:65–72
Schobel U, Frenay M, van Elswijk DA, McAndrews JM, Long KR, Olson LM, Bobzin SC, Irth H (2001) High resolution screening of plant natural product extracts for estrogen receptor alpha and beta binding activity using an online HPLC–MS biochemical detection system. J Biomol Screen 6(5):291–303
Irth H (2007) Continuous-flow systems for ligand binding and enzyme inhibition assays based on mass spectrometry. In: Wanner KT, Höfner G (eds) Mass spectrometry in medicinal chemistry: applications in drug discovery, vol 36. Wiley–VCH, Weinheim
Giera M, Heus F, Janssen L, Kool J, Lingeman H, Irth H (2009) Microfractionation revisited: a 1536 well high resolution screening assay. Anal Chem 81(13):5460–5466
Lutz ES, Irth H, Tjaden UR, van der Greef J (1996) Applying hollow fibres for separating free and bound label in continuous-flow immunochemical detection. J Chromatogr A 755(2):179–187
Schenk T, Molendijk A, Irth H, Tjaden UR, van der Greef J (2003) Liquid chromatography coupled on-line to flow cytometry for postcolumn homogeneous biochemical detection. Anal Chem 75(16):4272–4278
Mazereeuw M, de Best CM, Tjaden UR, Irth H, van der Greef J (2000) Free flow electrophoresis device for continuous on-line separation in analytical systems. An application in biochemical detection. Anal Chem 72(16):3881–3886
Oosterkamp AJ, Irth H, Tjaden UR, van der Greef J (1997) Theoretical concepts of on-line liquid chromatographic–biochemical detection systems. II. Detection systems based on labeled affinity proteins. J Chromatogr A 787(1–2):37–46
Oosterkamp AJ, Irth H, Villaverde Herraiz MT, Tjaden UR, van der Greef J (1997) Theoretical concepts of on-line liquid chromatographic–biochemical detection systems. I. Detection systems based on labeled ligands. J Chromatogr A 787(1–2):27–35
Hogenboom AC, de Boer AR, Derks RJ, Irth H (2001) Continuous-flow, on-line monitoring of biospecific interactions using electrospray mass spectrometry. Anal Chem 73(16):3816–3823
Derks RJ, Hogenboom AC, van der Zwan G, Irth H (2003) On-line continuous-flow, multi-protein biochemical assays for the characterization of bioaffinity compounds using electrospray quadrupole time-of-flight mass spectrometry. Anal Chem 75(14):3376–3384
de Boer AR, Letzel T, van Elswijk DA, Lingeman H, Niessen WM, Irth H (2004) On-line coupling of high-performance liquid chromatography to a continuous-flow enzyme assay based on electrospray ionization mass spectrometry. Anal Chem 76(11):3155–3161
Kool J, Vermeulen NPE, Lingeman H, Derks RJE, Irth H (2008) Affinity interaction profiling of protein–protein and protein–ligand interactions using flow analysis. In: Trojanowicz M (ed) Advances in flow analysis. Wiley–VCH, Weinheim
de Jong CF, Derks RJ, Bruyneel B, Niessen W, Irth H (2006) High-performance liquid chromatography–mass spectrometry-based acetylcholinesterase assay for the screening of inhibitors in natural extracts. J Chromatogr A 1112(1–2):303–310
Thingholm TE, Jensen ON, Larsen MR (2009) Analytical strategies for phosphoproteomics. Proteomics 9(6):1451–1468
Krabbe JG, Lingeman H, Niessen WM, Irth H (2003) Ligand-exchange detection of phosphorylated peptides using liquid chromatography electrospray mass spectrometry. Anal Chem 75(24):6853–6860
Krabbe JG, Gao F, Li J, Ahlskog JE, Lingeman H, Niessen WM, Irth H (2006) Selective detection and identification of phosphorylated proteins by simultaneous ligand-exchange fluorescence detection and mass spectrometry. J Chromatogr A 1130(2):287–295
de Boer AR, Alcaide-Hidalgo JM, Krabbe JG, Kolkman J, van Emde Boas CN, Niessen WM, Lingeman H, Irth H (2005) High-temperature liquid chromatography coupled on-line to a continuous-flow biochemical screening assay with electrospray ionization mass spectrometric detection. Anal Chem 77(24):7894–7900
de Boer AR, Bruyneel B, Krabbe JG, Lingeman H, Niessen WM, Irth H (2005) A microfluidic-based enzymatic assay for bioactivity screening combined with capillary liquid chromatography and mass spectrometry. Lab Chip 5(11):1286–1292
Ingkaninan K, de Best CM, van der Heijden R, Hofte AJ, Karabatak B, Irth H, Tjaden UR, van der Greef J, Verpoorte R (2000) High-performance liquid chromatography with on-line coupled UV, mass spectrometric and biochemical detection for identification of acetylcholinesterase inhibitors from natural products. J Chromatogr A 872(1–2):61–73
Ingkaninan K, Hazekamp A, de Best CM, Irth H, Tjaden UR, van der Heijden R, van der Greef J, Verpoorte R (2000) The application of HPLC with on-line coupled UV/MS-biochemical detection for isolation of an acetylcholinesterase inhibitor from narcissus 'Sir Winston Churchill'. J Nat Prod 63(6):803–806
Rhee IK, Appels N, Luijendijk T, Irth H, Verpoorte R (2003) Determining acetylcholinesterase inhibitory activity in plant extracts using a fluorimetric flow assay. Phytochem Anal 14(3):145–149
Marques LA, Kool J, de Kanter F, Lingeman H, Niessen W, Irth H Production and on-line acetylcholinesterase bioactivity profiling of chemical and biological degradation products of tacrine. J Pharm Biomed Anal 53 (3):609–616
Kool J, de Kloe GE, Bruyneel B, de Vlieger JS, Retra K, Wijtmans M, van Elk R, Smit AB, Leurs R, Lingeman H, de Esch IJ, Irth H Online fluorescence enhancement assay for the acetylcholine binding protein with parallel mass spectrometric identification. J Med Chem 53 (12):4720–4730
Oosterkamp AJ, van der Hoeven R, Glassgen W, Konig B, Tjaden UR, van der Greef J, Irth H (1998) Gradient reversed-phase liquid chromatography coupled on-line to receptor-affinity detection based on the urokinase receptor. J Chromatogr B Biomed Sci Appl 715(1):331–338
Oosterkamp AJ, Villaverde Herraiz MT, Irth H, Tjaden UR, van der Greef J (1996) Reversed-phase liquid chromatography coupled on-line to receptor affinity detection based on the human estrogen receptor. Anal Chem 68(7):1201–1206
Reinen J, Kool J, Vermeulen NP (2008) Reversed-phase liquid chromatography coupled on-line to estrogen receptor bioaffinity detection based on fluorescence polarization. Anal Bioanal Chem 390(8):1987–1998
van Elswijk DA, Schobel UP, Lansky EP, Irth H, van der Greef J (2004) Rapid dereplication of estrogenic compounds in pomegranate (Punica granatum) using on-line biochemical detection coupled to mass spectrometry. Phytochemistry 65(2):233–241
Van Liempd SM, Kool J, Meerman JH, Irth H, Vermeulen NP (2007) Metabolic profiling of endocrine-disrupting compounds by on-line cytochrome P450 bioreaction coupled to on-line receptor affinity screening. Chem Res Toxicol 20(12):1825–1832
Kool J, Ramautar R, van Liempd SM, Beckman J, de Kanter FJ, Meerman JH, Schenk T, Irth H, Commandeur JN, Vermeulen NP (2006) Rapid on-line profiling of estrogen receptor binding metabolites of tamoxifen. J Med Chem 49(11):3287–3292
van Liempd SM, Kool J, Niessen WM, van Elswijk DE, Irth H, Vermeulen NP (2006) On-line formation, separation, and estrogen receptor affinity screening of cytochrome P450-derived metabolites of selective estrogen receptor modulators. Drug Metab Dispos 34(9):1640–1649
de Vlieger JS, Kolkman AJ, Ampt KA, Commandeur JN, Vermeulen NP, Kool J, Wijmenga SS, Niessen WM, Irth H, Honing M (2010) Determination and identification of estrogenic compounds generated with biosynthetic enzymes using hyphenated screening assays, high resolution mass spectrometry and off-line NMR. J Chromatogr B Anal Technol Biomed Life Sci 878:667–674
Stjernschantz E, van Vugt-Lussenburg BM, Bonifacio A, de Beer SB, van der Zwan G, Gooijer C, Commandeur JN, Vermeulen NP, Oostenbrink C (2008) Structural rationalization of novel drug metabolizing mutants of cytochrome P450 BM3. Proteins 71(1):336–352
Damsten MC, de Vlieger JS, Niessen WM, Irth H, Vermeulen NP, Commandeur JN (2008) Trimethoprim: novel reactive intermediates and bioactivation pathways by cytochrome P450s. Chem Res Toxicol 21(11):2181–2187
Schenk T, Appels NM, van Elswijk DA, Irth H, Tjaden UR, van der Greef J (2003) A generic assay for phosphate-consuming or -releasing enzymes coupled on-line to liquid chromatography for lead finding in natural products. Anal Biochem 316(1):118–126
Falck D, de Vlieger JSB, Niessen WMA, Kool J, Honing M, Giera M, Irth H (2010) Development of an online p38α mitogen-activated protein kinase binding assay and integration of LC–HR-MS. Anal Bioanal Chem 398(4):1771–1780
van Elswijk DA, Diefenbach O, van der Berg S, Irth H, Tjaden UR, van der Greef J (2003) Rapid detection and identification of angiotensin-converting enzyme inhibitors by on-line liquid chromatography–biochemical detection, coupled to electrospray mass spectrometry. J Chromatogr A 1020(1):45–58
Schebb NH, Heus F, Saenger T, Karst U, Irth H, Kool J (2008) Development of a countergradient parking system for gradient liquid chromatography with online biochemical detection of serine protease inhibitors. Anal Chem 80(17):6764–6772
Schebb NH, Vielhaber T, Jousset A, Karst U (2009) Development of a liquid chromatography-based screening methodology for proteolytic enzyme activity. J Chromatogr A 1216(20):4407–4415
Fabel S, Niessner R, Weller MG (2005) Effect-directed analysis by high-performance liquid chromatography with gas-segmented enzyme inhibition. J Chromatogr A 1099(1–2):103–110
Thomsen W, Frazer J, Unett D (2005) Functional assays for screening GPCR targets. Curr Opin Biotechnol 16(6):655–665
Renard D, Perruchon J, Giera M, Muller J, Bracher F (2009) Side chain azasteroids and thiasteroids as sterol methyltransferase inhibitors in ergosterol biosynthesis. Bioorg Med Chem 17(23):8123–8137
Zheng W, Spencer RH, Kiss L (2004) High throughput assay technologies for ion channel drug discovery. Assay Drug Dev Technol 2(5):543–552
Marques LA, Giera M, de Kanter FJJ, Niessen WMA, Lingeman H, Irth H Photohuperzine A—a new photoisomer of huperzine A: Structure elucidation, formation kinetics and activity assessment. J Pharm Biomed Anal 52 (2):190–194
Liesener A, Karst U (2005) Monitoring enzymatic conversions by mass spectrometry: a critical review. Anal Bioanal Chem 382(7):1451–1464
Letzel T (2008) Real-time mass spectrometry in enzymology. Anal Bioanal Chem 390(1):257–261
Christine Z, Georg H, Klaus TW (2006) MS-binding assays: Kinetic, saturation, and competitive experiments based on quantitation of bound marker as exemplified by the GABA transporter mGAT1. ChemMedChem 1(2):208–217
Quercia AK, LaMarr WA, Myung J, Ozbal CC, Landro JA, Lumb KJ (2007) High-throughput screening by mass spectrometry: comparison with the scintillation proximity assay with a focused-file screen of AKT1/PKB alpha. J Biomol Screen 12(4):473–480
Jonas M, LaMarr WA, Ozbal C (2009) Mass spectrometry in high-throughput screening: a case study on acetyl-coenzyme a carboxylase using RapidFire–mass spectrometry (RF-MS). Comb Chem High Throughput Screen 12(8):752–759
Holt TG, Choi BK, Geoghagen NS, Jensen KK, Luo Q, LaMarr WA, Makara GM, Malkowitz L, Ozbal CC, Xiong Y, Dufresne C, Luo MJ (2009) Label-free high-throughput screening via mass spectrometry: a single cystathionine quantitative method for multiple applications. Assay Drug Dev Technol 7(5):495–506
Ozbal CC, LaMarr WA, Linton JR, Green DF, Katz A, Morrison TB, Brenan CJH (2004) High throughput screening via mass spectrometry: a case study using acetylcholinesterase. Assay Drug Dev Technol 2(4):373–382
Lim KB, Ozbal CC, Kassel DB (2010) Development of a high-throughput online solid-phase extraction/tandem mass spectrometry method for cytochrome P450 inhibition screening. J Biomol Screen 15(4):447–452
Langsdorf EF, Malikzay A, Lamarr WA, Daubaras D, Kravec C, Zhang R, Hart R, Monsma F, Black T, Ozbal CC, Miesel L, Lunn CA (2010) Screening for antibacterial inhibitors of the UDP-3-O-(R-3-hydroxymyristoyl)-N-acetylglucosamine deacetylase (LpxC) using a high-throughput mass spectrometry assay. J Biomol Screen 15(1):52–61
Soulard P, McLaughlin M, Stevens J, Connolly B, Coli R, Wang L, Moore J, Kuo M-ST, LaMarr WA, Ozbal CC, Bhat BG (2008) Development of a high-throughput screening assay for stearoyl-CoA desaturase using rat liver microsomes, deuterium labeled stearoyl-CoA and mass spectrometry. Anal Chim Acta 627(1):105–111
Forbes CD, Toth JG, Ã-zbal CC, Lamarr WA, Pendleton JA, Rocks S, Gedrich RW, Osterman DG, Landro JA, Lumb KJ (2007) High-throughput mass spectrometry screening for inhibitors of phosphatidylserine decarboxylase. J Biomol Screen 12(5):628–634
Blackwell LJ, Birkos S, Hallam R, Van De Carr G, Arroway J, Suto CM, Janzen WP (2009) High-throughput screening of the cyclic AMP-dependent protein kinase (PKa) using the Caliper microfluidic platform. Methods Mol Biol 565:225–237
Card A, Caldwell C, Min H, Lokchander B, Hualin X, Sciabola S, Kamath AV, Clugston SL, Tschantz WR, Leyu W, Moshinsky DJ (2009) High-throughput biochemical kinase selectivity assays: panel development and screening applications. J Biomol Screen 14(1):31–42
Perrin D, Fremaux C, Scheer A (2006) Assay development and screening of a serine/threonine kinase in an on-chip mode using Caliper nanofluidics technology. J Biomol Screen 11(4):359–368
Dunne J, Reardon H, Trinh V, Li E, Farinas J (2004) Comparison of on-chip and off-chip microfluidic kinase assay formats. Assay Drug Dev Technol 2(2):121–129
Corr JJ, Kovarik P, Schneider BB, Hendrikse J, Loboda A, Covey TR (2006) Design considerations for high speed quantitative mass spectrometry with MALDI ionization. J Am Soc Mass Spectrom 17(8):1129–1141
Gobey J, Cole M, Janiszewski J, Covey T, Chau T, Kovarik P, Corr J (2005) Characterization and performance of MALDI on a triple quadrupole mass spectrometer for analysis and quantification of small molecules. Anal Chem 77(17):5643–5654
Georg H, Dietrich M, Klaus Theodor W (2009) MS binding assays—with MALDI toward high throughput. ChemMedChem 4(9):1523–1528
Rathore R, Corr J, Scott G, Vollmerhaus P, Greis KD (2008) Development of an inhibitor screening platform via mass spectrometry. J Biomol Screen 13(10):1007–1013
Rathore R, Pribil P, Corr JJ, Seibel WL, Evdokimov A, Greis KD (2010) Multiplex enzyme assays and inhibitor screening by mass spectrometry. J Biomol Screen 15(8):1001–1007
Giera M, de Vlieger JS, Lingeman H, Irth H, Niessen WM Structural elucidation of biologically active neomycin n-octyl derivatives in a regioisomeric mixture by means of liquid chromatography/ion trap time-of-flight mass spectrometry. Rapid Commun Mass Spectrom 24 (10):1439–1446
Open Access
This article is distributed under the terms of the Creative Commons Attribution Noncommercial License which permits any noncommercial use, distribution, and reproduction in any medium, provided the original author(s) and source are credited.
Author information
Authors and Affiliations
Corresponding author
Additional information
Published in the special issue on Advances in Analytical Mass Spectrometry with Guest Editor Maria Careri
Rights and permissions
Open Access This is an open access article distributed under the terms of the Creative Commons Attribution Noncommercial License (https://creativecommons.org/licenses/by-nc/2.0), which permits any noncommercial use, distribution, and reproduction in any medium, provided the original author(s) and source are credited.
About this article
Cite this article
Kool, J., Giera, M., Irth, H. et al. Advances in mass spectrometry-based post-column bioaffinity profiling of mixtures. Anal Bioanal Chem 399, 2655–2668 (2011). https://doi.org/10.1007/s00216-010-4406-0
Received:
Revised:
Accepted:
Published:
Issue Date:
DOI: https://doi.org/10.1007/s00216-010-4406-0