Autonomous cars are considered to be the next disruptive innovation that will affect consumers. It can be expected that not only traditional automakers will enter this market (e.g., Ford) but also technology companies (e.g., Google) and newer companies dedicated to self-driving cars (e.g., Tesla). We take a brand extension perspective and analyze to what extent consumers prefer autonomous cars from these brand categories. Our empirical study is based on discrete choice experiments about adopting autonomous vehicles in a purchase scenario and in a renting context. Our findings show that brands play a central role when making autonomous driving decisions. Brand preferences differ systematically when buying versus renting a self-driving car. While technology brands are most preferred overall, consumers favor automaker brands over new brands only when purchasing, not when renting. We further disentangle the brand strength into the marginal effects of image associations. For example, Google’s strong brand positioning can be explained by experiences with the parent brand, but it could still improve brand strength by highlighting the relevance of the associated brand portfolio for self-driving cars. The effect of these brand extension success factors differs between parent-brand categories and also between the renting and purchasing scenarios, which requires a dedicated brand management.
Hinweise
Publisher's Note
Springer Nature remains neutral with regard to jurisdictional claims in published maps and institutional affiliations.
1 Introduction
Following the increasing adoption of electric vehicles (Eggers & Eggers, 2011), technology surrounding autonomous driving is progressing at a fast pace. Self-driving cars use artificial intelligence (AI) to navigate a car and require no or a minimum of user input. This disruptive innovation represents a potentially attractive new market for firms. However, it has been shown that consumers have reservations towards AI in general, particularly if it involves consequential tasks such as steering a car (Davenport et al., 2020). We take a branding perspective to analyze this new market as brands play a central role in increasing trust and reducing uncertainty for consumers. The effect of brands has not been analyzed yet in the literature surrounding AI research in general (Davenport et al., 2020), let alone autonomous vehicles (Gkartzonikas & Gkritza, 2019). In fact, any marketing-related findings about self-driving cars are scarce.
Firms frequently apply a brand extension strategy when entering new markets in order to leverage existing (parent) brand equity (Völckner & Sattler, 2006). Previous research about brand extensions focuses primarily on incremental innovations or extensions into a category with established incumbents. Not much research exists about brand extensions for radical innovations such as autonomous cars. One aspect that makes radical innovations special is that firms do not know with whom they need to compete as there are no incumbents. Brands may expect intense competition on the autonomous vehicle market because not only traditional automakers will enter the market (e.g., Ford) but also technology companies (e.g., Google) and newer companies with a specific focus on self-driving cars (e.g., Tesla). Analyzing brand extensions in this competitive context is important as it leads to more realistic brand evaluations (Kapoor & Heslop, 2009) and provides an overview of the brands’ relative strengths and weaknesses.
Anzeige
We contribute empirically to this research stream. We summarize multiple drivers of brand extension success from recent studies and incorporate them into a discrete choice model. We conduct choice-based conjoint experiments about autonomous cars in a purchase scenario (i.e., product extensions) and a renting scenario (i.e., service extensions). A renting scenario next to the purchase scenario is interesting in this research context because renting a car lowers the entry costs and makes autonomous driving more affordable to a general public. The renting scenario also accounts for the evolving “sharing economy,” in which consumers do not purchase cars but rent one temporarily, which is ideally suited for autonomous cars that are able to autonomously drive to the renter when needed (Krueger et al., 2016). Apart from contrasting these two scenarios, we also differentiate the results for parent brands originating from different industries.
To summarize, we aim to answer the main research questions which brands are preferred on the market for autonomous vehicles and which image associations contribute most to brand strength. We address two subquestions aiming at the moderating role of (1) the rental vs. purchase market and (2) the parent brand type (automobiles, technology, or specialized companies).
By addressing these questions, our study makes several contributions: First, this is one of the first empirical applications in marketing that focuses specifically on autonomous cars. Existing research originates primarily from the transportation literature (Gkartzonikas & Gkritza, 2019) or addresses legal, ethical, or social conflicts of autonomous systems (e.g., Bonnefon et al., 2016).
Second, the literature on brand extensions focuses primarily on fast-moving consumer goods (FMCG) and rather incremental innovations. By applying the brand extension framework to radical innovations and differentiating the findings for product and service extensions as well as different parent brand types, we generate additional insights into brand extension success drivers.
Anzeige
Third, we also contribute to the AI literature. While previous research has shown that consumers are hesitant to adopt AI services (Davenport et al., 2020), we demonstrate that consumers largely consider AI in branded autonomous vehicles. Brands play a central role in this decision. For example, a self-driving car by Tesla would be considered twice as often as an autonomous vehicle from an unknown brand.
Overall, we show that brand preferences differ systematically when buying versus renting a self-driving car. While, on average, technology brands are strongest when renting or purchasing an autonomous car, automaker brands are only preferred over new and specialized brands in purchase contexts, not in rental markets. Moreover, the new, specialized brand Tesla is the overall most preferred option, indicating that brand perceptions beyond the brand category play an important role. Our findings allow to disentangle the brand strength into the effects of brand image associations. As such, Google’s positioning can be explained by experiences with the parent brand, but it could still improve brand strength by highlighting the relevance of the associated brand portfolio for self-driving cars. We believe these findings could generate an impulse to further explore the role of brands in AI research and allow managers to diagnose what brand associations are most influential for creating brand strength and how to differentiate the brand from competitors.
2 Brand extension drivers
In order to generate an overview of research on brand extension success drivers, we based our literature search on Völckner and Sattler’s (2006) empirical analysis that investigated the significance and relative importance of a large set of variables. The authors found that fit between the parent brand and the extension product is the most important determinant of brand extension success, followed by marketing support, parent-brand conviction, retailer acceptance, and parent-brand experience.
In order to check to what extent these results were supported in following research, we further analyzed brand extension studies that refer to Völckner and Sattler (2006). We identified 18 manuscripts listed in Table 1. This list is not a comprehensive overview of all brand extension research. We use it to indicate in which fields the identified success factors were replicated.
Table 1
Literature review
Authors
Year
PBQ
PBC
PBE
PB-OC
PF
BEM
BEH
RA
PR
CI
Product category (Parent Brand)
Other variables
Albrecht et al
2013
√
ns
√
Luxury and non-luxury fashion brands
√ Consumers’ category involvement
Dens & De Pelsmacker
2010
√
√
√
FMCG, consumer electronics
Advertising strategies as moderator
Estes et al
2012
√
Wide variety from TippingSprung surveys
√ Taxonomic similarity, √ thematic similarity (both components of fit)
Gierl & Huettl
2011
√
√
√
FMCG
Hem et al
2014
√
√
(√)
FMCG, automobile, telecommunication
√ Attitude toward the extension category, √ Awareness set size
Construal level a moderator of the relationship between perceived fit and brand extension evaluations
Meyvis et al
2012
√
√
FMCG, sports wear
Relative importance of fit and quality is influenced by the presence of visual information and the availability of comparison brands (for empirical study design)
Milberg et al
2010
√
Consumer electronics, sports wear
Familiarity with competitor brands as moderator
Monga & Gürhan-Canli
2012
√
FMCG, consumer electronics, automobile
Mating mind-sets moderate fit perceptions of brand extensions
Monga & John
2010
√
√
√
Automobile, consumer electronics
Thinking style (analytic vs. holistic) moderates brand extension and fit evaluations
Rühle et al
2017
(√)
√
ns
√
FMCG
√ Fit between the consumer and the extension product
Sattler et al
2010
√
√
ns
√
ns
FMCG
Brand extension brand premium as additional DV
Shen et al
2011
√
√
Luxury watches
Case-based reminding supports fit and brand extension attitude
(ns) quality uncertainty in the extension’s product category, (√) marketing power of the company
Völckner et al
2010
(√)
√
Service industries
(√) Interaction quality of the parent brand, √ physical environment quality of the parent brand, √ outcome quality of the parent brand; DVs: interaction quality of the extension, physical environment quality of the extension, outcome quality of the extension
Völckner & Sattler
2006
√
√
ns
ns
√
√
(√)
√
√
√
FMCG
several moderation and mediation effects
DV: attitude toward brand extension (if not stated otherwise); IVs: PBQ, Parent Brand Quality; PBC, Parent Brand Conviction; PBE, Parent Brand Experience; PB-OC, linkage of the utility of the parent brand to attributes of the original product category; PF, Product Fit; BEM, Brand Extension Marketing Support; BEH, Brand Extension History; RA, Retailer Acceptance; PR, Perceived Risk; CI, Consumer Innovativeness; √, significant relationship; (√), significant relationship for some categories; ns, not significant
Most studies confirm the results from Völckner and Sattler (2006). The majority of them (11 of 18) focus on FMCG. Three of the studies look at the automobile sector, which is related to our research context: Hem et al. (2014) analyze hypothetical brand extensions of Ford into bicycles, motorcycles, and lawnmowers. Monga and Gürhan-Canli (2012) use a hypothetical example of automobile brands (BMW vs. Honda) launching sunglass brands. Monga and John (2010) study a hypothetical automobile brand extension of launching a wallet brand (Mercedes-Benz vs. Toyota). These three studies only use a small subset of Völckner and Sattler’s (2006) ten brand extension variables and, although they use automobile brands, focus on brand extension categories that are not automobile-related and do not focus on radical innovations.
Although radical innovations typically create a high amount of perceived consumer uncertainty and brands can help mitigate uncertainty, it is surprising that research about this intersection is relatively sparse (Brexendorf et al., 2015). One of the few studies is Lee et al. (2016) that shows that medium levels of brand and innovation orientations increase brand performance. High levels of brand orientation, i.e., strictly adhering to the core brand identity, can prevent firms from innovating. At the same time, high levels of innovativeness can be detrimental to the development of a strong brand with a clear and consistent brand image. Hence, it is not possible to conclude that overall brand strength or innovativeness of a company can be used to infer which brand exhibits a competitive advantage on the autonomous car market. Therefore, we identified additional research that is not based on Völckner and Sattler (2006) but focuses specifically on brand extensions to radical innovations. Butcher et al. (2018), Beverland et al. (2010), Truong et al. (2017), and Gronhaug et al. (2002) investigate success factors of radically innovative brand extensions. Most of them use a variation of Völckner and Sattler’s (2006) brand extension success factors. Butcher et al. (2018) highlight an additional variable: Brand extension authenticity, which assesses whether the brand is true to itself, maintaining its essential core, and whether the brand is what it appears to be, not counterfeit or exaggerated (Brown et al., 2003; Grayson & Martinec, 2004).
In the following, we test the set of Völckner and Sattler’s (2006) brand extension variables in the context of autonomous cars. We do not integrate retailer acceptance of the brand extension since it does not apply to autonomous vehicles. Given the consistent finding of the importance of fit and following Völckner and Sattler’s call for further research about this driver (p. 31), we decided to explore fit in more detail and differentiate between product fit and capability fit, i.e., the perceived capability of the parent brand to create self-driving cars. We also include image fit as it relates to brand extension authenticity that we expect to play a role for radical innovations such as autonomous cars.
3 Research design
3.1 Procedure
To answer our research questions, we work with a survey that first collects demographic data and then asks about brand perceptions by presenting all image dimensions that relate to the parent brand and are independent of autonomous cars. Thereafter, the survey introduces the research context of autonomous cars and presents image associations relating to the extension product. Afterwards, the survey allocates respondents randomly to either a rental or a purchase scenario and presents the discrete choice experiment.
3.2 Brands and brand image measurement
We integrated nine brands that were nested in three brand categories. Specifically, we used three technology brands (Google, Microsoft, Apple), three traditional automobile brands (Ford, Chrysler, Chevrolet), and three new companies in this product category (Tesla, Uber, Robocab). We employed the fictitious brand Robocab as a benchmark with no brand value (Keller, 1993). We picked US brands only in order to mitigate brand image effects that are affected by country of origin.
We collected brand image associations for the nine brands using a pick-any procedure (Sonnier & Ainslie, 2011). The procedure instructs respondents to select all brands (if any) that they associate with a certain image dimension. Sonnier and Ainslie (2011) use this approach in a similar research context about midsized sedans. Specifically, we integrated the brand image dimensions identified by the literature review in Sect. 2. As a caveat, we had to use single item measures for all constructs in order to reduce the length of the questionnaire. This limits us in measuring the full scope of the constructs. Accordingly, instead of measuring conviction, we only account for trust. Similarly, we measure the history of brand extensions as size of the brand portfolio. As we are researching future brand extensions, we cannot account for (the indirect nature of) marketing support but rely on consumer expectations about the marketing support. Appendix Table 4 shows an overview of the measures.
Consistent to Völckner and Sattler (2006), we also measure innovativeness of the consumer and perceived risk, or rather its single item measure of perceived uncertainty (using a 7-point rating scale). Since innovativeness and uncertainty are consumer character traits and are not brand-specific we control for them in our choice models as moderators.
3.3 Discrete choice experiment
To provide a setting for the choice experiment, we presented a scenario in the year 2025 when autonomous driving technology will be more advanced (van Doorn et al., 2017). In the rental scenario, we informed the participants that they should imagine going on vacation and need to rent a car. In the purchase scenario, respondents were instructed to imagine that they are planning to buy a new car.
The experiment varied three attributes, i.e., brand, level of autonomy, and price. We included the nine brands outlined in the previous chapter (Google, Microsoft, Apple, Ford, Chrysler, Chevrolet, Tesla, Uber, Robocab).
We integrated level of autonomy using two levels (and respective descriptions): Partially self-driving (advanced driver assistance and autopilot, keeps a car in its lane and allows for automatic breaking and cruise control) and fully self-driving (no driver input required from start to destination). These levels correspond to level 2 and level 5 defined by the National Highway Traffic Safety Administration and Society of Automotive Engineers.
We varied price per hour in the rental scenario from $10 to $20 with $2 intervals (as a benchmark, we presented a manually driven car that was kept fixed at $10 per hour). In the purchase scenario, we used relative prices compared to a manually driven car to keep the setup flexible regarding different price segments. Specifically, we applied six prices ranging from the same price as a manually driven car to $10,000 more at $2000 increments. Apart from these varied features, we used ceteris paribus instructions and informed the participants that the cars are similar in other attributes that are not mentioned (e.g., size; Eggers et al., 2016).
We presented three autonomous cars per choice set and added the manually driven car in a dual response task. The dual response task asked if the respondent would actually use the chosen self-driving car or, instead, preferred the manually driven car (Wlömert & Eggers, 2016). We treated the decision in the dual response task as an implied fourth alternative in the estimation. We employed eleven choice tasks in total using a randomized choice design that controlled for balance, orthogonality, and minimal overlap. An exemplary choice task for each scenario is presented in Appendix Fig. 2.
3.4 Sample
We invited respondents to our survey via Prolific in 2019. We targeted US consumers who are 18 years or older and hold a driver’s license. Participants who completed the study were rewarded with $1.50 (this amount converts to an hourly rate of $10). In total, 551 respondents completed the survey, 255 in the rental, and 296 in the purchase scenario.1
The sample is slightly skewed towards females (54% female, 46% male). Compared to US Census data (Howden & Meyer, 2011), relatively more young consumers have answered the survey with 20.3% being in the age bracket 18–24 years, 37.4% are 25–34 years, 20.5% range between 35 and 44 years, 11.6% are 45–54 years, and 10.1% being 55 or older. This younger sample is appropriate in our research context as it makes a relevant target group in our assumed future scenario. Most respondents were from the South of the USA (32.3%), followed by consumers from the Northeast (23.0%), Midwest (21.4%), and West (20.3%). A small share (2.9%) currently resides outside of the USA.
Table 2 shows how often respondents associated a brand with a specific image dimension. Associations vary strongly within and across brands. As expected, the fictitious brand Robocab has the lowest associations. However, some consumers do associate the brand with certain dimensions as also the newness of a brand can invoke image associations. Although some brand extension drivers are correlated (a maximum correlation of 0.53 between capability fit and image fit), multicollinearity is not critical. The maximum VIF score is 2.77 for parent brand experience in the rental scenario (see Appendix Table 5 for details).
Table 2
Average brand image associations per brand
Google
Microsoft
Apple
Ford
Chrysler
Chevrolet
Tesla
Uber
Robocab
PB Quality
82%
76%
85%
45%
35%
44%
78%
26%
1%
PB Trust
55%
52%
48%
35%
21%
32%
36%
16%
1%
PB Experience
98%
92%
71%
27%
6%
18%
6%
48%
0%
PB-OC Linkage
61%
69%
60%
79%
71%
76%
57%
62%
2%
BE EMS
72%
49%
66%
50%
38%
44%
73%
30%
12%
Brand Portfolio
93%
92%
91%
52%
41%
47%
26%
19%
0%
Capability Fit
70%
50%
55%
60%
45%
51%
87%
18%
7%
Product Fit
47%
19%
20%
29%
24%
24%
84%
31%
10%
Image Fit
51%
30%
44%
33%
24%
27%
79%
17%
5%
4 Results
4.1 Model
We model consumer \(i\)’s choices among the \(J\) options in the choice tasks as probabilities \({P}_{ij}\) using a multinomial logit model: \({P}_{ij}={e}^{\gamma ({V}_{ij})}/{\sum }_{j=1}^{J}{e}^{\gamma ({V}_{ij})}\). In this model, \({V}_{ij}\) represents consumer \(i\)’s systematic utility for option \(j\), with \(j=1, 2, 3\) indicating experimentally varied autonomous cars and \(j=4\) referring to the no-choice option.2 We normalize the scaling parameter \(\gamma\) to 1 because it cannot be identified independently from the utilities (Hauser et al., 2019).
We formulate four alternative models for the systematic utility. In the base model, we only consider partworth utilities \(\beta\) of the main effects, i.e., level of autonomy \({a}_{j}\), price \({p}_{j}\), and the no-choice option \({o}_{j}\). For the brand, we differentiate the contribution of the parent brand category \({c}_{{b}_{j}}\) (technology brand, automaker brand, new brand) and of the specific brand \({b}_{j}\) within the category (e.g., Google, Microsoft, Apple in the technology brand category):
We test the different models separately for the rental and purchase scenarios. In both cases, we have transformed the prices to values between $0 and $10 to indicate the extra charge compared to the manually driven car (measured in thousands for the purchase scenario). We modeled the price utility with a linear (vector) model. Effects of the brand category and the specific autonomous car brands within the category are zero-centered (effect-coded). Table 3 compares the results of models (1) and (2).
Table 3
Estimation results
Rental benchmark Model 1
Purchase benchmark Model 1
Rental brand extension Model 2
Purchase brand extension Model 2
Estimate
Estimate
Estimate
Estimate
Brand category
Technology brand
0.24
0.17
− 0.21
− 0.19
Automaker brand
− 0.12
0.08
0.03
ns
0.22
New brand
− 0.12
− 0.25
0.18
− 0.04
ns
Autonomous car brand
Google
0.11
ns
0.26
− 0.05
ns
0.09
ns
Microsoft
− 0.11
ns
− 0.19
0.00
ns
− 0.11
ns
Apple
0.00
ns
− 0.07
ns
0.05
ns
0.03
ns
Ford
0.08
ns
0.06
ns
− 0.07
ns
− 0.09
ns
Chrysler
− 0.22
− 0.26
− 0.05
ns
− 0.12
ns
Chevrolet
0.14
0.20
0.12
ns
0.21
Tesla
0.86
1.22
0.22
0.62
Uber
− 0.16
− 0.67
− 0.12
ns
− 0.61
Robocab
− 0.70
− 0.55
− 0.10
ns
− 0.01
ns
Full (vs. partial) autonomy
(dummy)
0.83
0.37
0.87
0.39
Price
(linear)
− 0.17
− 0.24
− 0.18
− 0.25
None option (manually driven car)
(dummy)
− 0.67
− 0.12
0.32
0.68
Brand image association
PB Quality
0.38
0.30
PB Trust
0.52
0.43
PB Experience
0.32
0.40
PB-OC Linkage
− 0.03
ns
− 0.02
ns
BE EMS
0.40
0.10
ns
Brand Portfolio
0.00
ns
− 0.10
ns
Capability Fit
0.33
0.32
Product Fit
0.19
0.16
Image Fit
0.25
0.45
Log-likelihood:
− 3348.3
− 3556.4
− 3150.9
− 3400.8
Pseudo R-squared adj
0.13
0.21
0.17
0.24
All effects are significant on a 5% level unless marked as not significant (ns)
4.2.1 Model 1
Overall, consumers are more likely to choose an autonomous car in the rental scenario than in the purchase scenario. In both scenarios, consumers would prefer to drive fully autonomously than having a partially self-driving car.
On average, technology brands are most preferred for renting or purchasing an autonomous car. New brands are least preferred in a purchase setting, while they are equally preferred as automaker brands in the rental scenario. The brand preference ranking within the brand categories is generally consistent in both scenarios, with Google (Microsoft) being most (least) preferred in the technology brand category, Chevrolet (Chrysler) being most (least) preferred in the automaker category, and Tesla being the most preferred new brand. For new manufacturers, the least preferred brand differs. While Robocab is clearly the least preferred brand in the rental scenario, it shares the lowest utility in the purchase setting with Uber (preferences are not significantly different, p = 0.14). Remarkably, in both scenarios, Tesla is the overall most preferred autonomous car brand although it originates from the least preferred brand category. For rental cars, the utility of a Tesla car is 0.74 (\({\beta }_{\mathrm{Tesla},\mathrm{rental}}=-0.12+0.86\)), followed by Google with a utility of 0.35. In the purchase scenario, Tesla has a utility of 0.97 (\({\beta }_{\mathrm{Tesla},\mathrm{purchase}}=-0.25+1.22\)), compared to Google with a utility of 0.42. This translates to an incremental willingness to pay of $2.25 per hour more for renting a Tesla car compared to a Google car and $2231 more when buying a Tesla instead of a Google self-driving car.
4.2.2 Model 2
In model 2, we add the brand-specific covariate whether the consumer associates the specific brand with a certain image (= 1) or not (= 0). The corresponding betas express the conditional effect of being associated with a specific image dimension on the brand utility. The brand category and specific brand parameters are reduced to residual effects that express the remaining utility that is not captured by the brand associations. Most of the residual effects become non-significant after adding the image dimensions, which indicates that the image associations can explain a large part of the differences between the brands.
Our study generally confirms the image associations that were identified by Völckner and Sattler (2006), only PB-OC Linkage, which was also not supported by Völckner and Sattler, and Brand Portfolio do not have a significant effect. In the purchase scenario, also expected marketing support (BE EMS) does not play a role. Fit between the parent brand and the extension category is, in combination, the most influential image association in both scenarios, while product fit is weakest within the fit measures. Trust is the second most important image association. Moreover, in both markets, quality of the parent brand (PB Quality) and parent-brand experience (PB Experience) have a strong influence on brand preferences. Interestingly, the relevance of the remaining image associations differs strongly between the two scenarios. BE EMS has a strong effect in the rental scenario while it is not significant for purchases. Overall, these results demonstrate that image effects depend on the choice context. Model 3 checks if the relevance of image dimensions also depends on the brand category.
4.2.3 Model 3
Overall, we find that the brand category moderates the relative impact of the image associations, which implies meaningfully different positioning strategies among the brands.
In the rental market, newer brands benefit most if they can align themselves with specific associations. Specifically, the role of expected marketing support increases substantially making this the most important brand association for new brands. Newer brands rely significantly less on PB experience, canceling out the positive main effect of this brand association. Technology brands benefit most if users have experienced the brand before and consider the firm to be capable of creating the extension, making PB Experience and Capability Fit the two most influential brand association. The role of BE EMS is of lesser importance. Automaker brands are substantially less sensitive to the effect of brand associations in general. Specifically, associations with Capability Fit and Image Fit do not play a role for automaker brands. Automaker brands are therefore mostly affected by the main effects of the image associations (PB Trust, BE EMS, and PB Quality).
When purchasing a new self-driving car, there are fewer moderating effects of the brand category compared to the rental market. In fact, technology brands do not differ at all from the main effect of the brand associations. Similar to the rental market, newer brands do not require PB Experience but rely more on Image Fit. The effect of Product Fit is also less influential. Most of the moderating effects can be observed for automobile brands. Specifically, we see that automaker brands are increasingly preferred when associated with PB Experience. Associations with PB Quality, PB-OC Linkage, and Image Fit are less influential. See Appendix Table 6 for details.
4.2.4 Model 4
Perceived risk and innovativeness moderate the preferences in an intuitive way. In both markets, those who perceive a higher risk or are less innovative are less likely to choose an autonomous car in general or prefer partial instead of full autonomy. In the rental scenario, those consumers with higher perceived risk prefer automaker brands more than technology brands. Consumers who are more innovative are more likely to consider new car brands and are less price sensitive. Only four out of the 36 moderators on the brand image effects are significant. Due to the sparsity of effects, we do not interpret this model further.
5 Branding implications
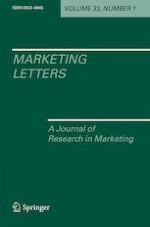
Two factors affect brand strength according to our model: (1) the strength of the associations with a brand (Table 2) and (2) the marginal effect of the association on utility (Appendix Table 6). Consistent with Keller’s (1993) conceptualization of customer-based brand equity, a brand benefits most if consumers hold strong (relating to 1) and favorable (relating to 2) brand associations in memory.3 Firms can therefore increase their brand strength either by strengthening the associations or by affecting the perceived utility, e.g., relevance, of the association.
Figure 1 shows the positioning of the most preferred brands per category, Google, Chevrolet, and Tesla, on the two aforementioned dimensions in the rental market (see Appendix Fig. 3 for the purchase market). Google’s brand strength is mostly due to strong associations with PB Experience and Capability fit, which both have a strong positive effect on utility. Google is also highly associated with its brand portfolio; however, this dimension is not relevant when evaluating autonomous cars. To increase its brand strength, Google could promote the relevance of other products in their portfolio for autonomous driving, e.g., that experiences from Google Maps help navigation or Google Glass developments can assist street sign recognition.
Fig. 1
Brand profiles (rental scenario)
×
Chevrolet’s positioning illustrates that automaker brands benefit less from brand associations in general. Chevrolet is also only weakly associated with the dimensions, meaning that most of the effects are in the bottom left quadrant (weak associations and weak marginal effect). Chevrolet could try and strengthen its brand by increasing the relevance of its strongest association PB-OC Linkage, e.g., by connecting autonomous vehicles more with the car category than with the self-driving technology. This would, however, also benefit other competitors from the automobile industry, which are also strongly associated with PB-OC Linkage. Alternatively, Chevrolet would benefit if consumers held stronger associations with the most influential dimensions PB Trust and BE EMS.
Tesla’s brand strength can be explained by strong associations with highly influential dimensions, i.e., Image Fit, PB Quality, and BE EMS. Tesla could increase its strength further by improving associations with PB Trust.
6 Summary and discussion
In this research, we measure consumer preferences for autonomous cars in a rental and purchase context and focus on brand extensions from parent brands that originate from three manufacturer types, i.e., automobiles, technology, or newer, specialized companies. Several results are managerially and theoretically relevant.
First, our findings show that despite the uncertainty that consumers face in this radically new market, they are willing to consider autonomous driving. Brands play a central role in this context. For example, our results predict that 74% of the consumers would rent a Tesla self-driving car at a 20% price premium instead of a manually driven car, while the majority would prefer the manually driven car when the autonomous car was from an unknown brand (38% share). The results also demonstrate that consumers trade off multiple brands originating from different backgrounds. While technology brands are, on average, more preferred than automaker or new brands in our study, Tesla is the overall most preferred brand for self-driving cars, indicating that brand perceptions beyond the brand category play an important role.
Second, we find that brand preferences differ systematically when buying versus renting a self-driving car. These results have meaningful managerial implications. For example, automaker brands are preferred over new brands in purchase contexts; however, traditional car brands cannot leverage their brand equity from the purchase to the rental market. In the rental context, the new brand Uber has about the same brand strength as Chrysler. Established automaker brands might therefore prefer to stake their claim in the purchase market.
Third, our findings allow to diagnose brand strength and dissect the perception into the effects of several brand image associations. Despite major differences in the research context to previous studies that focus mostly on FMCG, we find support for the majority of brand extension success drivers that Völckner and Sattler (2006) identified. We extend Völckner and Sattler’s research by showing more nuanced effects for fit, i.e., capability fit, product fit, and image fit, which each shows significant effects.
Fourth, we find that the importance of brand extension success factors differs between parent-brand categories. When renting a self-driving car from a technology brand, consumers rely more on experience and capability fit. This could be affected by the process of renting a self-driving car, which likely will involve software with payment capabilities that the consumers might have experienced by these companies and consider them capable of. This notion is supported by the result that experience with an automobile brand is increased when buying a car. This experience might originate from showrooms or test drives at a dealership which play a more important role in the purchase context. Relatedly, we find that BE EMS plays a relevant role for rentals and particularly for new brands, but not for purchases. Our measurement of BE EMS likely entails expected customer support that is arguably more important during the rental period as it involves multiple touchpoints in a short amount of time. Moreover, the role of image fit is particularly stronger for new brands, while it is weaker for automobile brands. An explanation could be that newer brands are more specifically targeted at self-driving cars such that the brand image appears more consistent. These interactions are plausible and managerially relevant. For generalizability, future research should adopt a conceptual perspective to explore the underlying mechanisms for evaluating these brand categories and choice contexts in more detail. Given the different effects of experience and marketing support, it seems promising to focus on the role of touchpoints and the customer journey.
Our research is subject to limitations. We limited ourselves mostly to the brand extension drivers that Völckner and Sattler (2006) identified in their research, while it is possible that our research context warrants additional associations to be studied. Moreover, due to the multiple drivers and brands we test, we had to use single item measures to prevent respondent fatigue. Relatedly, we measure expected marketing support, which is limited to consumer expectations about whether a company will deliver competent marketing and does not take into account the indirect nature of some marketing actions, e.g., the persuasiveness of an ad.4 Also, we use discrete measures of associations and can only account for the strength of an association on an aggregate level, not an individual level. In addition, while we focused on consumers with a driver’s license, this requirement will not be necessary when researching fully autonomous cars that will also enable mobility to, e.g., visually impaired consumers. These consumers might have limited experience with traditional automaker brands and might consider other brands and other factors in their decision to adopt a self-driving car. Moreover, self-driving cars also need to compete with manually driven cars in the future. We incorporated the manually driven car via a none option. However, in this way, the manually driven car is unspecified in terms of the brand (and other characteristics). Purchasing a car involves more complex decision processes than we model in our research, likely stretching across several touchpoints (Lemon & Verhoef, 2016) and following a decision hierarchy, e.g., consider-then-choose (Hauser, 2014). The analysis of brand image effects when forming consideration sets for autonomous vehicles or the effect of touchpoints on brand image (Baxendale et al., 2015) seem promising to pursue further in our research context. Finally, branding for autonomous cars might not only take place via brand extensions but also via co-branding (e.g., an autonomous car built by Ford and Google) or ingredient branding (e.g., a Ford car with self-driving technology by Google). While these limitations hinder generalizability, they offer promising opportunities for future research.
Open AccessThis article is licensed under a Creative Commons Attribution 4.0 International License, which permits use, sharing, adaptation, distribution and reproduction in any medium or format, as long as you give appropriate credit to the original author(s) and the source, provide a link to the Creative Commons licence, and indicate if changes were made. The images or other third party material in this article are included in the article's Creative Commons licence, unless indicated otherwise in a credit line to the material. If material is not included in the article's Creative Commons licence and your intended use is not permitted by statutory regulation or exceeds the permitted use, you will need to obtain permission directly from the copyright holder. To view a copy of this licence, visit http://creativecommons.org/licenses/by/4.0/.
Publisher's Note
Springer Nature remains neutral with regard to jurisdictional claims in published maps and institutional affiliations.
Please select all brands that offer high-quality products and/or services
PB Trust
PB Conviction
Please select all brands that you trust
PB Experience
PB Experience
Please select all brands that you have used in the last 12 months
PB-OC Linkage
PB-OC Linkage
Please select all brands that are closely tied to the attributes of the original product category that you associate with the brand.a
BE Expected Marketing Support (EMS)
BE Marketing
Please select all brands that you expect to support their self-driving cars with competent marketing
Brand Portfolio
BE History
Please select all brands that have a lot of products and/or services affiliated with the brand
Capability Fit
Capability Fit
Please select all brands that have the people, facilities and skills to create self-driving cars
Product Fit
Product Fit
Please select all brands that currently offer products and/or services that are closely tied to self-driving cars
Image Fit
Authenticity
Please select all brands whose self-driving cars are consistent with your image of the brand
Perceived Uncertainty
Perceived Risk
If I choose self-driving cars, I would feel very uncertain of the level of quality that I am getting
Innovativeness
Innovativeness
I like to buy new products before others do
aPrior to answering this question, we gave respondents the following example in order to help understanding this item: “The brand Disney started with producing movies (for example, Mickey Mouse). Later, they also started offering theme parks (for example, Disneyland) or Cruise ship holidays. In this example, you can see “movies” as Disney’s original product category”
Fig. 2
a Exemplary choice task–rental scenario. b Exemplary choice task–purchase scenario
Table 5
Correlation between brand extension drivers
PB Quality
PB Trust
PB Experience
PB-OC Linkage
BE EMS
Brand Portfolio
Capability Fit
Product Fit
Image Fit
PB Quality
1.00
PB Trust
0.47
1.00
PB Experience
0.42
0.35
1.00
PB-OC Linkage
0.30
0.19
0.24
1.00
BE EMS
0.41
0.27
0.25
0.23
1.00
Brand Portfolio
0.46
0.30
0.50
0.31
0.30
1.00
Capability Fit
0.41
0.26
0.18
0.24
0.50
0.28
1.00
Product Fit
0.26
0.12
0.05
0.15
0.35
0.08
0.43
1.00
Image Fit
0.39
0.29
0.16
0.20
0.48
0.22
0.53
0.47
1.00
Table 6
Estimation results with moderation effects of brand category (model 3)
Rental Model 3
Purchase Model 3
Estimate
Estimate
Brand category
Technology brand
− 0.54
− 0.35
Automaker brand
0.53
0.54
New brand
0.01
ns
− 0.20
ns
Autonomous car brand (residual)
Google
− 0.11
ns
0.08
ns
Microsoft
− 0.02
ns
− 0.12
ns
Apple
0.13
ns
0.03
ns
Ford
− 0.02
ns
− 0.08
ns
Chrysler
− 0.11
ns
− 0.13
ns
Chevrolet
0.13
ns
0.21
Tesla
0.01
ns
0.30
Uber
− 0.07
ns
− 0.42
Robocab
0.06
ns
0.13
ns
Full (vs. partial) autonomy
(dummy)
− 0.89
− 0.40
Price
(linear)
− 0.18
− 0.25
None option (manually driven car)
(dummy)
0.36
0.66
Brand image association
PB Quality
0.45
0.38
PB Trust
0.51
0.46
PB Experience
0.39
0.31
PB-OC Linkage
− 0.07
ns
− 0.03
ns
BE EMS
0.44
0.11
ns
Brand Portfolio
0.00
ns
− 0.08
ns
Capability Fit
0.29
0.32
Product Fit
0.20
0.10
ns
Image Fit
0.25
0.52
Brand image association moderation by technology brand category
Technology brand × PB Quality
− 0.07
ns
0.18
ns
Technology brand × PB Trust
− 0.08
ns
− 0.14
ns
Technology brand × PB Experience
0.43
0.11
ns
Technology brand × PB-OC Linkage
0.14
ns
0.13
ns
Technology brand × BE EMS
− 0.29
− 0.14
ns
Technology brand × Brand Portfolio
− 0.22
ns
− 0.14
ns
Technology brand × Capability Fit
0.47
0.08
ns
Technology brand × Product Fit
− 0.01
ns
0.13
ns
Technology brand × Image Fit
0.02
ns
− 0.03
ns
Brand image association moderation by automaker brand category
Automaker brand × PB Quality
− 0.11
ns
− 0.38
Automaker brand × PB Trust
0.05
ns
0.02
ns
Automaker brand × PB Experience
− 0.20
ns
0.32
Automaker brand × PB-OC Linkage
− 0.18
ns
− 0.24
Automaker brand × BE EMS
0.05
ns
0.03
ns
Automaker brand × Brand Portfolio
− 0.07
ns
− 0.04
ns
Automaker brand × Capability Fit
− 0.29
− 0.04
ns
Automaker brand × Product Fit
0.06
ns
0.10
ns
Automaker brand × Image Fit
− 0.27
− 0.23
Brand image association moderation by new brand category
We pretested the survey with 50 respondents in the purchase scenario. We made no further changes based on the pretest so that we added the 50 consumers to the final analysis.