
Abstract
While the RT-PCR is the silver bullet test for confirming the COVID-19 infection, it is limited by the lack of reagents, time-consuming, and the need for specialized labs. As an alternative, most of the prior studies have focused on Chest CT images and Chest X-Ray images using deep learning algorithms. However, these two approaches cannot always be used for patients’ screening due to the radiation doses, high costs, and the low number of available devices. Hence, there is a need for a less expensive and faster diagnostic model to identify the positive and negative cases of COVID-19. Therefore, this study develops six predictive models for COVID-19 diagnosis using six different classifiers (i.e., BayesNet, Logistic, IBk, CR, PART, and J48) based on 14 clinical features. This study retrospected 114 cases from the Taizhou hospital of Zhejiang Province in China. The results showed that the CR meta-classifier is the most accurate classifier for predicting the positive and negative COVID-19 cases with an accuracy of 84.21%. The results could help in the early diagnosis of COVID-19, specifically when the RT-PCR kits are not sufficient for testing the infection and assist countries, specifically the developing ones that suffer from the shortage of RT-PCR tests and specialized laboratories.
1 Introduction
In December 2019, a novel coronavirus (COVID-19) has been discovered in Wuhan, China [29]. Within a short period, this epidemic has spread from China to more than 100 countries across the globe [9]. As of today (August 22nd, 2020), the number of infected cases becomes 23,036,919, and more than 800,945 death cases were reported on a global basis [27]. The employment of smart technologies can help in the early identification of potential cases of COVID-19 [22].
The area of artificial intelligence (AI) and machine learning has been widely employed across numerous sectors, particularly during the last few years [15]. While AI techniques have been immensely employed and tested across the healthcare sector [6], the newly emerged COVID-19 requires the need to use these techniques in identifying, predicting, and preventing its outbreak. It is postulated that AI techniques would make a paradigm shift in the healthcare sector, and this might require the engagement of these techniques to the streaming COVID-19 outbreak [19]. The accuracy of COVID-19 diagnosis must be improved in order to quickly confirm the positive cases to avoid further infection and secure timely treatment [20].
For the identification of the research gap, this research carried out a bibliometric analysis of the existing literature on the application of machine learning algorithms on COVID-19 using the VOSviewer tool. This has been undertaken through the Web of Science database in August 2020. The bibliometric analysis results shown in Fig. 1 indicate that the applications of machine learning algorithms on COVID-19 are limited to two themes. By examining the relevant studies under each cluster (theme), the first cluster shows that most of the studies have focused on predicting COVID-19 infection using weather datasets. The second cluster indicates that the rest of the studies have emphasized on Chest CT images and Chest X-Ray images using deep learning algorithms. While the high sensitivity of COVID-19 diagnosis has been well characterized through CT and X-Ray images [1], such tests can sometimes be difficult to be used for patients’ screening due to the radiation doses, high costs, and the low number of available devices [7]. Therefore, the problem of how to differentiate between positive and negative cases of COVID-19 is still a challenge that needs to be solved in order to curb the pandemic [7]. In line with these arguments and drawing on the bibliometric analysis results, no diagnostic model has been proposed to identify the positive and negative cases of COVID-19 using several clinical features. Therefore, this research aims to predict the COVID-19 positive or negative cases based on 14 clinical features using machine learning classification algorithms.

Applications of machine learning algorithms on COVID-19
2 Literature review
In line with the objective of this research, we have focused on reviewing the studies that applied machine learning algorithms on patients’ clinical features of COVID-19. Table 1 presents examples of such studies. It can be noticed from Table 1 that most of the conducted studies have focused on the clinical features related to Chest CT images and Chest X-Ray images. A few numbers of studies have concentrated on the relationship between clinical features and COVID-19 infection. For instance, Chen et al. [10] proposed and validated a diagnostic model for COVID-19 based on clinical and radiological features. Burian et al. [8] evaluated clinical and imaging features to measure the need for intensive care unit (ICU) treatment. Another two studies were conducted to identify the positive COVID-19 cases based on blood tests analysis [7], [5].
While some studies have considered some clinical features, they were limited to blood tests and RT-PCR tests [7], [5]. Therefore, it is believed that other clinical features might have a significant effect on the infection of COVID-19. It is evident that there is a little debate on the relationship between the white blood cell count (WBC), Neutrophil (N%), Lymphocyte (L%), Monocytes (M%), Eosinophil (E%), Basophils (B%), Neutrophil-Lymphocyte (N/L), Lymphocyte/Monocyte (L/M), Hemoglobin (Hb), Hematocrit (Hct), Mean red blood cell volume (MCV), Platelet (PLT), Thrombocytocrit (Pct), and Procalcitonin (Pro) and the infection of COVID-19.
3 Method
Several machine learning classification algorithms (as described in Section 3.2) have been employed to identify the positive and negative cases of COVID-19. Figure 2 shows the data flow of the mining process. The process involves data cleaning, data transformation, and applying machine learning algorithms on the fourteen clinical features of COVID-19 patients. In the first step, the real data of COVID-19 patients are obtained for the analysis. During the second step, the expert panel, consisting of three medical doctors, reached a consensus on which attributes to be involved in the predictive model. However, the collected data contain some noise and need to be cleaned up, as it cannot be processed directly with machine learning algorithms. In this step, data cleaning is also applied to correct data inconsistencies and remove noise. In the third step, to prepare the data for machine learning algorithms, data transformation is applied. In that, negative and positive COVID-19 cases were transformed into 1 and 2, respectively. In the last step, machine learning algorithms are applied on the final data to classify the COVID-19 patients into either positive or negative cases.
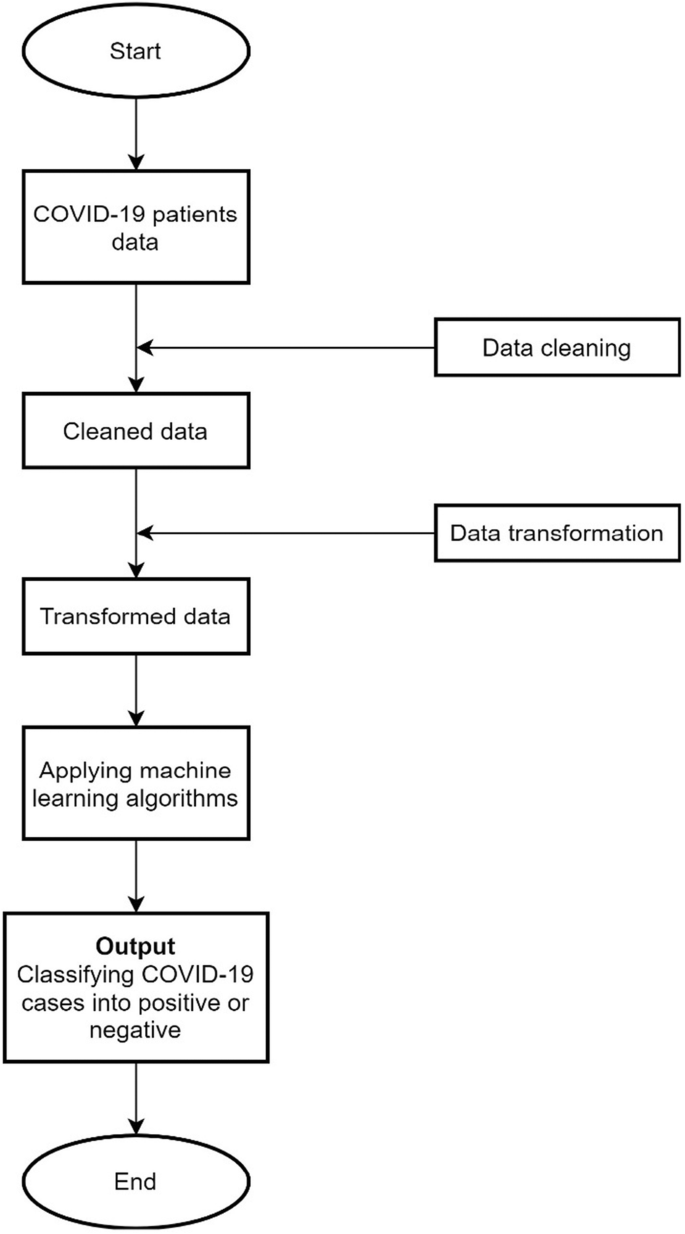
Data flow diagram
The rest of this section is divided into two subsections. The first subsection presents the collected COVID-19 data. The second subsection describes the machine learning classification algorithms employed in this study, along with the adopted attributes (features).
3.1 Subjects
This study retrospected 114 subjects from the Taizhou hospital of Zhejiang Province in China from January 17, 2020 to February 1, 2020. An informed consent form was obtained from all patients. 59.6% of the subjects were males (N = 68), while 40.4% were females (N = 46). The age of the subjects is ranged between 1 and 80 years old (Mean = 39.63, SD = 18.83). A real-time polymerase chain reaction (real-time PCR) was used for the diagnosis of the COVID-19 in the selected subjects. The results suggested that there were 32 positive COVID-19 cases and 82 negative COVID-19 cases. The clinical symptoms of the infected patients include high Fever (90.6%), Cough (62.5%), Mucus Sputum (25%), Headache (12.5%), Fatigue (12.5%), Pharyngalgia (Pharynx Pain) (12.5%), and Chest Tightness (6.3%).
The age of positive COVID-19 cases ranges between 10 and 80 years old, while the age of negative COVID-19 cases ranges between 1 and 79 years old. It is imperative to report that the elder ages of positive COVID-19 cases exceed the number of younger ages. The positive cases included 20 (20/32 = 62.5%) males and 12 (12/32 = 37.5%) females, with a mean age of 44 (SD = 16.11). In addition, the negative cases included 48 (48/82 = 58.5%) males and 34 (34/82 = 41.5%) females, with a mean age of 37.9 (SD = 19.61). This indicates that the probability of COVID-19 infected males (62.5%) was higher than the infected females (37.5%). The RAND () function in MS Excel is used to choose the equal number of cases in both genders and eliminate the ambiguities of bias because of the imbalanced data ratio. A random number was created for each case then sorted by the random number to choose the first 46 male subjects. An independent sample t-test was conducted using a bootstrapping of 5000 with a 95% confidence interval to assess the difference between female and male subjects. There were 17 positive cases and 29 negative cases among men, compared to 12 positive cases and 34 negative cases among women. The results indicated that there was no significant difference (t (90) = 1.117, p = .267) between men (M = 1.63, SD = 0.488) and women (M = 1.74, SD = 0.444) subjects.
3.2 Data analysis
This research employs machine learning classification algorithms, including Bayes classifier (BayesNet), logistic-regression (Logistic), lazy-classifier (IBk), meta-classifier (Classification via Regression (CR)), rule-learner (PART), and decision-tree (J48). The expert panel, consisting of three medical doctors, reached a consensus on 14 attributes to be included in the predictive model among 170 attributes (e.g., RBC, Hb, Hct, MCV, MCH, MCHC, RDW, PLT, Pct, MPV, PDW, ESR, Blood Type, procalcitonin, Immunoglobulin-G, Immunoglobulin-A, Immunoglobulin-M, RF, CRP, ALT, AST, ALP, GGT, DBIL, IBIL, TP, etc.). Therefore, the study developed a predictive model which has 14 attributes (features), including the white blood cell count (WBC), Neutrophil (N%), Lymphocyte (L%), Monocytes (M%), Eosinophil (E%), Basophils (B%), Neutrophil-Lymphocyte (N/L), Lymphocyte/Monocyte (L/M), Hemoglobin (Hb), Hematocrit (Hct), Mean red blood cell volume (MCV), Platelet (PLT), Thrombocytocrit (Pct), and Procalcitonin (Pro). The SPSS (v.23) is used to generate the descriptive statistics of the patients. The Weka (v.3.8.4) (data mining tool) is used to analyze the underlying data and test the predictive model.
4 Results
The performance measurements of different classifiers is an essential task in machine learning. A confusion matrix is a diagnostic tool that is beneficial to compute different effectiveness measures. This diagnostic tool helps to reveal the types of errors committed by the classification algorithm. There are a number of evaluation metrics that can be computed and based on confusion matrix, such as Correctly Classified Instances (CCI), False Positive Rate (FPR), F-Measure, Matthews Correlation Coefficient (MCC), Receiver Operating Characteristic (ROC) Area, and Precision-Recall Curve (PRC) Area.
Machine learning classification evaluation metrics are ways to quantify the performance of any classification method (algorithm). The evaluation metrics used in this study are for supervised learning. Each of the six adopted classifiers used in this study tries to solve a binary classification problem. The confusion matrix rows refer to the results of the classifiers, while the confusion matrix columns refer to the known truth. The True Positive (TP) in Table 2 refers to the number of patients that truly have COVID-19, and the classifier correctly identified their illness. The False Positive (FP) in Table 2 refers to the number of patients that truly don’t have COVID-19, but the classifier mistakenly identified them as COVID-19 patients. The True Negative (TN) in Table 2 refers to the number of patients that truly don’t have COVID-19, and the classifier correctly identified them. The False Negative (FN) in Table 2 refers to the number of patients that truly have COVID-19, but the classifier identified them mistakenly as do not have COVID-19.
The first classification evaluation metric is called Accuracy (Correctly Classified Instances (CCI)), which is computed as per the following formula:
Another evaluation metric called Recall (R) and also known as True Positive Rate (TPR) and (Sensitivity). The Recall (R) shows the percentage of COVID-19 patients that were correctly identified by the classifier under consideration according to the following formula:
The Precision (P), also known as (Positive Predictive Value (PPV)), is another evaluation metric, and its value ranges as the other used metrics from 0 to 1. It is imperative to mention that the value of P approaches 1 in the case that the False Positive (FP) values approach 0. The precision is measured through the following formula:
The metric that summarizes both the Precision (P) and Recall (R) metrics in one metric is known as F-Measure (F1), which is the harmonic mean of Precision (P) and Recall (R). The F-Measure is computed using the following formula:
The Matthews Correlation Coefficient (MCC) is used to evaluate the effectiveness of different classifiers. MCC is considered as a balanced measure even when the sizes of the classes under consideration are different, and it is measured using the following formula:
4.1 Descriptive statistics
This research employs the machine learning classification algorithms to predict the infected (N = 32) or non-infected (N = 82) cases of COVID-19. The predictive model, which was built on the 14 attributes (features), was tested by the Waikato Environment for Knowledge Analysis (WEKA) software using the 10-fold cross-validation method. Table 3 shows the descriptive statistics of the 14 attributes (features).
4.2 Classifiers performance using 10-fold cross‐validation method
The Bayes classifier (BayesNet), logistic-regression (Logistic), lazy-classifier (IBk), meta-classifier (Classification via Regression (CR)), rule-learner (PART), and decision-tree (J48) algorithms were employed to build the predictive models. The True Positive (TP) rate, False Positive (FP) rate, Precision, F-Measure, Recall, and Receiver-Operating-Characteristic (ROC) area metrics were used to evaluate the performance of the classifiers. The performance of the classifiers was tested by using the 10-fold cross-validation method. In that, 90% of the data were used to train the classifier under consideration, while 10% of the data were used to test the effectiveness of the classifier. Table 4 indicates that the CR meta-classifier has a better performance than the other classifiers in predicting the COVID-19 cases by the values of the 14 attributes. The CR meta-classifier predicted the positive and negative cases with an accuracy of 84.21% (CCI: 96/114). The CR meta-classifier has a better performance in precision (0.837), TP rate (0.842), and ROC area (0.873).
The real-time PCR results indicated that there were 32 positive and 82 negative cases, and the CR meta-classifier indicated that there are 20 true positives (TP), 6 false positives (FP), 12 false negatives (FN), and 76 true negatives (TN). Concerning the sensitivity, the proportion of true positives (Sensitivity = TP / (TP + FN) = 20/32) that are correctly identified by the CR meta-classifier is 62.5%. In terms of specificity, the proportion of true negatives (Specificity = TN / (TN + FP) = 76/82) that are correctly identified by the CR meta-classifier is 92.7%. The results indicated that 76.9% of the COVID-19 positive cases are expected to have abnormal real-time PCR results (Positive predictive value = TP / (TP + FP) = 20/26), while 86.4% of the COVID-19 negative cases would have normal real-time PCR results (Negative predictive value = TN / (TN + FN) = 76/88).
The TP rate indicates the percentage of positive instances that were correctly classified by the classifiers. On the other hand, the FP rate indicates the percentage of negative instances that were incorrectly classified as positive by the classifiers. Precision indicates the proportion of the instances that were classified as positive, and they were actually such. Recall indicates the proportion of the positive instances, and they were classified as such. F-measure is the harmonic mean of the Recall and Precision [28]. The ROC area indicates the relationship between false positive and true positive rates. It is argued that the higher the ROC area, the better the predictive model [17].
4.3 Decision tree
Figure 3 provides a systematic visual representation of the J48 decision tree. The decision tree predicted the positive and negative COVID-19 cases with an accuracy of 73.68% (CCI: 84/114). The J48 has an acceptable performance in precision (0.742), TP rate (0.737), and ROC area (0.722). Figure 3 shows that white blood cell count (WBC) is the “root” node with 10 leaves. The internal nodes (having outgoing edges) split the instance space into two sub-spaces using a function of the attribute values. The J48 decision tree provided an algorithm for the classification and prediction of subjects as positive or negative based on the attribute values.

J48 Decision Tree
4.4 Performance comparison of the classifiers
Table 5 shows the performance of the classifiers by using the 10-fold cross-validation method. Kappa Statistic is defined as the “degree of agreement between two sets of categorized data” [18]. The higher the Kappa statistic, the greater the agreement. The mean absolute error (MAE) is defined as the “sum of absolute errors divided by number of predictions” [18]. MAE measures how close the predicted model to the actual model. The root mean square error (RMSE) is defined as the “square root of sum of squares error divided number of predictions” [18]. The smaller the RMSE, the better the accuracy. These results suggested that the CR has a better performance than the other classifiers. Overall, it is believed that the classifiers have an acceptable performance.
Due to the lack of similar COVID-19 resources, we have compared the CR classifier with the prior studies that applied the meta classifiers based on four datasets (i.e., Statlog, Z-Alizadeh Sani, Hungarian, and Cleveland). Table 6 indicates that the accuracy achieved in the first four studies ranges between 85% and 89%. Although the accuracy of the current study is less than the first four studies, it outperformed the accuracy of the study conducted by Alizadehsani et al. [2]. The discrepancy between these results stems from the differences in datasets and the number of features in each of the compared studies. Due to the recency of the COVID-19 topic and the shortage of available datasets, it is believed that the current accuracy (84.21%) is acceptable.
4.5 Cost/benefit analysis
The ROC curve is a graphical technique for selecting and visualizing the classifiers based on their performance [12]. The ROC curves shown in Fig. 4 suggested that the CR has the highest percentage accuracy with a ROC area value of 0.8727. Figure 5 shows the threshold (X: sample size, Y: true positive rate) and cost/benefit curves (X: sample size, Y: cost/benefit). The lowest point at the cost/benefit curve (marked with “X”) was the minimum cost/benefit point. The CR classifier has the highest accuracy (85.09%) at this point. The cost incurred by this classifier for the misclassification was 17 at this point. The cost that would be incurred if the subjects were randomly classified was 42.96. The gain obtained from using the classifier was 25.96.

ROC curves for the CR

Cost/benefit analysis curves
5 Discussion and conclusion
For the identification of positive and negative cases of COVID-19, most of the previous studies have focused on Chest CT images and Chest X-Ray images using deep learning algorithms. Although the diagnosis of COVID-19 can be well-identified using CT and X-Ray images [1], these tests cannot always be used for patients’ screening due to the radiation doses, high costs, and the low number of available devices [7]. Thus, differentiating between positive and negative cases of COVID-19 still represents a major problem [7]. In line with these arguments and drawing on the bibliometric analysis results, no diagnostic model has been proposed to identify the positive and negative cases of COVID-19 using several clinical features. Hence, this study aimed to predict the COVID-19 positive or negative cases based on 14 clinical features using machine learning classification algorithms.
Six predictive models for COVID-19 diagnosis using six different classifiers (i.e., BayesNet, Logistic, IBk, CR, PART, and J48) were developed based on the 14 clinical features. The models were validated using CCI, TP rate, FP rate, precision, recall, F-measure, and ROC area. From the machine learning perspective, the results showed that the CR classifier had outperformed (0.873) the other five classifiers in predicting the COVID-19 cases. This implied that CR was the most suitable classifier in predicting the positive and negative subjects based on the 14 attributes used in this study with an accuracy of 84.21%. From the medical perspective, these results provide evidence that the CR is the most accurate classifier for predicting the positive and negative COVID-19 cases based on the 14 attributes used in this study. The decision tree results also provided evidence of the soundness of the approach through which the positive and negative cases of COVID-19 have been predicted with an accuracy of 73.68%.
When the clinical doctors only rely on RT-PCR to confirm the positive COVID-19 infections, the False Positive and False Negative patients would probably occur. This, in turn, would delay the disease treatment and allow the False Negative patients to spread quickly. Therefore, this study could assist the doctors to improve the prediction rate of confirmed COVID-19 infections. The predictive models could play an important role in early diagnosis, specifically when the RT-PCR kits are not sufficient for testing the COVID-19 infection. The results are also expected to help countries, specifically the developing ones that suffer from the shortage of RT-PCR tests and specialized laboratories. While using the 14 attributes in any other COVID-19 datasets, it is believed that the CR classifier could help the doctors in predicting the COVID-19 cases and classifying them as either positive or negative.
The limitations of this research are two-fold. First, the sample size is relatively low, which stems from the difficulty of collecting larger samples during the pandemic. Second, it was unfortunate that this research did not involve the COVID-19 symptoms in predicting the infection of the virus due to the unavailability of data. This might be an interesting research path to be investigated in future research trials.
References
Ai T et al (2020) Correlation of chest CT and RT-PCR testing for coronavirus disease 2019 (COVID-19) in China: a report of 1014 cases. Radiology. https://doi.org/10.1148/radiol.2020200642
Alizadehsani R et al (2013) Diagnosing coronary artery disease via data mining algorithms by considering laboratory and echocardiography features. Res Cardiovasc Med. https://doi.org/10.5812/cardiovascmed.10888
Amin MS, Chiam YK, Varathan KD (2019) Identification of significant features and data mining techniques in predicting heart disease. Telemat Informatics. https://doi.org/10.1016/j.tele.2018.11.007
Ardakani AA, Kanafi AR, Acharya UR, Khadem N, Mohammadi A (2020) Application of deep learning technique to manage COVID-19 in routine clinical practice using CT images: Results of 10 convolutional neural networks. Comput Biol Med 121:103795. https://doi.org/10.1016/j.compbiomed.2020.103795
Banerjee A et al (2020) Use of machine learning and artificial intelligence to predict SARS-CoV-2 infection from full blood counts in a population. Int Immunopharmacol 86:106705. https://doi.org/10.1016/j.intimp.2020.106705
Bian J, Modave F (2020) The rapid growth of intelligent systems in health and health care. Health Informatics J 26(1):5–7
Brinati D, Campagner A, Ferrari D, Locatelli M, Banfi G, Cabitza F (2020) Detection of COVID-19 infection from routine blood exams with machine learning: a feasibility study. J Med Syst 44(8):135. https://doi.org/10.1007/s10916-020-01597-4
Burian E et al (2020) Intensive care risk estimation in COVID-19 pneumonia based on clinical and imaging parameters: experiences from the munich cohort. J Clin Med 9(5):1514. https://doi.org/10.3390/jcm9051514
Ceukelaire WD, Bodini C (2020) We need strong public health care to contain the global corona pandemic. Int J Health Serv 50(3):276–277
Chen X et al (2020) A diagnostic model for coronavirus disease 2019 (COVID-19) based on radiological semantic and clinical features: a multi-center study. Eur Radiol. https://doi.org/10.1007/s00330-020-06829-2
Dwivedi AK (2018) Performance evaluation of different machine learning techniques for prediction of heart disease. Neural Comput Appl. https://doi.org/10.1007/s00521-016-2604-1
Friedman N, Geiger D, Goldszmidt M (1997) Bayesian network classifiers. Mach Learn. https://doi.org/10.1002/9780470400531.eorms0099
Han Z et al (2020) Accurate screening of COVID-19 using attention-based deep 3D multiple instance learning. IEEE Trans Med Imaging 39(8):2584–2594. https://doi.org/10.1109/TMI.2020.2996256
Haq AU, Li JP, Memon MH, Nazir S, Sun R, Garciá-Magarinõ I (2018) A hybrid intelligent system framework for the prediction of heart disease using machine learning algorithms. Mob Inf Syst. https://doi.org/10.1155/2018/3860146
Joshi AV (2020) Machine learning and artificial intelligence. Springer International Publishing, Berlin
Khan AI, Shah JL, Bhat MM (2020) CoroNet: A deep neural network for detection and diagnosis of COVID-19 from chest x-ray images. Comput Methods Prog Biomed 196:105581. https://doi.org/10.1016/j.cmpb.2020.105581
Kumar R, Indrayan A (2011) Receiver operating characteristic (ROC) curve for medical researchers. Indian Pediatr. https://doi.org/10.1007/s13312-011-0055-4
Kumar Y, Sahoo G (2012) Analysis of parametric & non parametric classifiers for classification technique using WEKA. Int J Inf Technol Comput Sci. https://doi.org/10.5815/ijitcs.2012.07.06
McCall B (2020) COVID-19 and artificial intelligence: protecting health-care workers and curbing the spread. Lancet Digit Health. https://doi.org/10.1016/S2589-7500(20)30054-6
Peng M et al (2020) Artificial intelligence application in COVID-19 diagnosis and prediction. Lancet
Rajaraman S, Siegelman J, Alderson PO, Folio LS, Folio LR, Antani SK (2020) Iteratively Pruned Deep Learning Ensembles for COVID-19 Detection in Chest X-Rays. IEEE Access 8:115041–115050. https://doi.org/10.1109/ACCESS.2020.3003810
Rao ASRS, Vazquez JA (2020) Identification of COVID-19 can be quicker through artificial intelligence framework using a mobile phone-based survey in the populations when cities/towns are under quarantine. Infect Control Hosp Epidemiol. https://doi.org/10.1017/ice.2020.61
Raza K (2019) Improving the prediction accuracy of heart disease with ensemble learning and majority voting rule. In: U-Healthcare Monitoring Systems (pp. 179-196). Academic Press
Sethy PK, Behera SK, Ratha PK, Biswas P (2020) Detection of coronavirus Disease (COVID-19) based on deep features and support vector machine. Int J Math Eng Manag Sci5(4):643–651. https://doi.org/10.33889/IJMEMS.2020.5.4.052
Song Y et al (2020) Deep learning enables accurate diagnosis of Novel Coronavirus (COVID-19) with CT images. https://doi.org/10.1101/2020.02.23.20026930
Toraman S, Alakus TB, Turkoglu I (2020) Convolutional capsnet: A novel artificial neural network approach to detect COVID-19 disease from X-ray images using capsule networks. Chaos Solitons Fractals 140:110122. https://doi.org/10.1016/j.chaos.2020.110122
Worldometers (2020) COVID-19 coronavirus outbreak. Worldometers. https://www.worldometers.info/coronavirus/. Accessed 22 Aug 2020
Ye N (2003) The handbook of data mining. CRC Press, Boca Raton
Zhu N et al (2020) A novel coronavirus from patients with pneumonia in China, 2019. N Engl J Med. https://doi.org/10.1056/NEJMoa2001017
Author information
Authors and Affiliations
Corresponding author
Ethics declarations
Conflict of interest
the authors declare that they have no conflict of interest.
Additional information
Publisher’s note
Springer Nature remains neutral with regard to jurisdictional claims in published maps and institutional affiliations.
Rights and permissions
About this article

Cite this article
Arpaci, I., Huang, S., Al-Emran, M. et al. Predicting the COVID-19 infection with fourteen clinical features using machine learning classification algorithms. Multimed Tools Appl 80, 11943–11957 (2021). https://doi.org/10.1007/s11042-020-10340-7
Received:
Revised:
Accepted:
Published:
Issue Date:
DOI: https://doi.org/10.1007/s11042-020-10340-7