
Abstract
The issue of natural hazards in general and flooding in particular is a hot topic which marks memorable actions in the world and specifically in Algeria. Managing this risk is becoming more of a necessity that must include all stakeholders and all possible means available. The objective of this work is the vulnerability mapping of flood areas in the arid region Oued M’zab-region Ghardaia. It’s about implement predictive models and flood control. This allows the development of a risk prevention plan to flooding. To achieve this goal we evaluated the hazard and vulnerability. The evaluation of the risk passes by a study of the mode of rising. This study leads to the determination of the synthetic hygrogram which are taken into account under the boundary conditions upstream of a hydraulic model of the nonpermanent flows on free face. The results obtained for one period of return given constitute the risk of the floods relating to these hydrograms. The vulnerability is represented by a rate which translates the objective of protection against a probable risk. Two types of models are tested on a section of Oued M’zab-region where the data are available. Initially, are considered hydrological models (HEC-HMS 1D). In the second place of the hydraulic models (HEC-RAS 1D). After comparison of the results obtained by various simulations, the vulnerable zones are thus charted.
Introduction
The risings and the floods in the Mediterranean often originate in of the torrential rains. They are complex weather phenomena and of a great violence. In any season, the pouring rain can involve destroying risings and floods. They thus represent the most widespread catastrophes in the Mediterranean (Ballais et al. 2005). In general, the floods at the origin of more than 80 % of the natural disasters are thus recorded in the world between 1996 and 2006. They thus caused damage estimated at 500,000 people deceased and of 600 billion dollars of economic losses. So they are the natural disasters most spectacular which produce the most damage (Klijn 2008). According to the Blue Plan, 210 destroying floods touched the Mediterranean circumference these 20 last years. They struck 3,220,000 people, causing 4250 dead and economic losses which would rise with more than 25 billion euros (Em-dat, international disaster database 2004).
The forecast and the control of the damage caused by this type of disasters particularly require the identification of the vulnerable areas and the determination of the factors and the damages generated by these catastrophes (Hansson et al. 2008; Jonkman et al. 2008).
The risk of flood is regarded as being the product of the probability of occurrence of risings and the consequences caused by these events (Raaijmakers et al. 2008). By having a diagram total of the situation, it would be not only possible to manage the risk, to take the necessary measurements in order to eliminate the life losses and to limit the material losses, but also to have diversified possibilities to envisage an adapted dimensioning of the works water-supply engineering (Breton and Marche 2000).
Algeria is among the countries which are affected by risings which generally generate floods due to the overflows of the river crossing the cities and the agglomerations. These risings are of sudden appearance, often not easily foreseeable, of fast relatively significant specific flow and boarding time. They are generally related to intense rainy episodes and appear on basins of moderate size (Merabet 2006; Yahiaoui 2012).
Several catastrophes caused by its risings were listed in Algeria. The table hereafter summarizes the most significant floods that Algeria knew in the last decade (Anonymous 1 2007) (Table 1).
In Algeria particularly the arid areas are characterized by not very frequent but sometimes very significant downpours (Colombani et al. 1984; Pedro et al. 2006). These downpours often give birth to floods whose consequences are sometimes unforeseen (Hansson et al. 2008). However, the rivers in the arid areas are characterized by the irregularity of flow and a strong fluctuation hydrological (Arab et al. 2004). During the year, the intermittent flows dominate in the majority of the Wadis in these areas (Argyroudi et al. 2009). It takes place to note that this type of area whose majority of the rivers are transitory, do not have till now a global approach of treatment confirmed by several reasons. (a) The scarcity of the data which represents one handicap to study the variations of the hydrological assessment (Sivapalan et al. 2003). (b) The occasional change of the climatic and anthropic conditions which leads to an imbalance of hydrological flows and the physical characteristics of the basin (Puigdefabregas and Mendizabal 1998; Xoplaki et al. 2004; López-Moreno et al. 2007). (c) The strong variability and of the transitory events, the hydrology of the arid regions or semi-arid. What implies a strong non-linearity of the explored models (Nouh 2006; Hreiche et al. 2007; Kingumbi et al. 2007; Lajili-Ghezal 2007; McIntyre et al. 2007; Nasri 2007). (d) Space heterogeneity generates a progressive change in the hydraulic capacity. The risks of flood are confirmed (Lebdi et al. 2006).
The study of the risings in Algeria remains an unknown field. The arid and Saharan areas, suffer from lack of data, only some very specific indications can be available in the Algerian hydrological directories. The risings represent one of the fundamental features of the mode of a river of this type of area. However, the information concerning the series of risings is not available. This fact no conclusion total can be drawn.
The area of M’zab in Ghardaia in the south of Algeria represents one of these arid regions the most touched by the phenomenon of flood. This zone knew floods in 2008: the Oued M’zab, which left its bed towards 4 H of the morning has, indeed, carried everything on its passage. The damages are enormous: death of 100 people, 89 wounded, 756 damaged disaster victim families, 19 schools damaged, 7200 houses deprived of electricity and 2300 families deprived of water. More than 1200 ha of market gardening, arboricoles and of palm plantations were rolled by water. More than 1000 heads of cattle perished and more than 300 vehicles were carried by water. A manufacturing plant of batteries under licence (Tudor), employing more than 200 workmen, was completely ransacked by water. The toll of the material damages borders the 20.1 billion Dinars, that is to say more than 200 million Euros (Medejerab 2009). The cartography of the flooded zones is a tool of decision-making aid in the management of the urbanization and the development of plan ORSEC (Anonymous 2 2007). The justifications of this work are varied and those related to the social stakes consisting in ensuring the good being of the population, the economic stakes consisting in decreasing the damages caused by the floods and of the environmental stakes consisting in decreasing the impact of the floods on the people and the goods. In this work we cartography the flooded region (at the risk) in an arid region then we quote the tools of evaluation and cartography of the risks related to the floods and the sources of generated uncertainties. The estimate of the damage is done by the means of a hydrological modeling by HEC-HMS, the hydrodynamic modeling by HEC-RAS. Finally the cartography of the flooded regions and the regions at the risk of the studied region are given.
Study area
General information
The area of Ghardaïa is located at the center of the Algerian septentrional Sahara, 600 km in the south of the Algerian capital and is localised between latitude 3229′ 19.40″N and longitude 340′ 27.94″E (Fig. 1). The town of Ghardaïa, county town of wilaya as called, is located on the top of the five historical cities which counts the pentapole;”gathered cities in series on the banks of the same valley, which takes, on both sides this grouping, the name of Oued El Biod upstream, and that of Oued M’zab downstream”.

Location map of the study area
The climatic and geographical conditions make M’zab a deserted region in the northern limit of the absolute desert, which explains the scarcity of the vegetation which pushes only in edge of the wadis and on the level of the palm plantations. It is made up of herbaceous plants and shrubs belonging to the Saharan flora (Abonneau 1983; Daoudi et al. 2011). Among the trees, Abonneau (1983) quoting, bétoum (Astacia atlantica) and tarfaou (Tamarix gallica) and the shrubs are represented by the alenda (Ephedra fragilis), the arich (Calligonium commosum), the rtem (Retma retam) and the seder (Zigyphus lotus). According to the type of area, one notes the presence of a rather significant group the adventitious ones where in the sandy and dry places such as the regs. (Abonneau 1983; Zergoun 1991; Daoudi et al. 2011), announcing the following plants of Acheb:Aristida pungens (drinne) and Aristida obtusa like graminaceous most frequent, the dhamrane (Trajanum inidatum), the baguel (Haloxylon articulatum), the merkh (Genista saharae) and the cheih (Artemesia alba). Downstream from the Oued M’zab develop halophilous plants such as the guettaf (Atriplex halemus), the guedem (Salsola vermiculata), the ajrem (Anabasia articulata), the negued (Astericus graveolus) and the chaaliat (Sysimbium iris) (Abonneau 1983).
The occupation of ground shows that the majority of the activities are concentrated on the level of the valley of M’zab, which generates significant damage in case of rising (Fig. 2).

Map of soil occupation of the city of Ghardaia
For the study of the risings and flood we chose seven under basins of the large basin of the Oued M’zab. It is about under basins that are the most touched by the floods (Fig. 3). Tables 2 and 3 summarizes the principal characteristics of each sub basin.

Sub basin component basin Versant Oued M’zab-region Ghardaïa
The zone of study is primarily associated with three large wadis: Laadhira and Bou Brik Labiode of the West which meet in the place named “Amlaga”. This last is indicated in Arab language “Moultaka” with the commune of Daya Ben Dahoua to give rise to Oued M’Zab (Fig. 4).

Map of slopes of the watershed Oued M’zab-region Ghardaïa
Climate and precipitation
For the study of precipitations, we considered a pluviometric series which comprises maximum daily precipitations for the longest possible period. This series was provided by the National office of Meteorology (Anonymous 3 2010). They spread out for the period of 1975–2013. The analysis of the series indicates that the climate of the area of Ghardaïa is typically Saharien. It is characterized by two seasons: one hot and dries season (from April at September) and another moderate (from October at March). A great difference between the temperatures of the summer and the winter is observed (Table 4). It registered an annual average of 22 °C.
The precipitations in the zone of study are characterized by the fact that they fall primarily in the form of stormy showers in autumn and in spring. Some years (temporal apportionment) have an exceptional precipitation (58 mm in 1993). However, other periods are of a remarkable dryness (1992 and 1997) (Fig. 5).

Distribution of maximum daily rainfall PJ max from 1975 to 2013
The figure indicates that for the years 1979 and 1993 and 2003, the values of precipitations are maxima. The intensity curves—duration–frequency IDF are built with an aim of allowing, to synthesize pluviometric information on the level of the station representative of the zone of study. They allow, in addition to calculate the flows of project briefly and to estimate the flows of rising and of rain water and, they define the rain of project of the uniform type characterized by a constant intensity for all its duration. Curves IDF are plotted for times of return 2, 5, 10, 20, 50, 100, 1000 and 10,000 years (Fig. 6).

Curves IDF “Intensity–Duration–Frequency”
Overview of the flooding of the Oued M’zab: region Ghardaïa
The growth of the population of Ghardaïa involved an intense urbanization. This growth ran up against the constraints of the relief, in particular with the narrowness of the valley. An uncontrolled extension of the habitat in the palm plantation as in the minor bed of the Oued is observed. These phenomenon seriously modified the conditions of passage of risings and sucker in an inadmissible way the risks of destruction and major accidents related to these events. Table 5 summarizes the most significant floods as well as the principal damage, in human losses, of wounded and without shelters, caused by the risings which the valley of M’zab knew in the last decade.
The protection of the valley of M’zab against the floods requires knowledge, in addition to the flows of rising, the heights of water in the Oued M’zab for the different periods and more particularly for the periods of strong rising. Figure 7 illustrates the principal risings which touched the zone of study during 107 years. For the period (1902–2008), it thus gives the monthly distribution of the principal risings of the Oued M’zab. It is observed in particular that the extent of the risings is remarkably repeated in the month of September.

Monthly distribution of floods during a period of 107 years
The pouring rain, qualified “tsunami river”, accompanied with violent storms, began on Monday September 29, 2008, after 4 years of dryness. The bad weather gradually continued Tuesday with an average intensity. Wednesday, 1 of October was the day of Aid (the festival which marks the end of the fast among Moslems, it was the flood, with a pouring rain, adding up nearly 150 mm in 1 h. The principal wadis of the area (M’zab, Zeghir, NSA, Metlili) functioned with full mode. According to local sources, it has been the first time for 70 years which the three tributary wadis of the Oued M’zab are in rising. Usually only one of the three wadis overflows without endangering the surrounding populations. The authorities speak about a flow about 1200 m3/s. The National Agency of the Hydraulic Resources (Anonymous 4 2010) estimated the flow at 900 m3/s. This catastrophe which touched the city is bound, on the one hand, with the intensity of the risk concerned and on the other hand, with the vulnerability of the area to the floods (Medejerab 2009). The Geomorphologic analysis after the rising of October 2008, indicates a visible change of the river (Fig. 8).

Allure of rivers before and after the flood from 1st of October 2008
The zone of El Atteuf represents the most exposed zone with the effects of the floods whose consequences are catastrophic. The known zone is located at the downstream of the Oued M’zab-region Ghardaïa. This zone is characterized by weak slopes, where the flows of risings gather. It thus constitutes a vast zone of expansion of risings of the Oued M’zab. The Oued go along to El Atteuf, after filling the dams with upper waters. The Oued M’zab runs downstream from El Atteuf, by the risings of the lower wadis and especially Noumerat. In the downstream zone, the rising is fed by the lower tributaries of M’zab like Hassi Chegga.
Methods of investigation
In the objective to analyze the whole of the results relating to the phenomena of risings of the area, several methods can be used to chart the risks of flood. Generally, three principal methods can installed: historical and paleohydrologic methods (Baker et al. 1988; Benito et al. 2004), hydrogeomorphologic methods and the hydrological-hydraulics methods (Lastra et al. 2008).
Our choice was made on the last method. Thus, four stages are followed:
-
Statistical analyze of rains in the studied period.
-
Hydrological modeling based on HECHMS, thus allowing the quantification of the flow of project.
-
Hydraulic modeling based on the HECRAS allowing to determine the hygrograms of rising.
-
This modeling uses charts of the occupation of the ground and the DEM (digital elevation model) as well as the flow calculated by the HECHMS.
-
The height of rising determined by HEC RAS and the digital model of ground (DEM) give the altitude of flood to the level of the zone of study, the intersection of the plan of flood with the level of the original ground forms a horizontal plan which represents the flooded zone until to cartography of the vulnerable zones. The various steps described are represented on the Fig. 9.
Fig. 9 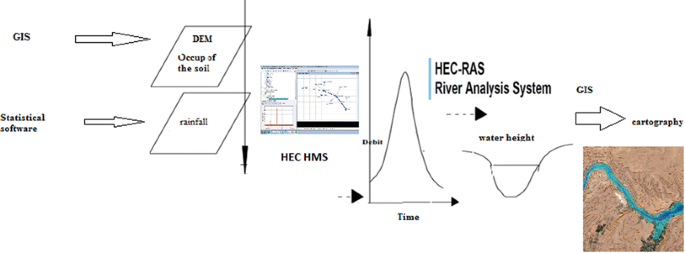
Representation of the approach used for the mapping of flood areas in Oued M’zab-region Ghardaïa

Hydrological modeling
The principle based on hydrological modeling called also model rain-flow. The latter make it possible to transform series describing the weather conditions of a catchment area (precipitations, moisture of the ground, etc.…) into a series of flows. This transformation of the rain into hydrogram of rising results in the successive application of two functions. A first function of production which determines the hyétogram of clear rain starting from the rough rain. A second function of transfer makes it possible, as for it, to determine the hydrogram of rising resulting from the clear rain (Gharbi and Soualmia 2013).
The Model HEC-HMS, is a deterministic hydrological model and conceptual HEC-HMS (Hydrologic Modeling System). This hydrological model was developed by “Hydrologic Engineering Center (HEC)” of the US Army Body of Engineers (USACE 2010). It in particular makes it possible to make leave the flow project. The module of basin includes: Subbasin; Reach; Reservoir; Junction; Diversion; Source; Outlet (Tramblay et al. 2011; Zhang et al. 2013; Andrzej 2013).
Hydraulic modeling
For hydrodynamic modeling the model HEC-RAS was considered. This model solves the problems of the flows on free surface permanent or non-permanent. It solves the equation of unidimensional energy, the losses being evaluated by the formula of friction at the bottom of Manning–Strickler and by formulas of contraction/expansion of the flow. For the quickly varied situations such as the hydraulic projections, flows near the bridges, and the junctions of river, the equation of energy is replaced by the equation of momentum. For the overflowing flows, the total section is divided into homogeneous sub-sections in terms of form and roughness (Tate and Maidment 1999). Each partial flow is calculated according to the “Divided Channel Method” using the formula of Manning–Strickler. The modeling based on HEC-RAS makes it possible to evaluate the flows and the heights of water on the whole of the sections of a river (Timbadiya et al. 2011; Prata et al. 2011).
Cartography of the flooded zones
The results obtained by HECRAS are used to chart the vulnerable zones to the flood in the Oued M’zab-region Ghardaïa. The triangulation of the digital model of the ground is necessary for the cartography of the flooded zones. By using the DEM, the height of rising determined by HEC RAS give the altitude of flood to the level of the oued M’zab. The intersection of the plan of flood with the level of the original ground forms a horizontal plan which represents the flooded zone. The flooded surface increases according to the height of rising. The followed step led to the cartography of the flooded zones. For this stage we had the recourse to several software such as: ARCGIS, GEO RAS (Fig. 10).

Triangulation of the DEM of the study area
Results and discussions
The results of the simulations carried out by HEC-HMS represent the result of a combination of several models brought into play (a model for the quantification of precipitations, a model for the calculation of the infiltration and the streamed water blade…). These results made it possible to inform about precipitations of entry and the basic flow which represents the quantity of clear rain taking part in the appearance of the hydrogram of rising. The application of HEC-HMS for the catchment area of the Oued M’ zab-region Ghardaïa made it possible to quantify the flow for each sub basin (Fig. 11).

Results for each sub basin of Oued M’zab-region Ghardaïa on HEC HMS
The simulation of the flow to the discharge system of a catchment area is significant for many applications of engineering and stock management of water, such as the forecast of the risings. The results obtained by HECHMS make it possible to build the hydrogram risings of each under basin as well as total area catchment. Figure 12 presents the hyetogram and the hydrogram at the entry of the catchment area, following the rising of October 2008. Simulation considered takes again the conditions of raw of October 2008.

Flood hydrogram simulated by HEC-HMS for each sub-basin of the study area
The flow obtained by simulation HEC-HMS is Qmax = 888.5 m3/s. By comparison with other work (Table 6), the value of the maximum capacity obtained by our simulation is comparable in particular with that of Benaouedj (2011). It is noticed that HEC-HMS reproduced well the value of the peak output Benaouedj (2011), NAHR (Anonymous 4 2010). A shift of (26 %) is observed compared to the value of Bensaha (2009). It can be explained by the fact that the simulated wave arrives slightly before the recorded wave (of about less than a 1 h. The software underestimates the speed of infiltration.
For hydraulic modeling, the boundary conditions can be defined by a height of water or a constant or variable flow in the course of time. The definition of the boundary conditions in the software HEC-RAS with a dimension is very simple. It is simply enough to inform at the same time the first profile across the section by a condition limits upstream and the last profile by the condition limits downstream. The hydraulic parameter used to define the limiting condition is regarded as constant over all the width of the profile transversely. With the upstream ends and downstream of the section considered of the Oued M’zab, the normal height of the flows is considered( (Fig. 13).

Transverse profile built and imported into “HEC-RAS”
The maximum flow obtained by simulation as well as the geometrical data of the wadi are considered for the software HEC-RAS. The injection of this constant flow will make it possible to simulate the point of rising and thus produce charts of flood. In the model HEC-RAS, the use of steady operation is very simple and especially very fast since the software provides only one result to each point.
Hydraulic modeling makes it possible to visualize the profile along the watermark and critical depth line (Fig. 14). It is noted that the watermark exceeds the dimension of the original ground what generates a flood of the banks. The digital simulations are carried out for one period of 100 years return. The model HEC-RAS shows its capacity as representation of extended of the flood and the geographical information system will make it possible to specialize well the elements exposed at this risk and by consequence to lead to a tool of decision-making integrated well.

Lengthwise profile of the water line and the critical depth line
The parametric results of simulation are given in Table 7. It comes out from these results that the heights of water vary from 2.50 to 5.00 m above the roof. An overestimate of the water level is due primarily to the reduction in the width of the Oued. In all the points of the section, the value of the number of Froude is lower than 1. The critical mode is not reached.
The step used for hydraulic modeling is illustrated in Fig. 15.

Display results by HEC-RAS
One analyzing a photo catches for the period of rising of October 2008 (Fig. 16), the heights obtained by HEC-RAS prove very close with reality.

Lengthwise profile of the water line and the critical depth line
The results so obtained by the HECRAS are injected with the Matthew negative values for altitudes of risings are thus lower than altitudes of original grounds. On the other hand, the positive values indicate that altitudes of risings are higher than those of original grounds. The difference of the heights makes it possible to carry out the DFM (Digital flood Model) and to chart the zones sensitive to the flood (Fig. 17).

Out steps for DFM and mapping of flood areas
Figure 18 represents the cartography of the flooded zones in the case of rising of October 2008. Simulation was made first for the value of the flow max: 888.5 m3/s and for a flow of 300 m3/s. This last represents the flow of the river where the lovers dams are empty.

Comparison of the results of the areas flood
It arises from the figure which if the flow max of rising is a inferior or equal 300 m3/s the risk of flood is weak. However, if the maximum flow exceeds the 300 m3/s, a overflow of the river is noted. Increased of this overflow is obviously noted for the flow max of 888.5 m3/s. The comparison with the results of the Algerian Space Agency (Anonymous 5 2010), indicates the aspect of clear similarity. This similarity is observed as for the flooded zones of the town of Ghardaïa as well as the Al area atteuf (Fig. 18).
Conclusions
Floods represent a major risk for the people and the goods. In spite of the technical tools available, the fight against the floods is always very complex because of the scarcity, of the speed, and the extent of this phenomenon. The synthesis of the risks related to the floods is based on three principal concepts: hydrological, hydrodynamic and cartographical. The hydrological study by model HEC-HMS provided, using hydrograms synthetic mono-frequency, with the hydraulic model the boundary conditions upstream. It also makes it possible to inform the socio-economic side to give an equivalent measurement to the vulnerability. For hydraulic simulation, the choice of the software HEC-RAS is conditioned by the nature of the topographic data. Indeed, this component is used as boundary condition. It is also used as cartographic component necessary to the space representation of the risk. The height of water obtained is 6 m.
The known simulation is unidimensional. The flow on free face is broken up into flow in the principal channel and flow in the active plains of flood. The method Models 1D, is a simple method. It allows in an easy way an easy determination of the extension of the submersion in characteristic points of the wadi. It is particularly well adapted along section of the wadi in which the flow progresses according to a given direction. It brings also answers the risk of flood in the event of rising. However, it requires developments which are still the object of research.
The cartography of the risk of flood is necessary to the installation of a system of assistance to management. By taking account of the global context of the catchment area, recommended installations can be thus tested and analyzed. As in the installations matters, the dynamic slow down consists in using as much solutions to slow down water mainly at the most critical periods. These periods correspond to the events of rising which are limited to a few hours or a few days. The step used in this study for the cartography of the flooded zones rests on:
-
The classification of the flooded zones by the use of photography and DEM, the investigations into ground.
-
The analysis of the historical data relative to the risings and the evaluation of occurrence frequencies of these events.
-
The study of the hydro-climatological and topographical characteristics of the concerned catchment areas.
-
The use of computer to elaborate maps/charts defining the degree of risk.
Through the obtained results, it appears clearly that the simulations made by the chosen models are encouraging. For the flood of October 2008, the comparison with the former studies and the cartography made by the Algerian Space Agency shows a perfect similarity. To generalize and examine the reliability of the approach followed, the methodology can be adapted for the use of other catchment area of arid zones.
References
Abonneau J (1983) Prehistoire du M’zab (Algérie-Wilaya de Laghouat). Université de PARIS I (Panthéon Sorbonne), Thesis for the doctorate 3rd Round in Art and Archaeology
Andrzej W (2013) Application of HEC-HMS programme for the reconstruction of a flood event in an uncontrolled basin. J Water Land Dev J Water Land Dev. 18(I–VI):13–20
Anonymous 1 (2007) G.D.C. P. Internal note on the study of the flooding of the city of Ghardaia. General Directorate of Civil Protection rection Générale de la Protection Civile. Natural Hazards Bureau. Floods in Algeria, p 21. Available on the website of the Directorate General of Civil Protection, Algeria
Anonymous 2 (2007) ORSEC. Plan for the prevention and protection against flood risk. Internal report. Ghardaia, Algeria
Anonymous 3 (2010) NMO National Meteorological Office. Internal report
Anonymous 4 (2010) NAHR. Note on the study of the water table of the M’zab Valley. National Agency of Hydraulic Resources of Ouargla, Algeria
Anonymous 5 (2010) ASAL. Algerian Space Agency study of Flood plain Mapping Area of Ghardaïa
Arab A, Lek S, Lounaci A, Park YS (2004) Spatial and temporal patterns of benthic invertebrate communities in an intermittent river (North Africa). Ann Limnol Int J Lim 40:317–327
Argyroudi A, Chatzinikolaou Y, Poirazidis K, Lazaridou M (2009) Do intermittent and ephemeral mediterranean rivers belong to the same river type? Aquat Eco 43:465–476
Baker VR, Kochel RC, Patton PC (1988) Flood geomorphology. Wiley Interscience, Toronto
Ballais JL, Garry G, Masson M (2005) Contribution of hydrogeomorphological method to flood hazard assessment: the case of French Mediterranean region. CR Geosci 337(13):1120–1130
Benaouedj A (2011) Contribution à l’étude des inondations dans la vallée du M’zab (Wilaya de Ghardaïa). University of de Blida, Algeria
Benito G, Lang M, Barriendos M, Llasat C, Francés F, Ouarda T, Thorndycraft V, Enzel Y, Bardossy A, Cœur D, Bobée B (2004) Use of systematic, paleoflood and historical data for the improvement of flood risk estimation. Rev Sci Methods Nat Hazards 31:623–643
Bensaha H (2009) Gestion de périmètres de mise en valeur agricole, cas de la chebka du M’zab. thèse de magister. ITAS, UKM, Ouargla (Algeria), p 125
Breton C, Marche C (2000) Une aide à la décision pour le choix des interventions en zone inondable. Rev Sci Eau 14(3):363–379
Colombani J, Olivry JC, Kallel R (1984) Phénomènes exceptionnels d’érosion et de transport solide en Afrique aride et semi-aride. Challenges in African hydrology and water resources (proceedings of the Harare symposium). IAHS Publ. no. 144
Daoudi NS, Boussoualim A, Lamraoui S, Khelifi L, Mestoul D, Adolphe L, Bensalem R (2011) Environnements oasiens: vulnérabilité et capacité d’adaptation face aux changements climatiques. Journées scientifiques du 2IE. 4–8 Avril 2011. Campus de l’Ouagadougou
Em-dat, International disaster database (2004) Centre for Research on the Epidemiology of Disasters (CRED). Office of US Foreign Disaster Assistance (OFDA) (in french)
Gharbi M, Soualmia A (2013) Prévision des crues éclair au niveau du bassin versant de la Medjerda. 11ème congrès de mécanique, Agadir, Maroc
Hansson K, Danielson M, Ekenberg L (2008) A framework for evaluation of flood management strategies. J Environ Manag 86:465–480
Hreiche A, Najem W, Bocquillon C (2007) Hydrological impact simulations of climate change on Lebanese coastal rivers. Hydrol Sci J 52(6):1119–1133
Jonkman SN, Bočkarjova M, Kok M, Bernardini P (2008) Integrated hydrodynamic and economic modelling of flood damage in the Netherlands. Ecol Econ 66:77–90
Kingumbi A, Bargaoui Z, Ledoux E, Besbes M, Hubert P (2007) Modélisation hydrologique stochastique d’un bassin affecté par des changements d’occupation: cas du Merguellil en Tunisie centrale. Hydrol Sci J 52(6):1232–1252. doi:10.1623/hysj.52.6.1232
Klijn T (2008) Flash flood warning based on rainfall thresholds and soil moisture conditions. J Hydrol 362:120–121
Lajili-Ghezal L (2007) Elaboration d’un modèle d’érosion hydrique à la parcelle (PLAG) et son application pour l’estimation des apports en sédiments en zone semi-aride tunisienne. Hydrol Sci J 52(6):1285–1297
Lastra J, Fernández E, Díez-Herrero A, Marquínez J (2008) Flood hazard delineation combining geomorphological and hydrological methods: an example in the Northern Iberian Peninsula. Nat Hazards 45:277–293
Lebdi F, Fdhila MK, Hzami A (2006) Modélisation de la dynamique fluviale de la Medjerda: impact de l’évolution morphologique du lit sur l’écoulement. In: The Future of Drylands, Side event Hydrological changes in arid and semiarid areas under climatic and human influences: focus on the Mediterranean region (Int. Conf., Tunis, Tunisia, 21 June 2006)
López-Moreno JI, Begueria S, Vicente-Serrano SM, García-Ruiz JM (2007) Influence of the North Atlantic Oscillation on water resources in central Iberia: precipitation, streamflow anomalies, and reservoir management strategies. Water Resour Res 43:W09411
McIntyre N, Al-Qurashi A, Wheater H (2007) Regression analysis of rainfall–runoff data from an arid catchment in Oman. Hydrol Sci J 52(6):1103–1118
Medejerab (2009) Les inondations catastrophiques du mois d’octobre 2008 à Ghardaïa. Geographia Technica Numéro spécial 311–316
Merabet A (2006) Etude de la protection de la ville de Sidi Bel Abbés contre les inondations. Mémoire de Magister, University of Djilali Liabes-Sidi Bel Abbés, Algeria
Nasri S (2007) Caractéristiques et impacts hydrologiques de banquettes en cascade sur un versant semi-aride en Tunisie centrale. Hydrol Sci J 52(6):1134–1145
Nouh M (2006) Wadi flow in the Arabian Gulf states. Hydrol Process 20:2393–2413
Pedro F, Maltchik L, Bianchini JI (2006) Hydrologic cycle and dynamics of aquatic macrophytes in two intermittent rivers of the semi-arid region of Brazil. Braz J Biol 66(2B):575–585
Prata D, Marins M, Sobral B, Conceição A, Vissirini F (2011) Flooding analisys, using HEC-RAS modeling for Taquaraçu river, in the Ibiraçu city, Espírito Santo, Brazil. 12nd International Conference on Urban Drainage, Porto Alegre/Brazil, 11–16 September 2011
Puigdefabregas J, Mendizabal T (1998) Perspectives on desertification: western Mediterranean. J Arid Environ 39:209–224
Raaijmakers R, Krywkow J, van der Veen A (2008) Flood risk perceptions and spatial multi-criteria analysis: an exploratory research for hazard mitigation. Nat Hazards 46(3):307–322
Sivapalan M, Takeuchi K, Franks SW, Gupta VK, Karambiri H, Lakshmi V, Liang X, McDonnell JJ, Mendiodo EM, O’Connell PE, Oki T, Pomeroy JW, Schertzer D, Uhlenbrook S, Zehe E (2003) IAHS decade on predictions in ungauged basins (PUB), 2003–2012: shaping an exciting future for the hydrological sciences. Hydrol Sci J 48(6):857–880. doi:10.1623/hysj.48.6.857.51421
Tate E, Maidment D (1999) Floodplain mapping using HEC-RAS and ArcView GIS. CRWR Online Report 99-1
Timbadiya PV, Patel PL, Porey PD (2011) Calibration of HEC-RAS model on prediction of flood for lower Tapi River, India. J Water Resour Protect 3:805–811
Tramblay Y, Bouvier C, Ayral PA, Marchandise A (2011) Impact of rainfall spatial distribution on rainfall-runoff modelling efficiency and initial soil moisture conditions estimation. Nat Hazards Earth Syst Sci 11:157–170
USACE (2010) Hydrologic Modeling System HEC-HMS. Technical reference manual version 3.5. US Army Corps of Engineers, Hydrologic Engineering center, Davis, CA
Xoplaki E, Gonzalez-Rouco JF, Luterbacher J, Wanner H (2004) Wet season Mediterranean precipitation variability: influence of large-scale dynamics and trends. Clim Dyn 23:63–78
Yahiaoui A (2012) Inondations Torrentielles: Cartographie des zones vulnérables en Algérie du nord (Cas de l’oued Mekerra, Wilaya de Sidi Bel Abbès). Thesis for the doctorate
Zergoun Y (1991) Contribution à l’étude bioécologique des peuplements orthoptérologiques dans la région de ghardaia. Thèse agro. Inst. nat. agro., El Harrach, p 73
Zhang HL, Wang YJ, Wang YQ, Li DX, Wang XK (2013) The effect of watershed scale on HEC-HMS calibrated parameters: a case study in the Clear Creek watershed in Iowa. US Hydrol Earth Syst Sci 17:2735–2745
Author information
Authors and Affiliations
Corresponding author
Rights and permissions
About this article

Cite this article
Yamani, K., Hazzab, A., Sekkoum, M. et al. Mapping of vulnerability of flooded area in arid region. Case study: area of Ghardaïa-Algeria. Model. Earth Syst. Environ. 2, 147 (2016). https://doi.org/10.1007/s40808-016-0183-x
Received:
Accepted:
Published:
DOI: https://doi.org/10.1007/s40808-016-0183-x