


Introduction
A guild of wild species of Felidae comprising various combinations of up to eight species (Macdonald et al., Reference Macdonald, Loveridge, Nowell, Macdonald and Loveridge2010) is distributed across South-east Asia, with species ranging in size from the tiger Panthera tigris to the flat-headed cat Prionailurus planiceps. Little is known of the ecology of most of these species, and less of their guilds. Amongst the least known is the clouded leopard Neofelis nebulosa, a potent ambassador species for conservation (Macdonald et al., unpubl. data) that occurs from the Himalayan foothills and eastwards to Indochina, between which Myanmar serves as a biogeographical land bridge. The species occupies areas undergoing some of the most rapid deforestation (Hansen et al., Reference Hansen, Potapov, Moore, Hancher, Turubanova and Tyukavina2013), and is threatened by poaching and wildlife trafficking (D'Cruze & Macdonald, Reference D'Cruze and Macdonald2015; Nijman & Shepherd, Reference Nijman and Shepherd2015; Min et al., Reference Min, D'Cruze and Macdonaldin press). Clouded leopards are the apex predators in many South-east Asian rainforests, although where they co-occur with larger predators such as tigers their density and habitat use may vary (Sunquist & Sunquist, Reference Sunquist and Sunquist2002; Sunarto et al., Reference Sunarto, Kelly, Parakkasi and Hutajulu2015). Although there have been discoveries regarding the felid guilds and habitat use of the Sunda clouded leopard Neofelis diardi (Haidir et al., Reference Haidir, Dinata, Linkie and Macdonald2013; Sollmann et al., Reference Sollmann, Linkie, Haidir and Macdonald2014; Hearn et al., Reference Hearn, Ross, Bernard, Bakar, Goossens, Hunter and Macdonald2017; Macdonald et al., unpubl. data), and the threat to the species from habitat loss (Cushman et al., Reference Cushman, Macdonald, Landguth, Malhi and Macdonald2017), little is known for the mainland clouded leopard and the felids with which it is sympatric.
In Myanmar the density of clouded leopards has not been estimated; however, of the 17 areas of the country surveyed (by camera trapping) for tigers during 1999–2002, clouded leopards were found in 10 areas and tigers in three (Myanmar Forest Department, 2003). In 2004 clouded leopards were recorded in three mountainous regions of northern Myanmar where they had not been recorded previously (Zaw et al., Reference Zaw, Myint, Htun, Po, Latt, Maung and Lynam2014), and at a fourth site in the south (WCS, 2015, unpubl. data). Clouded leopards have also been confirmed in several locations in the east of the country (Moo et al., Reference Moo, Froese and Gray2017). Among the northern sites, Htamanthi Wildlife Sanctuary is particularly important because of its proximity to the Northern Forest Complex. This vast contiguous forest landscape (93,685 km2), probably the largest in Asia, lies in a transition zone of three biodiversity hotspots, all of which contain clouded leopards and tigers: Himalaya, Indo-Burma and the Mountains of Southwest China (Myers et al., Reference Myers, Mittermeier, Mittermeier, da Fonseca and Kent2000; Conservation International, 2011).
As part of a range-wide camera-trapping study of the clouded leopard and members of its guild we deployed camera traps in two catchments within the Htamanthi Wildlife Sanctuary over 2 consecutive years. Htamanthi Wildlife Sanctuary is the southernmost Key Biodiversity Area of the Northern Forest Complex (also Tiger Conservation Landscape 37, GTRP, 2010).
Study area
Htamanthi Wildlife Sanctuary (2,151 km2) is one of the largest protected areas in the region, located between the Chindwin and Uru Rivers in north-western Myanmar (Fig. 1). The area is characterized by tropical evergreen forest, with some mixed deciduous forest in the western portion and dry mixed deciduous forest types along the eastern boundary (Arino et al., Reference Arino, Ramos Perez, Kalogirou, Bontemps, Defourny and Van Bogaert2012). The area was gazetted for its megafauna, including the Asian elephant Elephas maximus, tiger, gaur Bos gaurus, Asiatic black bear Ursus thibetanus, sun bear Helarctos malayanus and clouded leopard. Seven streams flow in parallel from the eastern and north-eastern hills to the western and south-western part of the Sanctuary, and most from the eastern side can be navigated by boat throughout the year, except for their upper reaches in the driest parts of summer. There are three main footpaths connecting villages on the west and east sides of the Sanctuary. There are four management zones, Nam Phi Lin, Nam E Zu, Nam Pa Gon and Nam Yan Yin; this study was conducted in an area of 149 km2 in Nam Pa Gon and of 136 km2 in Nam E Zu.
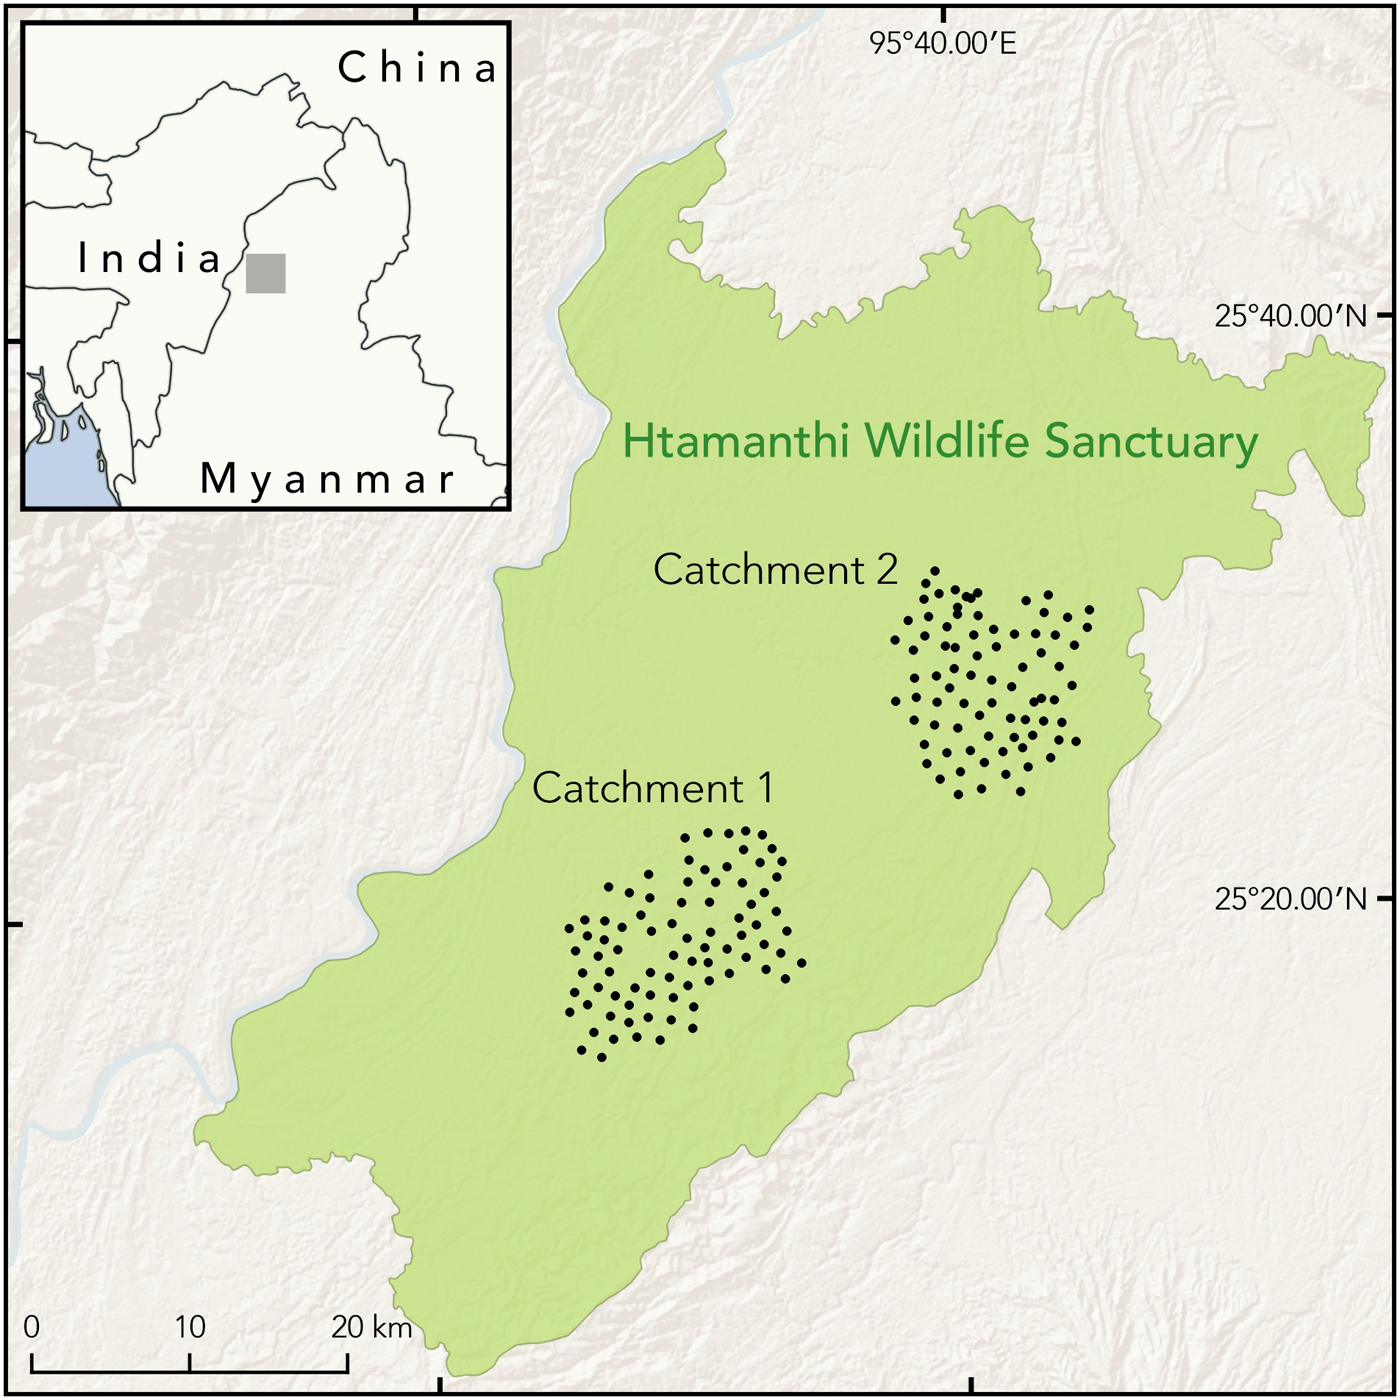
Fig. 1 Locations of camera traps in Catchments 1 and 2 of Htamanthi Wildlife Sanctuary, in north-western Myanmar.
Methods
Camera trapping
We used two models of passive infrared digital camera traps (Cuddeback, Non Typical Inc., De Pere, USA, and ScoutGuard, HCO Outdoor Products, Norcross, USA). During 1 December 2014–13 March 2015 we deployed 82 camera stations in Catchment 1, Nam Pa Gon, with 1.0–1.5 km between camera stations. During 3 December 2015–23 March 2016 we deployed 80 camera stations in Catchment 2, Nam E Zu, with similar spacing. At each station we used unbaited, paired camera traps, set at c. 45 cm height from ground level and c. 3.5 m either side of the trail.
Analysis
We estimated population densities of tigers, clouded leopards and marbled cats, using a spatially explicit capture–recapture model implemented within a Bayesian framework using the package SPACECAP v. 1.1.0 (Gopalaswamy et al., Reference Gopalaswamy, Royle, Hines, Singh, Jathanna, Kumar and Karanth2012) in R v 3.3.1 (R Development Core Team, 2016). Individual identification was carried out by at least two people, and detection histories for each individual were then constructed. We considered each 24-hour period to be a sampling occasion, as short sampling intervals can improve the precision of estimates in spatially explicit capture–recapture analyses (Goldberg et al., Reference Goldberg, Tempa, Norbu, Hebblewhite, Mills, Wangchuk and Lukacs2015). To assume we were surveying a demographically closed population we used a 90-day survey period for tigers and clouded leopards. Marbled cats are smaller and therefore may have a higher population turnover, so we subsampled a 60-day period that maximized detections for marbled cats. For clouded leopards we explored the consequences of adopting a 60-day period, again subsampled to maximize detections. These are similar or shorter durations compared with other estimates of population density, justifying the assumed sampling of a closed population (e.g. Brodie & Giordano, Reference Brodie and Giordano2012; Wilting et al., Reference Wilting, Mohamed, Ambu, Lagan, Mannan, Hofer and Sollmann2012; Mohamed et al., Reference Mohamed, Sollmann, Bernard, Ambu, Lagan and Mannan2013; Hearn et al., Reference Hearn, Ross, Bernard, Bakar, Hunter and Macdonald2016). We constructed the state space by adding a buffer to the coordinates of the outermost camera stations, using ArcMap 10.3 (ESRI, Redlands, USA). We then added potential activity centres by generating regularly spaced points with a resolution of 0.25 km2 (tigers and clouded leopards) or 0.16 km2 (marbled cats) within this buffer. Each activity centre was designated either habitat or non-habitat, based on local knowledge of the area. As land outside the boundaries of the park is largely agricultural and human presence is high, we designated all activity centre points falling outside the park as non-habitat. We increased the size of the state space during preliminary analyses until the probability of detection at the edge of the state space became negligible. We determined that a buffer of 20 km was sufficient for clouded leopards and tigers, and a buffer of 12 km was appropriate for marbled cats. For all analyses we ran SPACECAP with trap response absent, half normal detection function, 100,000 iterations and a thinning rate of 1. In SPACECAP parameter convergence is assessed using Geweke z scores; values between –1.64 and 1.64 are considered to be acceptable. We increased the burn-in (the number of initial iterations discarded during the analysis) during preliminary runs until the Geweke z scores fell within this range. The upper limit to the population size within the state space is set by the data augmentation value. We increased this value until ψ (the ratio of the estimated abundance within the state space to the maximum defined by the data augmentation value) was ≤ 0.8. For Catchment 1 we ran the clouded leopard data with a burn-in of 10,000 for the 90-day peirod and 30,000 for the 60 day period. The tiger data were run with a burn-in of 20,000. The data augmentation value was set to 60 for both species. For Catchment 2 we ran the clouded leopard data with a burn-in of 30,000 and data augmentation of 150 for both the 90- and 60-day periods. The marbled cat data were run with a burn-in of 30,000 and data augmentation of 210. We compared clouded leopard densities between catchments, and following Sollmann et al. (Reference Sollmann, Linkie, Haidir and Macdonald2014) we considered a difference to be significant if the 95% highest posterior density of one did not include the mean of the other.
As Asiatic golden cats do not have patterned coats they are not reliably identifiable to individual, and therefore population densities cannot be estimated using these methods. For golden cats, leopard cats and potential felid prey detected by the cameras we calculated the number of independent detections and naïve occupancy, which was calculated as the proportion of camera stations at which the species was detected.
Results
We detected all three focal species in both catchments, but detection frequencies and naïve occupancies varied greatly (Tables 1 & 2). In Catchment 1 we were able to identify 100% of the tiger photographs, 83.8% of clouded leopard photographs and 91.7% of marbled cat photographs to individual. Given the limited number of re-detections of marbled cats it was not possible to model these data, and the values are included for comparison only.
Table 1 Survey effort and number of sampling occasions at the two study sites (Catchments 1 and 2) in Htamanthi Wildlife Sanctuary, in north-western Myanmar (Fig. 1), with numbers of independent detections of clouded leopards Neofelis nebulosa, tigers Panthera tigris and marbled cats Pardofelis marmorata, numbers of individuals detected and number of detections per individual.
Table 2 The total number of independent detections, detection rate, and naïve occupancies for felid species and potential prey species of tigers and clouded leopards at the two study sites (Catchments 1 and 2) in Htamanthi Wildlife Sanctuary, in north-western Myanmar (Fig. 1).
* The number of independent detections per 100 trap days
The spatially explicit capture–recapture posterior summaries of the model parameter values are in Table 3. The Bayesian p-values indicated that the models were of adequate fit, and the Geweke z scores indicated that all model parameters converged. The estimated density for clouded leopards in Catchment 1 derived from the 90-day period is 0.60 ± SD 0.24 individuals per 100 km2 and from the 60-day period 0.62 ± SD 0.24 individuals per 100 km2. For tigers the density estimate is 0.81 ± SD 0.40 individuals per 100 km2.
Table 3 Posterior summaries of the model parameters from SPACECAP for each analysis from Catchments 1 and 2.
*σ, movement parameter; λo, baseline trap encounter rate; Ψ, the ratio of the estimated abundance within the state space to the maximum allowable number set by the data augmentation value; N, number of individuals in the state space; D, density (individuals per 100 km2)
In Catchment 2 we were able to identify 100% of the tiger photographs, 79% of clouded leopard photographs and 72% of marbled cat photographs to individual. The clouded leopard population density was significantly higher than in Catchment 1, with estimates of 3.05 ± SD 1.03 and 3.15 ± SD 1.13 individuals per 100 km2 from the 90- and 60-day periods, respectively. The population density of marbled cats was 8.75 ± SD 2.6 individuals per 100 km2. There were too few tiger detections to estimate population density (Table 3).
Discussion
We present the first population density estimates for the clouded leopard and marbled cat in Myanmar. We found that 60- and 90-day periods for clouded leopards yielded almost identical results, and we are confident that surveying for 90 days is appropriate to assume the population is closed.
Numbers and population densities of tigers
Given the substantial difference in tiger numbers detected between the surveys of Catchments 1 and 2, although only a year apart and separated by < 20 km, it is not useful to calculate a mean from the aggregated data. However, had we extrapolated from the estimated population density in Catchment 1 this would have yielded an estimate of 16 tigers (range 10–30 tigers) in the Htamanthi Wildlife Sanctuary, similar to the estimate of 15 by Rabinowitz et al. (Reference Rabinowitz, Schaller and Uga1995) and within the wide range of densities (0.2–2.2 tigers per 100 km2) estimated in the Hukaung Valley (Lynam et al., Reference Lynam, Rabinowitz, Myint, Maung, Latt and Po2009). Such an extrapolation might have seemed warranted in the light of observations of field signs and prey, and the relative abundance of the tiger's preferred prey, the Eurasian wild pig Sus scrofa, the gaur and the barking deer Muntiacus vaginalis (Hayward et al., Reference Hayward, Jędrzejewski and Jêdrzejewska2012; Ngoprasert et al., Reference Ngoprasert, Lynam, Sukmasuang, Tantipisanuh, Chutipong and Steinmetz2012). During January 2013–January 2014 the Wildlife Conservation Society's biological monitoring team (monitoring the eastern hoolock gibbon Hoolock leuconedys), SMART (Spatial Monitoring and Reporting Tool) patrol teams and a community-based natural resource management team confirmed that tigers were present from the southern buffer zone to the northern boundary of the Sanctuary (60–80 km). However, the results from Catchment 2 suggest that the tiger population density may be significantly lower than in Catchment 1, and we consider possible explanations for this below. Our estimates of tiger population densities are presented in the context of methodologically comparable estimates elsewhere in South-east Asia in Table 4.
Table 4 Published estimates of tiger population density based on the use of spatially explicit techniques.

* Data are not available.
Abundance and population densities of clouded leopards
With no previous data on clouded leopard numbers in the Sanctuary we cannot assess whether their abundance has changed, but we present our data for comparison with methodologically comparable studies for other populations of N. nebulosa and N. diardi in Table 5.
Table 5 Published estimates of clouded leopard population density based on the use of spatially explicit techniques.
* Data are not available.
Population density of marbled cats, and naïve occupancy of other felids and potential prey
Marbled cats are little studied and there are only two other estimates for comparison. Hearn et al. (Reference Hearn, Ross, Bernard, Bakar, Hunter and Macdonald2016) found densities of 7.1–19.57 individuals per 100 km2, depending on study area, and Singh & Macdonald (Reference Singh and Macdonald2017) report densities of 5.03 individuals per 100 km2. Our results are in line with these estimates. Our naïve occupancy estimates for felids are comparable to those reported in previous studies; for example, Haidir et al. (Reference Haidir, Dinata, Linkie and Macdonald2013) found that the naïve occupancy of golden cats in Sumatra was 0.42, and for Sunda clouded leopards was 0.38. The occupancy of ungulates has been little studied in South-east Asia, but Gray & Prum (Reference Gray and Prum2012) reported a naïve occupancy of 0.16 for gaur in Cambodia. This is similar to our result of 0.15 in Catchment 2. Gray (Reference Gray and Prum2012) also reported that tiger abundance was also very low in the same area of Cambodia, which suggests that low numbers of gaur may be limiting tiger populations in these areas.
Guild compositions and explanations for differences between Catchments 1 and 2
Felid species and other mammalian carnivores occur throughout South-east Asia in various combinations. These guilds offer the opportunity to study the ecological processes of guild dynamics and, specifically, potential competition between the member species. A plausible hypothesis for wild felids, and one for which there is strong evidence amongst the Canidae (Macdonald & Sillero-Zubiri, Reference Macdonald, Sillero-Zubiri, Macdonald and Sillero-Zubiri2004), is that competition from larger species of felids will be inimical to somewhat smaller species within a guild, and that this in turn could result in mesopredator release for yet smaller species. This does not appear to be the case on Sumatra, where the Sunda clouded leopard co-occurs with tigers. Density estimates from Sumatra (Sollmann et al., Reference Sollmann, Linkie, Haidir and Macdonald2014) and Borneo (Brodie & Giordano, Reference Brodie and Giordano2012; Wilting et al., Reference Wilting, Mohamed, Ambu, Lagan, Mannan, Hofer and Sollmann2012; Hearn et al., Reference Hearn, Ross, Bernard, Bakar, Goossens, Hunter and Macdonald2017) are broadly similar, suggesting that tigers are not a limiting factor for clouded leopards on Sumatra.
Our comparison of Catchments 1 and 2 provides the opportunity to evaluate the number of clouded leopards where tigers were relatively abundant and where they were less so. The difference in estimated population density of clouded leopards (0.6 individuals per 100 km2 in Catchment 1 compared to 3.05 individuals per km in Catchment 2) is in line with the prediction of the intra-guild hostility hypothesis.
These comparisons raise the question of why there were markedly fewer tigers in Catchment 2 than in Catchment 1, and what other factors might underlie the different guild dynamics observed between these surveys. Three obvious, and not mutually exclusive, hypotheses are that (1) there was a difference in habitat or prey availability, or some other environmental variable, between the two sites, (2) conditions changed between the two survey periods, or (3) some other factor, such as an anthropogenic impact, caused the differences in felid guild structure, either directly or indirectly. Given that the two catchments are separated by < 20 km and seem generally similar, the habitat hypothesis is unpromising. However, two large prey species, gaur and serow Capricornis milneedwardsii, were detected less frequently in Catchment 2 (Table 2). The temporal change hypothesis is also unpromising, given that the two surveys were separated by barely 12 months. However, the third hypothesis, that Catchment 2 was subject to damaging human activity, is strongly supported. SMART patrols and incidental observations in 2013 indicated that although there were human incursions in both areas, incidents of gold mining were 14 times higher in Catchment 2 than in Catchment 1, and > 80 snares were removed from Catchment 2 compared with 0 in Catchment 1 for a similar patrol effort.
Human presence could influence the mammalian community structure in several ways. People may engender fear amongst both felids and their prey (e.g. Oriol-Cotterill et al., Reference Oriol-Cotterill, Macdonald, Valeix, Ekwanga and Frank2015a,Reference Oriol-Cotterill, Valeix, Frank, Riginos and Macdonaldb), and may affect tigers directly by killing them, and indirectly by killing their prey (the absence of gaur and serow may be a case in point and, being big prey, may affect the biggest felids); another possibility is that the domestic stock trafficked through the protected area could transmit disease to the wild ungulates.
The anthropogenic hypothesis is sufficiently compelling, and has such serious implications for conservation, that it merits further investigation as a priority. Rabinowitz et al. (Reference Rabinowitz, Schaller and Uga1995) cautioned that the populations of tigers and gaur were at risk of elimination if threats prevailing at the time were not controlled, and we suspect this warning is now even more pressing.
The Yawbawmee Corridor
The National Tiger Survey (1999–2002) confirmed the presence of tigers in Hukaung Valley, Upper Chindwin, Htamanthi in northern Myanmar, and Tenasserim Hills in the south. Our findings emphasize the importance of Htamanthi within the northern Myanmar landscape. To the immediate north of Htamanthi lies the Yawbawmee Corridor, 3,213 km2 of currently unprotected forest, which could link Htamanthi with Hukaung Valley Wildlife Sanctuary (Fig. 2). The gazettement of this corridor would substantially increase the connectivity of the protected areas of the Northern Forest Complex and would deliver a substantial contribution to landscape-level conservation of felids and other threatened species in the region.
Fig. 2 Location of Htamanthi Wildlife Sanctuary in relation to Hukaung Valley Wildlife Sanctuary and other protected areas in the north of Myanmar.
Acknowledgements
The survey was funded jointly by a grant to DWM from Partnership for Change and by Wildlife Conservation Society (WCS) Myanmar, with support and coordination from Htamanthi Wildlife Sanctuary, Nature Wildlife Conservation Division, Myanmar Forest Department. We thank Dr Nyi Nyi Kyaw, Director General of Myanmar Forest Department, and U Win Naing Thaw, Director of the Nature Wildlife Conservation Division under the Ministry of Natural Resources and Environmental Conservation, for granting permission and supporting the project; Htamanthi Park Warden U Khin Maung Hla and park rangers for logistical support to our field team; the survey team members for their tireless effort and dedication; WCS Myanmar Country Director U Than Myint, Northern Forest Complex Coordinator U Than Zaw and staff for support throughout the project; and Cedric Tan and two anonymous reviewers for their valuable inputs. DWM gratefully acknowledges grants from the DASSK Trust and the Irrawaddy Policy Exchange for the training of Myanmar conservationists and support of our clouded leopard programme. We thank the Recanati-Kaplan Foundation, Panthera and Robertson Foundation for their wider support of WildCRU.
Author contributions
DWM, DB and SH conceived the study. DWM, SH and HN designed the study and HN collected the data. JR and HN conducted data analysis. DWM, DB, JR, SH and HN wrote the article.
Biographical sketches
Hla Naing is field coordinator of WildCRU's clouded leopard programme in Myanmar. Joanna Ross’s research focuses on the conservation of members of the Bornean felid guild, and their spatial ecology. Dawn Burnham is a member of WildCRU's conservation geopolitics research group, with a particular focus on conservation ethics. Saw Htun is WCS's Deputy Country Director in Myanmar. David W. Macdonald has a background in behavioural ecology, and is running several long-term and wide-ranging conservation programmes with an emphasis on carnivores and interdisciplinarity.


