


1 Introduction
The flow around blunt bluff bodies is relevant to many industrial fields, in particular the aerodynamics of ground vehicles including cars, trucks and trains. Developing technology to manipulate such flows so as to reduce their aerodynamic drag is a rapidly emerging area of interest. For squareback vehicles, the majority of aerodynamic drag is associated with the boundary layer separating upon passing the rear edges to create a complex low-pressure wake. Identifying and understanding the large coherent wake structures and topology of the wake are therefore fundamental to identifying the main sources of drag and informing drag-reduction strategies.
Recent work has identified symmetry breaking behaviour in the wakes of three-dimensional (3D) blunt bluff bodies such as disks (Ormières & Provansal Reference Ormières and Provansal1999; Fabre, Auguste & Magnaudet Reference Fabre, Auguste and Magnaudet2008) and more recently the Ahmed body (Grandemange, Gohlke & Cadot Reference Grandemange, Gohlke and Cadot2013a ,Reference Grandemange, Gohlke and Cadot b ). The symmetry breaking first occurs at low, laminar Reynolds numbers – this can be predicted by weakly nonlinear analysis of the Navier–Stokes equations (Meliga, Chomaz & Sipp Reference Meliga, Chomaz and Sipp2009) and has been observed experimentally (Grandemange, Cadot & Gohlke Reference Grandemange, Cadot and Gohlke2012). A very recent finding is that the asymmetry then persists to high, turbulent Reynolds numbers (Grandemange et al. Reference Grandemange, Gohlke and Cadot2013a ,Reference Grandemange, Gohlke and Cadot b ; Rigas et al. Reference Rigas, Oxlade, Morgans and Morrison2014). It appears that the turbulent flow fluctuations cause the wake to switch between asymmetric states with slow, random time scales, resulting in multi-stability (Rigas et al. Reference Rigas, Oxlade, Morgans and Morrison2014, Reference Rigas, Morgans, Brackston and Morrison2015) or bi-stability (Grandemange et al. Reference Grandemange, Gohlke and Cadot2013a ,Reference Grandemange, Gohlke and Cadot b ), also known as bi-modality. Thus, the symmetry breaking that occurs at low Reynolds numbers is highly relevant to the wake dynamics at turbulent Reynolds numbers.
The recent experimental study of Grandemange et al. (Reference Grandemange, Cadot and Gohlke2012) investigated the flow past a simplified vehicle geometry known as the Ahmed body (Ahmed, Ramm & Faltin Reference Ahmed, Ramm and Faltin1984), where the authors identified a scenario of symmetry breaking bifurcations as the Reynolds number based on height,
 $Re_{H}$
, increases. At
$Re_{H}$
, increases. At
 $Re_{H}=365$
, the Ahmed body wake changes from steady symmetric to unsteady. Then after a brief transient state, during which the flow is symmetric, the wake flips to one side and becomes steady and asymmetric. As the Reynolds number is increased past
$Re_{H}=365$
, the Ahmed body wake changes from steady symmetric to unsteady. Then after a brief transient state, during which the flow is symmetric, the wake flips to one side and becomes steady and asymmetric. As the Reynolds number is increased past
 $Re_{H}=415$
, the wake again becomes unsteady, but maintains asymmetry.
$Re_{H}=415$
, the wake again becomes unsteady, but maintains asymmetry.
Investigations into the symmetry breaking of blunt bluff body wakes has, so far, been primarily experimental, supplemented by modelling. No numerical studies have thus far identified these symmetry breaking states. The present work performs, we believe, the first numerical investigation into the sequence of symmetry breaking bifurcations that occurs at low Reynolds number, successfully reproducing the experimental results of Grandemange et al. (Reference Grandemange, Cadot and Gohlke2012). These simulations provide access to the full 3D flow field, allowing a more detailed investigation into the destabilising dynamics associated with symmetry breaking of the wake, and providing further insight into wake topology. Finally, a practical feedback control strategy to reduce the form drag of the Ahmed body is implemented. Using the dynamic mode decomposition (Schmid Reference Schmid2010), the effect of the controller on the wake modes is studied.
2 Numerical simulations
The Ahmed body (Ahmed et al. Reference Ahmed, Ramm and Faltin1984) is a commonly used simplified test geometry for studying road vehicle flows. The squareback version of it in the presence of a stationary ground was simulated in this work, as shown in figure 1. The specifics of the geometry exactly replicated the dimensions, aspect ratio and the ground clearance used by Grandemange et al. (Reference Grandemange, Cadot and Gohlke2012).
Large eddy simulations (LES) were performed, at various low Reynolds numbers:
 $310<Re_{H}<435$
. At these Reynolds numbers the boundary layers and separation are laminar. All simulations were carried out using an in-house finite-volume incompressible LES solver StreamLES (Lardat & Leschziner Reference Lardat and Leschziner1998) which has previously been used for high-fidelity bluff body flow simulations (Dahan, Morgans & Lardeau Reference Dahan, Morgans and Lardeau2012). The computational domain was chosen to be consistent with the ERCOFTAC guide:
$310<Re_{H}<435$
. At these Reynolds numbers the boundary layers and separation are laminar. All simulations were carried out using an in-house finite-volume incompressible LES solver StreamLES (Lardat & Leschziner Reference Lardat and Leschziner1998) which has previously been used for high-fidelity bluff body flow simulations (Dahan, Morgans & Lardeau Reference Dahan, Morgans and Lardeau2012). The computational domain was chosen to be consistent with the ERCOFTAC guide:
 $\unicode[STIX]{x1D6FA}=(L_{inlet},L_{x},L_{y},L_{z})=(2L,8L,2L,2L)$
, where
$\unicode[STIX]{x1D6FA}=(L_{inlet},L_{x},L_{y},L_{z})=(2L,8L,2L,2L)$
, where
 $L$
is the body length. The domain was discretised into a Cartesian structured grid with approximately 5.3 million computational nodes. The majority of the nodes are clustered around the body and in the wake to ensure the important flow dynamics is resolved. For all simulations
$L$
is the body length. The domain was discretised into a Cartesian structured grid with approximately 5.3 million computational nodes. The majority of the nodes are clustered around the body and in the wake to ensure the important flow dynamics is resolved. For all simulations
 $n^{+}$
, where
$n^{+}$
, where
 $n$
is the cell distance in the normal direction from the body, is within the range of
$n$
is the cell distance in the normal direction from the body, is within the range of
 $0.02<n^{+}<0.8$
, while the maximum Courant–Friedrichs–Lewy (CFL) number is 0.08. A wall-adjusted local eddy viscosity (WALE) model was used for the subgrid-scale (SGS) model (Nicoud & Ducros Reference Nicoud and Ducros1999). It should be noted that when a simulation at
$0.02<n^{+}<0.8$
, while the maximum Courant–Friedrichs–Lewy (CFL) number is 0.08. A wall-adjusted local eddy viscosity (WALE) model was used for the subgrid-scale (SGS) model (Nicoud & Ducros Reference Nicoud and Ducros1999). It should be noted that when a simulation at
 $Re_{H}=435$
was performed without the SGS model, there were few changes to the flow field, as can be seen in table 1. A comparison of body drag, recirculation bubble length and the dominant unsteady frequency for simulations on the fine (12.5 million nodes) and nominal (5.3 million nodes) grids in table 1 suggests that the simulations are sufficiently well-resolved.
$Re_{H}=435$
was performed without the SGS model, there were few changes to the flow field, as can be seen in table 1. A comparison of body drag, recirculation bubble length and the dominant unsteady frequency for simulations on the fine (12.5 million nodes) and nominal (5.3 million nodes) grids in table 1 suggests that the simulations are sufficiently well-resolved.
The boundary conditions are defined as follows: no slip on the body surface and the ground, free slip at the sides and top of the domain, and a convective boundary condition at the outflow. The inflow was left unperturbed. The simulations used 384 cores and ran on Imperial College London’s HPC High-End parallel cluster, CX2, and on the ARCHER UK National Supercomputing Service. All unforced and open-loop simulations ran for 800 convective time units, while feedback control simulations ran for 600 convective time units – these latter simulations requiring a smaller static time step.

Figure 1. Schematic of squareback Ahmed body: (a) side view; (b) rear view.
Table 1. Grid comparison for simulations at
 $Re_{H}=435$
.
$Re_{H}=435$
.
 $St_{h}=fH/U$
is the Strouhal number based on height, where
$St_{h}=fH/U$
is the Strouhal number based on height, where
 $f$
is the dimensional frequency and
$f$
is the dimensional frequency and
 $H$
is body height.
$H$
is body height.


Figure 2. Bifurcation scenario of changes in the mean position of the wake in the
 $z$
-direction (
$z$
-direction (
 $Z_{w}$
) as the Reynolds number is varied between
$Z_{w}$
) as the Reynolds number is varied between
 $310\leqslant Re_{H}\leqslant 435$
. LES results (red circles) are compared to experimental results from Grandemange et al. (Reference Grandemange, Cadot and Gohlke2012) (blue crosses). Black and grey lines show steady and unsteady regimes, respectively.
$310\leqslant Re_{H}\leqslant 435$
. LES results (red circles) are compared to experimental results from Grandemange et al. (Reference Grandemange, Cadot and Gohlke2012) (blue crosses). Black and grey lines show steady and unsteady regimes, respectively.
3 Simulation results: reflectional symmetry breaking regimes
The changes in the mean position of the wake
 $Z_{w}$
in the
$Z_{w}$
in the
 $z$
-direction, observed in the numerical simulations as Reynolds number was increased, are shown in the bifurcation diagram in figure 2, alongside the experimental findings of Grandemange et al. (Reference Grandemange, Cadot and Gohlke2012). Here
$z$
-direction, observed in the numerical simulations as Reynolds number was increased, are shown in the bifurcation diagram in figure 2, alongside the experimental findings of Grandemange et al. (Reference Grandemange, Cadot and Gohlke2012). Here
 $Z_{w}$
was measured as the point where the averaged streamlines met in the far wake to create a trail. The simulations successfully capture the sequence of regimes identified experimentally, although small differences in the Reynolds numbers of the state changes are noted. For example, at
$Z_{w}$
was measured as the point where the averaged streamlines met in the far wake to create a trail. The simulations successfully capture the sequence of regimes identified experimentally, although small differences in the Reynolds numbers of the state changes are noted. For example, at
 $Re_{H}=415$
, the simulated wake is steady asymmetric, while experiments report an unsteady asymmetric wake. However, once the simulation Reynolds number is increased to
$Re_{H}=415$
, the simulated wake is steady asymmetric, while experiments report an unsteady asymmetric wake. However, once the simulation Reynolds number is increased to
 $Re_{H}=435$
the wake becomes unsteady asymmetric.
$Re_{H}=435$
the wake becomes unsteady asymmetric.

Figure 3. Visualisations of Ahmed body flow at Reynolds numbers (a)
 $Re_{H}=310$
, (b) and (c)
$Re_{H}=310$
, (b) and (c)
 $Re_{H}=415$
, (d)
$Re_{H}=415$
, (d)
 $Re_{H}=435$
. For each
$Re_{H}=435$
. For each
 $Re_{H}$
the top and bottom left-hand pictures show side view and top view respectively of a 2D slice with streamlines projected onto it; the right-hand picture shows 3D streamlines in the wake.
$Re_{H}$
the top and bottom left-hand pictures show side view and top view respectively of a 2D slice with streamlines projected onto it; the right-hand picture shows 3D streamlines in the wake.
The four states exhibited by the wake at different Reynolds numbers are shown in figure 3. At
 $Re_{H}=310$
, the wake is ‘steady symmetric’ and consists of two recirculating regions aligned horizontally next to one another, as shown in the 3D streamlines on the right. The streamlines projected onto the ‘side-view’ slice of the flow field show that the separated flow travels past the top edge of the Ahmed body and recirculates back towards the body base, where it interacts with the underbody flow. This creates some shear, but not enough to also initiate recirculating motion near the bottom edge. As the Reynolds number is increased to
$Re_{H}=310$
, the wake is ‘steady symmetric’ and consists of two recirculating regions aligned horizontally next to one another, as shown in the 3D streamlines on the right. The streamlines projected onto the ‘side-view’ slice of the flow field show that the separated flow travels past the top edge of the Ahmed body and recirculates back towards the body base, where it interacts with the underbody flow. This creates some shear, but not enough to also initiate recirculating motion near the bottom edge. As the Reynolds number is increased to
 $Re_{H}=415$
, the wake becomes ‘unsteady symmetric’. This is a transient state and after a few flow-throughs the wake flips to the right, becoming ‘steady asymmetric’. It is noteworthy that compared to ‘steady symmetric’ regime, the ‘unsteady symmetric’ wake visibly shows a more active bottom shear layer, with recirculating motion beginning to form at the bottom edge. As the flow settles into the ‘steady asymmetric’ state, two recirculating regions form, which are now aligned vertically one on top of the other. This suggests that the initial symmetry breaking occurs once the Reynolds number is sufficiently high to create enough underbody flow for the top and bottom shear layers to interact and recirculate back towards the base. This further corroborates observations by Barros et al. (Reference Barros, Borée, Noack, Spohn and Ruiz2016) and Grandemange et al. (Reference Grandemange, Gohlke and Cadot2013a
) that ground presence affects the boundary layer development along the body and thus influences the transverse asymmetry in the wake. It is further postulated that when the wake is symmetric, the two recirculating regions located horizontally side by side originate from the side shear layers interacting – a relationship that is broken at higher Reynolds numbers due to the strong bottom shear layer and the aspect ratio of the base (the top and bottom shear layers are closer to one another than the side shear layers). As the Reynolds number is increased further to
$Re_{H}=415$
, the wake becomes ‘unsteady symmetric’. This is a transient state and after a few flow-throughs the wake flips to the right, becoming ‘steady asymmetric’. It is noteworthy that compared to ‘steady symmetric’ regime, the ‘unsteady symmetric’ wake visibly shows a more active bottom shear layer, with recirculating motion beginning to form at the bottom edge. As the flow settles into the ‘steady asymmetric’ state, two recirculating regions form, which are now aligned vertically one on top of the other. This suggests that the initial symmetry breaking occurs once the Reynolds number is sufficiently high to create enough underbody flow for the top and bottom shear layers to interact and recirculate back towards the base. This further corroborates observations by Barros et al. (Reference Barros, Borée, Noack, Spohn and Ruiz2016) and Grandemange et al. (Reference Grandemange, Gohlke and Cadot2013a
) that ground presence affects the boundary layer development along the body and thus influences the transverse asymmetry in the wake. It is further postulated that when the wake is symmetric, the two recirculating regions located horizontally side by side originate from the side shear layers interacting – a relationship that is broken at higher Reynolds numbers due to the strong bottom shear layer and the aspect ratio of the base (the top and bottom shear layers are closer to one another than the side shear layers). As the Reynolds number is increased further to
 $Re_{H}=435$
, the wake becomes ‘unsteady asymmetric’, with the two recirculating regions maintaining their vertical position. Within the time horizon of these simulations, the asymmetric wakes at
$Re_{H}=435$
, the wake becomes ‘unsteady asymmetric’, with the two recirculating regions maintaining their vertical position. Within the time horizon of these simulations, the asymmetric wakes at
 $Re_{H}=365$
and 435 did not switch to the other asymmetric state, but remained on the same side.
$Re_{H}=365$
and 435 did not switch to the other asymmetric state, but remained on the same side.
Table 2. Drag and lift coefficients at different symmetry breaking states.
The drag and lift coefficients associated with each of the simulated Reynolds numbers are listed in table 2. The drag is higher for the Reynolds numbers associated with the symmetric wake, while the asymmetric wake yields lower drag coefficients. The drag coefficient at
 $Re_{H}=435$
is 0.308, falling within the range reported in the literature of 0.26–0.33 (Ahmed et al.
Reference Ahmed, Ramm and Faltin1984; Grandemange et al.
Reference Grandemange, Cadot, Courbois, Herbert, Ricot, Ruiz and Vigneron2015; Volpe, Devinant & Kourta Reference Volpe, Devinant and Kourta2015). An increase in lift coefficient is also observed as the Reynolds number increases, which is consistent with an increased underbody flow developing. The lift coefficient for
$Re_{H}=435$
is 0.308, falling within the range reported in the literature of 0.26–0.33 (Ahmed et al.
Reference Ahmed, Ramm and Faltin1984; Grandemange et al.
Reference Grandemange, Cadot, Courbois, Herbert, Ricot, Ruiz and Vigneron2015; Volpe, Devinant & Kourta Reference Volpe, Devinant and Kourta2015). An increase in lift coefficient is also observed as the Reynolds number increases, which is consistent with an increased underbody flow developing. The lift coefficient for
 $Re_{H}=435$
compares well with the value reported by Grandemange et al. (Reference Grandemange, Cadot, Courbois, Herbert, Ricot, Ruiz and Vigneron2015) of
$Re_{H}=435$
compares well with the value reported by Grandemange et al. (Reference Grandemange, Cadot, Courbois, Herbert, Ricot, Ruiz and Vigneron2015) of
 $C_{l}=-0.04$
.
$C_{l}=-0.04$
.
Further insights into the unsteady symmetric and unsteady asymmetric states are provided by considering the Q-criterion (Hunt, Wray & Moin Reference Hunt, Wray and Moin1988) of the flow fields conditionally averaged at the same point in the shedding cycle, as shown in figure 4. When the flow is symmetric, the internal vortex structure is positioned at the centre of the bottom edge of the base. As the symmetry breaks, the vortex structure inside the vortex ring changes its position. Once the wake shifts to the side, the vortex inside the recirculation bubble moves to the side edge of the base, subsequently affecting the position of the large recirculating structures further downstream.

Figure 4. Q-criterion iso-contour of Ahmed body flow at Reynolds number
 $Re_{H}=435$
when the wake is (a) unsteady symmetric, (b) unsteady asymmetric. For each regime, the top and bottom left-hand pictures show side view and top view respectively; the right-hand picture shows the diagonal view from the top. The same Q-criterion iso-contour is plotted with opaque and transparent parts to reveal the internal structure of the vortex ring in the wake.
$Re_{H}=435$
when the wake is (a) unsteady symmetric, (b) unsteady asymmetric. For each regime, the top and bottom left-hand pictures show side view and top view respectively; the right-hand picture shows the diagonal view from the top. The same Q-criterion iso-contour is plotted with opaque and transparent parts to reveal the internal structure of the vortex ring in the wake.
3.1 Feedback control for form-drag reduction
A linear single-input, single-output feedback controller is now designed and tested on the unsteady asymmetric Ahmed body flow at
 $Re_{H}=435$
. Body-mounted sensing and actuation is used for practical applicability. The sensor signal is the unsteady component of the base pressure force, while actuation takes the form of energy efficient unsteady synthetic jets acting uniformly around the perimeter of body, just ahead of the separation. The schematic of the control arrangement is shown in figure 5(b).
$Re_{H}=435$
. Body-mounted sensing and actuation is used for practical applicability. The sensor signal is the unsteady component of the base pressure force, while actuation takes the form of energy efficient unsteady synthetic jets acting uniformly around the perimeter of body, just ahead of the separation. The schematic of the control arrangement is shown in figure 5(b).
The feedback control strategy has the direct aim of attenuating fluctuations in the base pressure force. It is envisaged that in suppressing these fluctuations, a mean base pressure recovery will be achieved, giving a form-drag reduction. This strategy has been successfully applied to 3D blunt bluff body geometries (Dahan et al. Reference Dahan, Morgans and Lardeau2012; Dalla Longa, Morgans & Dahan Reference Dalla Longa, Morgans and Dahan2017).

Figure 5. (a) Dynamically linear model for feedback control:
 $s$
denotes the Laplace transform variable. (b) Schematic of the control arrangement: sensor (light blue) measures the base pressure force and actuation (red) acts via synthetic jets angled at
$s$
denotes the Laplace transform variable. (b) Schematic of the control arrangement: sensor (light blue) measures the base pressure force and actuation (red) acts via synthetic jets angled at
 $10^{\circ }$
outwards from the downstream direction.
$10^{\circ }$
outwards from the downstream direction.
The means by which base pressure force fluctuations are suppressed is explained in figure 5(a). Denoting
 $s$
as the Laplace transform variable, fluctuations in the base pressure force,
$s$
as the Laplace transform variable, fluctuations in the base pressure force,
 $F_{b}(s)$
are assumed to respond both to the actuation,
$F_{b}(s)$
are assumed to respond both to the actuation,
 $U_{j}(s)$
, and to natural disturbances in the flow,
$U_{j}(s)$
, and to natural disturbances in the flow,
 $N(s)$
. The Laplace transforms of these fluctuations in the absence and presence of feedback control take the forms
$N(s)$
. The Laplace transforms of these fluctuations in the absence and presence of feedback control take the forms
 $$\begin{eqnarray}F_{b,no\,control}(s)=U_{j}(s)G(s)+H(s),\quad F_{b,control}(s)=\frac{U_{j}(s)G(s)+H(s)}{1+G(s)K(s)}.\end{eqnarray}$$
The ratio of the size of these fluctuations with control to those without is then given by the magnitude of the ‘sensitivity transfer function’;
 $$\begin{eqnarray}|S(s)|=\frac{|F_{b,control}(s)|}{|F_{b,no\,control}(s)|}=\left|\frac{1}{1+G(s)K(s)}\right|.\end{eqnarray}$$
For the feedback controller,
 $K(s)$
, to attenuate fluctuations, we require
$K(s)$
, to attenuate fluctuations, we require
 $|S(s)|<1$
over the frequencies where the wake exhibits significant dynamics. For the present flow, the base pressure force spectrum in the absence of control is shown in figure 6. The main frequencies present are
$|S(s)|<1$
over the frequencies where the wake exhibits significant dynamics. For the present flow, the base pressure force spectrum in the absence of control is shown in figure 6. The main frequencies present are
 $St=0.08$
and 0.16, and these will be the target frequencies for feedback control.
$St=0.08$
and 0.16, and these will be the target frequencies for feedback control.

Figure 6. Amplitude of base pressure force spectrum for the Ahmed body flow at
 $Re_{H}=435$
.
$Re_{H}=435$
.
Controller design requires a low-order linear model for
 $G(s)$
, which represents how the sensor signal,
$G(s)$
, which represents how the sensor signal,
 $F_{b}(s)$
, responds to actuation,
$F_{b}(s)$
, responds to actuation,
 $U_{j}(s)$
. This is obtained by performing system identification simulations with harmonic open-loop forcing across different frequencies and amplitudes. (The use of harmonic forcing over broadband permits examination and, if necessary, quantification, of any nonlinearity present in the response.) The gain and phase shift from the actuation to the sensor signals was then measured, yielding the open-loop frequency response data shown in figure 7(a). The forcing level independence confirms dynamic linearity. A second-order model for
$U_{j}(s)$
. This is obtained by performing system identification simulations with harmonic open-loop forcing across different frequencies and amplitudes. (The use of harmonic forcing over broadband permits examination and, if necessary, quantification, of any nonlinearity present in the response.) The gain and phase shift from the actuation to the sensor signals was then measured, yielding the open-loop frequency response data shown in figure 7(a). The forcing level independence confirms dynamic linearity. A second-order model for
 $G(s)$
was fitted to the data using the Matlab command
$G(s)$
was fitted to the data using the Matlab command
 $fitfrd$
.
$fitfrd$
.
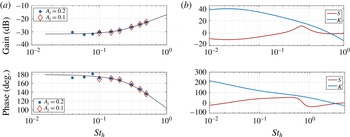
Figure 7. Frequency response gain and phase for (a) system identification data from open-loop simulations with harmonic forcing at amplitudes at
 $A_{j}=0.1$
and
$A_{j}=0.1$
and
 $A_{j}=0.2$
and (b) for the controller
$A_{j}=0.2$
and (b) for the controller
 $K(s)$
and sensitivity function
$K(s)$
and sensitivity function
 $S(s)$
.
$S(s)$
.
The feedback controller,
 $K(s)$
, was designed by shaping its response in the frequency domain (‘loop shaping’) to ensure low sensitivity for frequencies of
$K(s)$
, was designed by shaping its response in the frequency domain (‘loop shaping’) to ensure low sensitivity for frequencies of
 $St\sim 0.08{-}0.16$
and closed loop stability. The final feedback controller is a combination of a second-order low-pass and band-pass filters
$St\sim 0.08{-}0.16$
and closed loop stability. The final feedback controller is a combination of a second-order low-pass and band-pass filters
 $K(s)=K_{lp}(s)K_{bp}(s)$
shown in (3.3a,b
).
$K(s)=K_{lp}(s)K_{bp}(s)$
shown in (3.3a,b
).
 $$\begin{eqnarray}K_{lp}(s)=\frac{k\unicode[STIX]{x1D714}_{co}^{2}}{\unicode[STIX]{x1D714}_{co}^{2}+2\unicode[STIX]{x1D709}s\unicode[STIX]{x1D714}_{co}+s^{2}},\quad K_{bp}(s)=\frac{s\unicode[STIX]{x1D714}_{h}}{(\unicode[STIX]{x1D714}_{l}+s)(\unicode[STIX]{x1D714}_{h}+s)},\end{eqnarray}$$
where the coefficients for the low-pass filter are:
 $k=-350$
,
$k=-350$
,
 $\unicode[STIX]{x1D709}=6$
and
$\unicode[STIX]{x1D709}=6$
and
 $\unicode[STIX]{x1D714}_{co}=0.13\times 2\unicode[STIX]{x03C0}$
and the coefficients for the band-pass filter are:
$\unicode[STIX]{x1D714}_{co}=0.13\times 2\unicode[STIX]{x03C0}$
and the coefficients for the band-pass filter are:
 $\unicode[STIX]{x1D714}_{h}=5\times 2\unicode[STIX]{x03C0}$
and
$\unicode[STIX]{x1D714}_{h}=5\times 2\unicode[STIX]{x03C0}$
and
 $\unicode[STIX]{x1D714}_{l}=0.05\times 2\unicode[STIX]{x03C0}$
. The phase and gain of the controller
$\unicode[STIX]{x1D714}_{l}=0.05\times 2\unicode[STIX]{x03C0}$
. The phase and gain of the controller
 $K(s)$
along with the resulting sensitivity transfer function are shown in figure 7(b).
$K(s)$
along with the resulting sensitivity transfer function are shown in figure 7(b).
The feedback controller was implemented in the simulations; the unforced and forced base pressure signals are compared in figure 8, alongside the actuation signal. Control successfully attenuated base pressure fluctuations, reducing the RMS by 33 %. This was accompanied by an increase in the mean base pressure of approximately 5 %, which was achieved quickly, with convergence in approximately 20 convective times, and with actuation having zero mean throughout. The momentum coefficient was
 $c_{\unicode[STIX]{x1D707}}=1.37\times 10^{-5}$
, where
$c_{\unicode[STIX]{x1D707}}=1.37\times 10^{-5}$
, where
 $c_{\unicode[STIX]{x1D707}}=U_{jet}^{2}A_{jet}/A_{b}U_{\infty }^{2}$
,
$c_{\unicode[STIX]{x1D707}}=U_{jet}^{2}A_{jet}/A_{b}U_{\infty }^{2}$
,
 $A_{jet}$
is the total area of the synthetic jets and
$A_{jet}$
is the total area of the synthetic jets and
 $A_{b}$
the base area. The drag coefficient for the controlled flow was
$A_{b}$
the base area. The drag coefficient for the controlled flow was
 $C_{d}=0.2995$
, approximately a 3 % reduction on the unforced value. Note that as the controller aims to suppress base pressure force fluctuations, it is somewhat limited in what is achievable at the present low Reynolds number; the flow is not strongly unsteady and fluctuations are relatively small. Nonetheless, the implementation demonstrates that the linear feedback control strategy has potential for 3D bluff body geometries.
$C_{d}=0.2995$
, approximately a 3 % reduction on the unforced value. Note that as the controller aims to suppress base pressure force fluctuations, it is somewhat limited in what is achievable at the present low Reynolds number; the flow is not strongly unsteady and fluctuations are relatively small. Nonetheless, the implementation demonstrates that the linear feedback control strategy has potential for 3D bluff body geometries.

Figure 8. (a) Comparison of converged base pressure coefficient,
 $C_{p}$
, with (red) and without (black) feedback control. (b) Corresponding actuation signal,
$C_{p}$
, with (red) and without (black) feedback control. (b) Corresponding actuation signal,
 $U_{jet}$
.
$U_{jet}$
.

Figure 9. 2D slice of (a) unforced and (b) controlled instantaneous flow fields coloured by magnitude of the velocity with streamlines projected onto the ‘top-view’ slices.
Figure 9 shows two-dimensional horizontal slices of the wake both in the absence and presence of feedback control. The controlled wake has been symmetrised horizontally compared to the uncontrolled flow.
3.2 Wake mode analysis
Dimensionality reduction algorithms such as proper orthogonal decomposition (POD) and dynamic mode decomposition (DMD) are often used to characterise the main dynamic features of the flow. POD captures the most energetic flow features: McArthur et al. (Reference McArthur, Burton, Thompson and Sheridan2016) used it to characterise the dynamics of a turbulent Ahmed body wake, while Östh et al. (Reference Östh, Noack, Krajnović, Barros and Borée2014) used the POD modes of a turbulent Ahmed body flow to construct a reduced order model capable of capturing the full broad frequency spectrum. DMD extracts oscillatory modes with a specific eigenvalue representing their growth rate and frequency (Schmid Reference Schmid2010). It has been applied to the low-Reynolds-number bifurcation regime of a cylinder bluff body flow (Bagheri Reference Bagheri2013), but not as yet to the Ahmed body flow.
The apparent symmetrisation of the wake by the action of feedback control leads us to analyse the wake modes using DMD. To obtain the DMD modes, a time series of measurement snapshot vectors,
 $\boldsymbol{v}_{n}$
, each from time step
$\boldsymbol{v}_{n}$
, each from time step
 $n$
, are arranged in a matrix
$n$
, are arranged in a matrix
 $\unicode[STIX]{x1D651}_{1}^{N}\leftarrow \{\boldsymbol{v}_{1},\boldsymbol{v}_{2},\ldots ,\boldsymbol{v}_{N}\}$
. The data matrix
$\unicode[STIX]{x1D651}_{1}^{N}\leftarrow \{\boldsymbol{v}_{1},\boldsymbol{v}_{2},\ldots ,\boldsymbol{v}_{N}\}$
. The data matrix
 $\unicode[STIX]{x1D651}_{1}^{N}$
is decomposed into two sets:
$\unicode[STIX]{x1D651}_{1}^{N}$
is decomposed into two sets:
 $\unicode[STIX]{x1D651}_{1}^{N-1}\leftarrow \{\boldsymbol{v}_{1},\boldsymbol{v}_{2},\ldots ,\boldsymbol{v}_{N-1}\}$
and
$\unicode[STIX]{x1D651}_{1}^{N-1}\leftarrow \{\boldsymbol{v}_{1},\boldsymbol{v}_{2},\ldots ,\boldsymbol{v}_{N-1}\}$
and
 $\unicode[STIX]{x1D651}_{2}^{N}\leftarrow \{\boldsymbol{v}_{2},\boldsymbol{v}_{2},\ldots ,\boldsymbol{v}_{N}\}$
, and the first set orthogonalised using the singular value decomposition (SVD):
$\unicode[STIX]{x1D651}_{2}^{N}\leftarrow \{\boldsymbol{v}_{2},\boldsymbol{v}_{2},\ldots ,\boldsymbol{v}_{N}\}$
, and the first set orthogonalised using the singular value decomposition (SVD):
 $[\unicode[STIX]{x1D650},\boldsymbol{\unicode[STIX]{x1D6F4}},\boldsymbol{W}]=svd(\unicode[STIX]{x1D651}_{2}^{N-1})$
, where the matrix
$[\unicode[STIX]{x1D650},\boldsymbol{\unicode[STIX]{x1D6F4}},\boldsymbol{W}]=svd(\unicode[STIX]{x1D651}_{2}^{N-1})$
, where the matrix
 $\unicode[STIX]{x1D650}$
contains proper orthogonal modes of the first set of data
$\unicode[STIX]{x1D650}$
contains proper orthogonal modes of the first set of data
 $\unicode[STIX]{x1D651}_{1}^{N-1}$
. It is thus possible to express the last data vector
$\unicode[STIX]{x1D651}_{1}^{N-1}$
. It is thus possible to express the last data vector
 $\boldsymbol{v}_{N}$
as a linear combination of the previous elements in the form:
$\boldsymbol{v}_{N}$
as a linear combination of the previous elements in the form:
 $$\begin{eqnarray}\unicode[STIX]{x1D64E}=\unicode[STIX]{x1D650}^{H}\unicode[STIX]{x1D651}_{2}^{N}\boldsymbol{W}\boldsymbol{\unicode[STIX]{x1D6F4}}^{-1}.\end{eqnarray}$$
The eigenvectors of
 $\unicode[STIX]{x1D64E}$
are the modal structures and the eigenvalues are frequencies and growth/decay rates. To quantify how much the modes are represented in the original dataset, the optimum amplitudes are computed using the QR-decomposition of the product of the original data matrix
$\unicode[STIX]{x1D64E}$
are the modal structures and the eigenvalues are frequencies and growth/decay rates. To quantify how much the modes are represented in the original dataset, the optimum amplitudes are computed using the QR-decomposition of the product of the original data matrix
 $\unicode[STIX]{x1D651}$
, the singular values
$\unicode[STIX]{x1D651}$
, the singular values
 $\boldsymbol{\unicode[STIX]{x1D6F4}}$
and the modes, i.e. the eigenvectors of
$\boldsymbol{\unicode[STIX]{x1D6F4}}$
and the modes, i.e. the eigenvectors of
 $\unicode[STIX]{x1D64E}$
.
$\unicode[STIX]{x1D64E}$
.
The results from DMD analysis for the Ahmed body flow without feedback control and in the presence of feedback control are shown in figure 10(a,c) and 10(b,d), respectively. Figure 10(a,b) shows the frequencies and growth rates of the DMD modes scaled by their optimum amplitudes. The most prominent unsteady mode in the unforced flow is at
 $St\approx 0.16$
, a frequency which was also captured in the amplitude spectrum of the base pressure signal. The spatial structure of this mode is shown in figure 10(c), revealing asymmetric shedding from only one side of the base.
$St\approx 0.16$
, a frequency which was also captured in the amplitude spectrum of the base pressure signal. The spatial structure of this mode is shown in figure 10(c), revealing asymmetric shedding from only one side of the base.
Once the feedback control is applied, the growth rate versus frequency plot in figure 10(b) shows that most of the low-frequency dynamics seen in the unforced flow have been attenuated in accordance with the control aim. The most prominent low-frequency mode shifts to a frequency of
 $St=0.13$
, with its spatial structure revealing horizontally symmetric shedding, which is consistent with the flow visualisations in figure 9. It is not uncommon for feedback control to shift the frequency of the main dynamics, and in this case it appears to make the shedding slower and in-phase horizontally.
$St=0.13$
, with its spatial structure revealing horizontally symmetric shedding, which is consistent with the flow visualisations in figure 9. It is not uncommon for feedback control to shift the frequency of the main dynamics, and in this case it appears to make the shedding slower and in-phase horizontally.
The importance of re-symmetrisation of the wake for drag reduction was highlighted by Evrard et al. (Reference Evrard, Cadot, Herbert, Ricot, Vigneron and Dlery2016), who implemented passive boat tail control to weaken the reflectional symmetry breaking modes. Further experimental studies by Brackston et al. (Reference Brackston, Garcia de la Cruz, Wynn, Rigas and Morrison2016) and Li et al. (Reference Li, Barros, Borée, Cadot, Noack and Cordier2016) targeted re-symmetrisation of the wake with feedback control and also achieved a drag reduction. Since overall perturbations in the flow are linked to the symmetry breaking behaviour of the wake, it appears that attenuating the base pressure fluctuations reduced the overall perturbations in the wake, returning the wake to symmetry and achieving an increase in the mean base pressure.

Figure 10. DMD results for (a,c) the unforced flow and (b,d) the flow with feedback control. (a,b) Shows the frequencies and growth rates of the DMD modes scaled by their optimum amplitudes; (c,d) is a top view of the spatial structure of the most dynamically represented modes (red markers on the frequency versus growth rate figure) at (a,c)
 $St_{h}=0.16$
for unforced flow and (b,d)
$St_{h}=0.16$
for unforced flow and (b,d)
 $St_{h}=0.13$
for the flow with feedback control.
$St_{h}=0.13$
for the flow with feedback control.
4 Conclusions
In this work the low-Reynolds-number bifurcation sequence for the Ahmed body wake, previously reported only in experiments, was reproduced numerically. The main flow features were investigated, revealing that as the reflectional symmetry of the wake is broken, the structure of the recirculation bubble changes from two recirculation regions positioned side by side, to one on top of the other. The vortex structure within the wake also moves from a centred position to the side, affecting the position of the large recirculating vortices further downstream. It was conjectured that this change in the flow happens once there is sufficient underbody flow, allowing the shear layers shed from the top and bottom of the base (which are closer to one another than those from the sidewalls) to interact.
Linear feedback control, which targeted attenuation of the base pressure force fluctuations, was then applied. The control was implemented via body-mounted sensors and unsteady synthetic jet actuation, for practical applicability. The effect of control was to attenuate the base pressure force fluctuations, increase the base pressure, reduce the drag and re-symmetrise the wake. DMD analysis of the controlled and uncontrolled flows at
 $Re_{H}=435$
revealed that the feedback control slightly reduced the frequency of the shedding mode. The shedding from the sides also became in-phase when the control was applied.
$Re_{H}=435$
revealed that the feedback control slightly reduced the frequency of the shedding mode. The shedding from the sides also became in-phase when the control was applied.
This work provides motivation for attempting to simulate reflectional symmetry breaking modes of wake flows at higher Reynolds numbers, where bi-stable or multi-stable switching at long time scales between asymmetric states can occur. A linear feedback control strategy for form-drag reduction also holds promise for higher Reynolds numbers, where increased flow unsteadiness may offer enhanced potential for control benefits.
Acknowledgements
This work used both the Imperial College High Performance Computing service and ARCHER (the UK High Performance Computing resource). Financial support from the Engineering and Physical Sciences Research Council is gratefully acknowledged.


 Open access