
The 1932–1933 Famine is one of the most tragic events in the history of the Soviet Union. The opening of archives and access to demographic statistics in the 1930s has provided new opportunities for estimating demographic losses due to the Famine. The spatially uneven impact of the 1932–1933 Famine in the USSR has been recognized by both demographers and historians. It is generally accepted that Ukraine (UkrSSR or Soviet Ukraine) and Russia (RSFSR or Russian Federation), as well as Kazakhstan, were the two (or three) republics most affected by the Famine, but the scope of the tragedy in these republics and its causes remain the subject of heated controversy. The number of excess deaths in 1933 for Russia is estimated at 2.3–2.4 million (Andreev et al. Reference Andreev, Darskii and Kharkova1998), while the data-based estimates of direct Famine losses for Ukraine vary between 2.6 and 5 million (Conquest Reference Conquest1986; Meslé and Vallin Reference Meslé and Vallin2003). There has been ongoing discussion regarding whether all grain-producing regions of the Soviet Union suffered from the Famine to the same extent and due to the same reasons. As far as we know, there are two perspectives on this question.
According to the first perspective, the Famine of 1932–1933 had an all-Union nature. This implies that the causes of the Famine were common for all regions: accelerated industrialization and forced collectivization of agriculture, which led to the massive Famine throughout the Soviet Union (Kondrashin Reference Kondrashin and Kondrashin2011a). This results in two assertions: (a) the scale and intensity of the Famine were determined exclusively by the economic specialization of the regions and grain procurement quotas; therefore, the number of losses due to the Famine is associated with the amount of grain confiscated by the State and the contribution of a region to the all-Union volume of grain collection; and (b) losses caused by starvation are determined by the place of residence, not nationality. In other words, all grain-producing regions of the USSR were affected by the Famine, although people mostly died in the regions where more grain was produced and therefore more grain was withheld by the State. Because the UkrSSR was one of the most important grain producers in the USSR, this republic was the hardest hit by the Famine, but Russian regions supplying grain also suffered. Therefore, there was no Ukrainian national factor. Instead, there was a common tragedy due to excessive grain procurements in Ukraine, in the Don region and the Kuban, the Central Black-Earth oblast, the Volga region, the Urals, and Western Siberia (Ivnitskii Reference Ivnitskii2009; Kondrashin Reference Kondrashin and Kondrashin2011a; Zelenin Reference Zelenin2006).
Another explanation supporting the statement about an all-Union nature of the 1932–1933 Famine focuses on common unfavorable environmental and agricultural conditions at that time. Tauger’s (Reference Tauger2001) explanation of the 1932–1933 Famine involves the combination of both environmental and human actions, though with a predominant role of natural disaster. Davies and Wheatcroft (Reference Davies and Wheatcroft2004) claim that an absolute shortage of food in these years was an immediate factor that led to the Famine but there were more agro-technological reasons for the low grain production in 1931–1932. Despite some differences, overall these studies pay particular attention to environmental and economic contexts of the Famine rather than to the importance of the nationality factor and the intensity of resistance and repressions.
The second perspective is that there are both common factors and significant differences in the causes and consequences of the 1932–1933 Famine between the UkrSSR and the RSFSR. It states that the Famine had a common all-Union nature only in the first half of 1932, and that starting in late 1932 and during1933, the Famine in the UkrSSR transformed into Holodomor, as in, terror by Famine carried out by the central government against the peasants in the UkrSSR and Kuban, a region in RSFSR with a high proportion of ethnic Ukrainians (Applebaum Reference Applebaum2017; Conquest Reference Conquest1986; Graziosi Reference Graziosi2005; Kulchytskyi Reference Kulchytskyi2018).
These different perspectives require careful analysis of the impact of the Famine across regions of UkrSSR and RSFSR. Due to the lack of reliable data, a very complex dynamic of administrative structures, and also some methodological issues, estimates of Famine losses in both republics at the regional levels have not been adequately examined. In Ukraine, Kulchytskyj (2003) and Maksudov (Reference Maksudov and Denisenko2012) analyzed mortality differentials at the oblast (region) level and Wheatcroft and Garnaut (Reference Wheatcroft and Garnaut2013) at the raion (district) level. Yet, these studies are based on registered death rates and do not attempt to estimate Famine losses. A significant amount of historical research has been done on the 1932–1933 Famine in the Russian Federation, but most of it, however, has been limited to some specific regions and does not examine all regions of RSRSR in a comparative perspective.
This article has two objectives. First, we estimate the 1932–1934Footnote 1 population losses in terms of excess deaths across regions of the RSFSR; second, we make a comparative assessment of the 1932–1934 excess deaths within and between UkrSSR and RSFSR.
There are two types of famine-related population losses: direct or excess deaths and indirect or lost births. Only direct losses (or excess deaths, to be used interchangeably) are discussed in our article. They are defined as the difference between actual deaths during the Famine years and deaths that would have occurred had there been no Famine. This analysis draws on our previous works on estimation of the 1932–1934 Famine losses for Soviet Ukraine at the national and regional levels (Rudnytskyi et al. Reference Rudnytskyi, Levchuk, Wolowyna, Shevchuk and Kovbasiuk2015; Wolowyna et al. Reference Wolowyna, Plokhy, Levchuk, Rudnytskyi, Kovbasiuk and Shevchuk2016). Wolowyna et al. (Reference Wolowyna, Plokhy, Levchuk, Rudnytskyi, Kovbasiuk and Shevchuk2016) estimated Famine losses for the eight regions of Soviet Ukraine during this period, and analyzed different factors that may account for the regional differences in losses. In this article we include the analysis of losses for 20 regions of the Russian Federation according to the administrative structure during the Famine period.
It should be noted that Kazakhstan was a part of RSFSR as the Kazak ASSR until 1936, but it is excluded from our analysis, as in the victims of the Kazakh Famine are not counted in the total direct losses for the Russian Federation. This is explained by the fact that the causes and dynamics of the Famine in Kazakhstan differ significantly from the situation in other regions of the USSR (Cameron Reference Cameron2016).
Our study contributes to the existing literature on the 1932–1933 Famine in the USSR in two respects. First, to our knowledge, this is the first comprehensive attempt to estimate direct Famine losses for all regions of RSFSR and the first systematic comparative analysis of excess deaths between Soviet Ukraine and the Russian Federation at the regional level. We were able to estimate absolute and relative excess deaths for eight regions of UkrSSR and 20 regions of RSFSR and examine regional variations in the intensity of Famine-induced mortality. In contrast to previous studies, we estimate direct losses as the difference between actual deaths during the Famine years and deaths that would have occurred had there been no Famine (this methodology was also applied previously; Andreev et al. Reference Andreev, Darskii and Kharkova1998; Mesle and Vallin Reference Meslé and Vallin2003). In other words, we calculated Famine losses as deaths that otherwise would not have occurred.
Second, this study also adds to our understanding of the factors contributing to regional loss differences and reinforces the statement that UkrSSR was distinctive in terms of both the level of Famine-induced mortality and the scale and range of mass repressions against the peasantry. The results of our analysis contribute to the debate on the unequal impact of the 1932–1933 Famine in the UkrSSR and the RSFSR.
The article is organized as follows. First, we define a regional, administrative-territorial structure in both republics at the time of the Famine. This is followed by a description of data used in the analyses and the main steps of population reconstructions for the 1927–1939 period. Then, we provide a comparative analysis of excess deaths within and between Soviet Ukraine and the Russian Federation. The next part of our article discusses several important factors that may have contributed to the regional distributions of Famine losses: (a) 1931 and 1932 grain procurements; (b) peasant resistance and repressions during the collectivization and grain procurement period; (c) nationality factor; and (d) other factors. Although we provide estimates of the 1932–1934 excess deaths for eight regions of the UkrSSR and 20 regions of the RSFSR, the discussion is focused on Soviet Ukraine and the four regions of the RSFSR that were mostly affected by the Famine. The final section concludes with the main findings and directions for further research.
Changes in Territorial Structures
The administrative-territorial structures in the UkrSSR and the RSFSR experienced significant changes during the 1926–1939 intercensal period (Tarkhov Reference Tarkhov, Treivish and Artobolevskii2001; Vermenych Reference Vermenych2009). In order to estimate the 1932–1933 famine losses at the subnational level, a common regional structure had to be defined for all years of the 1926–1939 period. The chosen structures are the ones existing in both Republics at the time of the Famine. For the UkrSSR, this corresponds to the eight-region structure that existed during the 1932–1936 period: Vinnytsa, Kyiv, Chernihiv, Kharkiv, Donetsk (Stalino), Dnipropetrovsk and Odesa oblasts, and the Moldavian ASSR. For the RSFSR, 17 regions correspond to the administrative-territorial structure in 1932. In order to have a more precise estimate of Famine losses, three subregions within two of the 17 regions were singled out: Saratov oblast, the Volga Cerman ASSR, and Krasnodar kraj. Saratov oblast and the Volga German republic were parts of Lower Volga kraj, while Krasnodar kraj was part of North Caucasus kraj. Thus, we have a total of 20 regions for RSFSR: (1) 6 oblasts: Western, Leningrad-Karel, Central-Industrial, Central Black-Earth, Ural, Saratov; (2) 9 krajs: Northern Volga, Lower Volga, Central Volga, Gorkiy, North Caucasus, Krasnodar, West Siberia, East Siberia, Far East; and (3) 5 ASSRs: Crimea, Volga German, Tatarstan, Bashkortostan, and Yakutia.
Data and Methods
Our analysis is based on data from Russian State Archive of Economics, State Archives of the Russian Federation, personal papers of the Ukrainian demographer Y. Korchak-Chepurkivskyi, and different statistical yearbooks and publications. These data include two Soviet censusesFootnote 2 (1926 and 1939), annual vital statistics,Footnote 3 and migration dataFootnote 4 by region and urban-rural areas for the 1926–1939 period, as well as data on rural–urban reclassification of population settlements. It is important to note that Soviet Ukraine had fairly complete vital statistics for 1927–1938, whereas registration of births and deaths in Russian Federation was less complete (Wheatcroft Reference Wheatcroft and Kondrashin2013, 744). Migration data are available only for urban areas, and are also more complete for UkrSSR than for RSFSR. Rural migration is estimated by adding different migration streams of forced and voluntary migration for the different regions.Footnote 5
As yearly vital statistics and migration data were tabulated according to the administrative structure of the respective year, it was necessary to recalculate them according to the structures we adopted for UkrSSR and RSFSR. This was done by matrices of transition coefficients. The methodology of these calculations for UkrSSR is described in Wolowyna et al. (Reference Wolowyna, Plokhy, Levchuk, Rudnytskyi, Kovbasiuk and Shevchuk2016). Data for 1927–1932 did not require detailed recalculations for the Russian Federation, while it was necessary to recalculate the original data for the 20 regions for 1926 and 1933–1939. Transition coefficients for 1932, 1937, and 1939 were estimated based on changes in territory and population.
The estimation of losses is based on yearly population reconstructions for each region of UkrSSR and RSFSR by urban–rural areas, between the 1926 and 1939. This includes (a) corrections of 1926 and 1939 censuses (Andreev et al. Reference Andreev, Darskii and Kharkova1990; Bogoyavlenskii Reference Bogoyavlenskii2013; Simchenko Reference Simchenko1990; Tolts Reference Tolts1995); (b) adjustment of vital statistics for under-registration (Andreev et al. Reference Andreev, Darskii and Kharkova1998; Mozokhin Reference Mozokhin2004; Rudnytskyi et al. Reference Rudnytskyi, Levchuk, Wolowyna, Shevchuk and Kovbasiuk2015; Wolowyna et al. Reference Wolowyna, Plokhy, Levchuk, Rudnytskyi, Kovbasiuk and Shevchuk2016; Zemskov Reference Zemskov1991a, Reference Zemskov1991b); (c) estimation of net migration (Rudnytskyi et al. Reference Rudnytskyi, Levchuk, Wolowyna, Shevchuk and Kovbasiuk2015; Wolowyna et al. Reference Wolowyna, Plokhy, Levchuk, Rudnytskyi, Kovbasiuk and Shevchuk2016); (d) estimation of urban–rural reclassification; and (i) calculation of total population balance using the classic demographic equation for each year:
 $$ Population\left(t+1\right)= Population(t)+ births\hbox{--} deaths+ net\ migration+ urban- rural\ reclassification $$
Yearly reconstructed populations provide the basis for estimating direct losses during the 1932–1934 years.
Estimation of Direct Losses (Excess Deaths)
Direct losses (excess deaths) are estimated as the difference between the number of deaths that occurred during the Famine years and the hypothetical number of deaths had there been no Famine during the same period. For UkrSSR, the number of hypothetical deaths had there been no Famine is estimated using linearly extrapolated age-specific deaths rates between 1931 and 1935, as in, the years before and after the Famine, when mortality was considered relatively “normal.”Footnote 6 The same method was used to define the numbers of no-crisis deaths for RSFSR. The number of actual deaths was estimated using population reconstruction (see above and Rudnytskyi et al. Reference Rudnytskyi, Levchuk, Wolowyna, Shevchuk and Kovbasiuk2015).
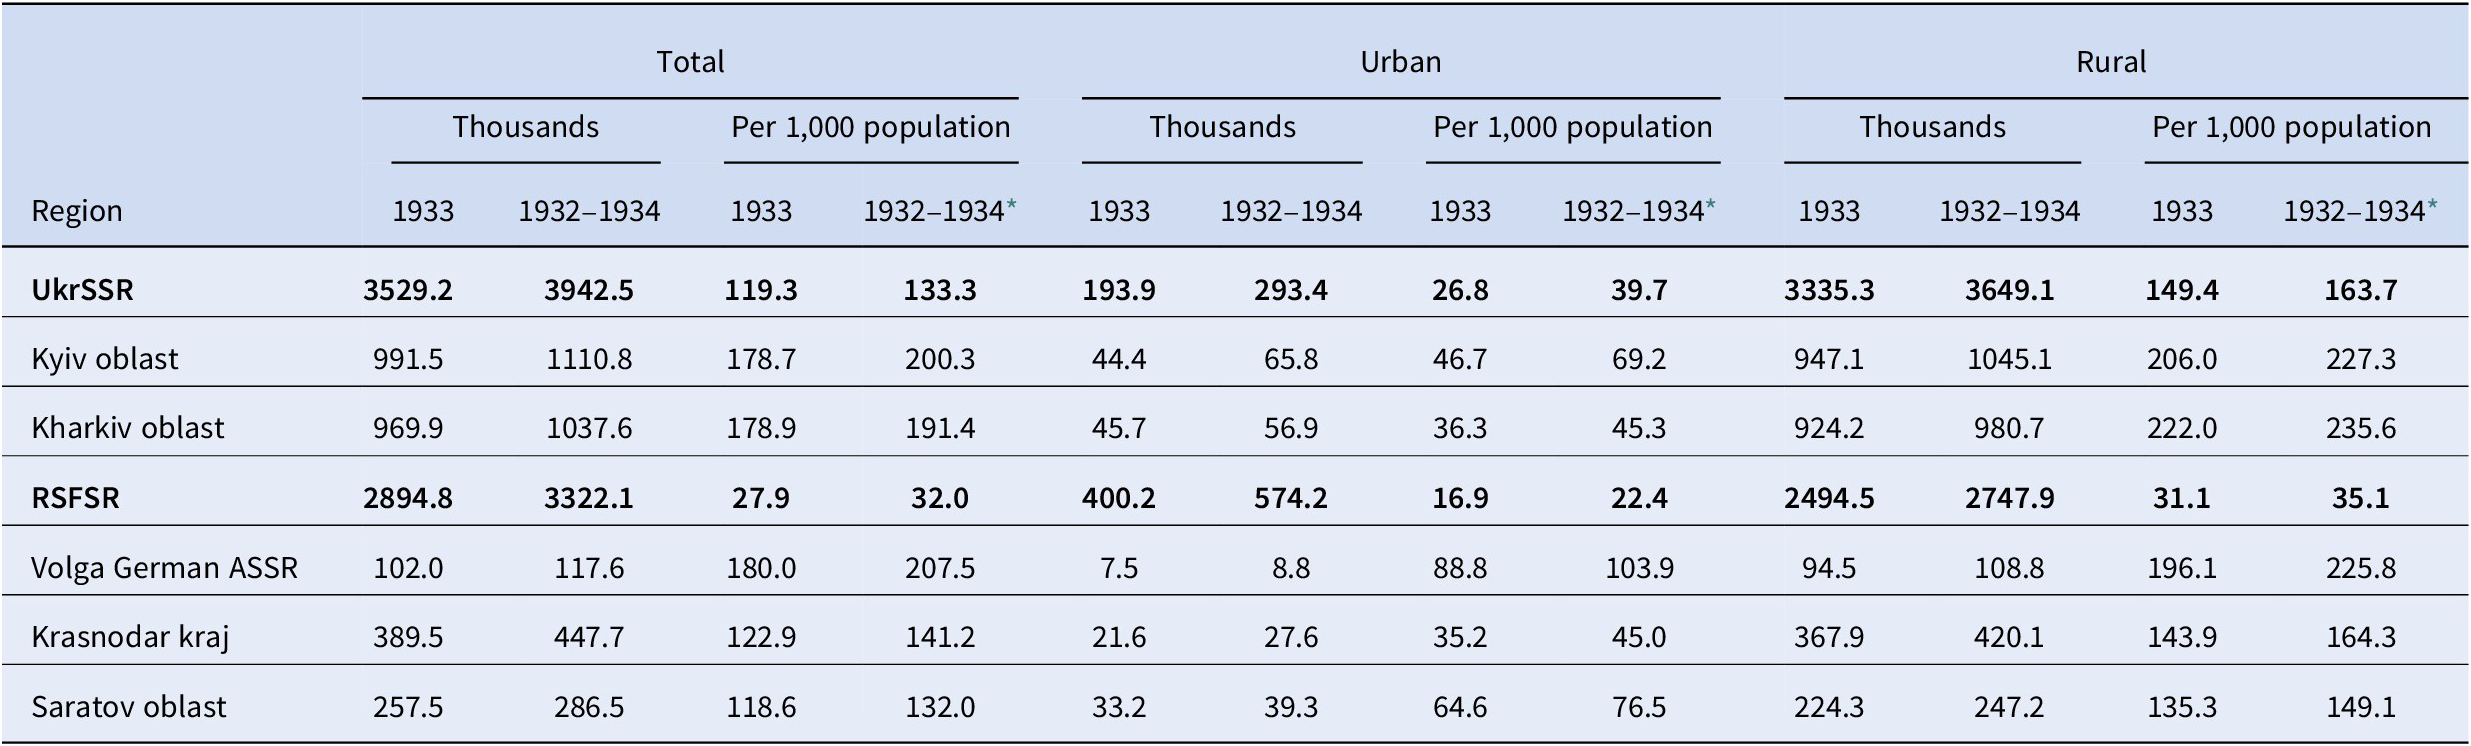
The number of 1932–1934 Famine direct losses is estimated at 3,942.5 thousand in UkrSSRFootnote 7 and 3,322.1 thousand in RSFSR (Table 1). The relative direct losses, per 1,000 population, are 133.3 in Soviet Ukraine and 32.0 in Russian Federation, that is, direct losses in RSFSR are 4.2 times smaller than in UkrSSR. Relative 1932–1934 direct losses for UkrSSR and RSFSR by region are shown in Figures 1 and 2. Regions in Soviet Ukraine can be divided into three groups (Figure 1). Kyiv and Kharkiv oblasts have the highest losses per 1,000 population: 200.3 and 191.4, respectively. The second group is composed of Vinnytsa, Dnipropetrovsk, Odesa oblasts, and Moldavian ASSR, with 125.6, 101.9, 107.6, and 120.2 relative losses, respectively. Chernihiv and Donetsk oblasts have much lower relative losses, with 91.3 and 54.2, respectively.
Table 1. Direct losses (excess deaths) for UkrSSR and RSFSR in numbers and per 1,000 population: Total and highly affected regions.

* Summary indicator: Total number of direct losses in 1932–1934/1933 mid-year population.
Source: Authors’ calculations.

Figure 1. Direct losses (excess deaths) per 1,000 population by oblast: UkrSSR 1932–1934. Source: Authors’ calculations.

Figure 2. Direct losses (excess deaths) per 1,000 population by region: RSFSR 1932–1934. *Indicates excluding Volga German ASSR and Saratov oblast. **Excluding Krasnodar kraj. Source: Authors’ calculations.
Regions in Russian Federation can be classified into five groups (Figure 2). Volga German ASSR, Krasnodar kraj, and Saratov oblast had the highest losses in 1932–1934: 207.5, 141.2, and 132.0 per 1,000 population, respectively. The second group is composed of North Caucasus kraj (excluding Krasnodar kraj) and Lower Volga kraj (excluding Volga German ASSR and Saratov oblast), with 76.0 and 57.3, respectively. West Siberia krai, Ural oblast, Central Volga kraj, and Central Black-Earth oblast make the third group, with relative losses within the 33.8–38.4 range. The fourth group includes the largest number of regions: Bashkortostan ASSR, East Siberia kraj, Far East kraj, Yakutia ASSR, Northern kraj, Tatarstan ASSR, and Crimea ASSR, with losses between 12.9 and 26.0 per 1,000 population. The fifth group, composed of Western oblast, Leningrad-Karel oblast, Gorkiy kraj, and Central-Industrial oblast, is the least affected by the famine, with direct losses between 2.1 and 10.7 per 1,000 population, respectively.
A comparative analysis of the 1933 excess deaths across UkrSSR and RSFSR reveals the following situation. First, the regional variation in relative direct losses is significantly larger in RSFSR than in UkrSSR. Losses in the Russian Federation vary from very high to almost no losses. Volga German ASSR has losses 50 times larger than the Western oblast, whereas in the UkrSSR, the highest regional values in Kharkiv and Kyiv oblasts are only 4.4 times higher than in Donetsk oblast.
Second, regions in Soviet Ukraine with relative rural excess deaths between 130.0 and 222.0 (per 1,000) comprise 33.8 percent of the republic’s territory and 40.5 percent of the rural population (1926 census), while the respective percentages in Russia are 1.2 percent and 6.3 percent (Table 2). The majority of regions in the Russian Federation have less than 50 rural direct losses per 1,000 population, and they comprise 95.8 percent of territory and 84.9 percent of the rural population. Thus, although both republics have regions seriously affected by the Famine, they comprise a much larger proportion in terms of territory and population in UkrSSR than in RSFSR. Volga German ASSR is the only region in the RSFSR that has relative losses comparable with those in the most affected Kyiv and Kharkiv oblasts.
Table 2. Relation between 1933 rural excess deaths and rural population and territory: UkrSSR and RSFSR.

Source: Authors’ calculations.
Third, the geographical distributions of direct losses in the two republics are different (Figure 3). It was logical to expect that the grain-growing regions located in the Southern-steppe regions of UkrSSR and RSFSR would be most affected by the Famine. Volga German ASSR, Krasnodar kraj, and Saratov oblast are part of the main grain-growing areas of the Russian Federation. However, our estimates revealed that this is not the case in Soviet Ukraine where the highest losses are found in Kyiv and Kharkiv oblasts, not in the main grain-growing steppe oblasts of Odesa and Dnipropetrovsk (Wolowyna et al. Reference Wolowyna, Plokhy, Levchuk, Rudnytskyi, Kovbasiuk and Shevchuk2016). What is also important is that in RSFSR the grain-producing Central Black-Earth oblast and Central Volga kraj had significantly lower losses than Volga German ASSR, Krasnodar kraj, and Saratov oblast.
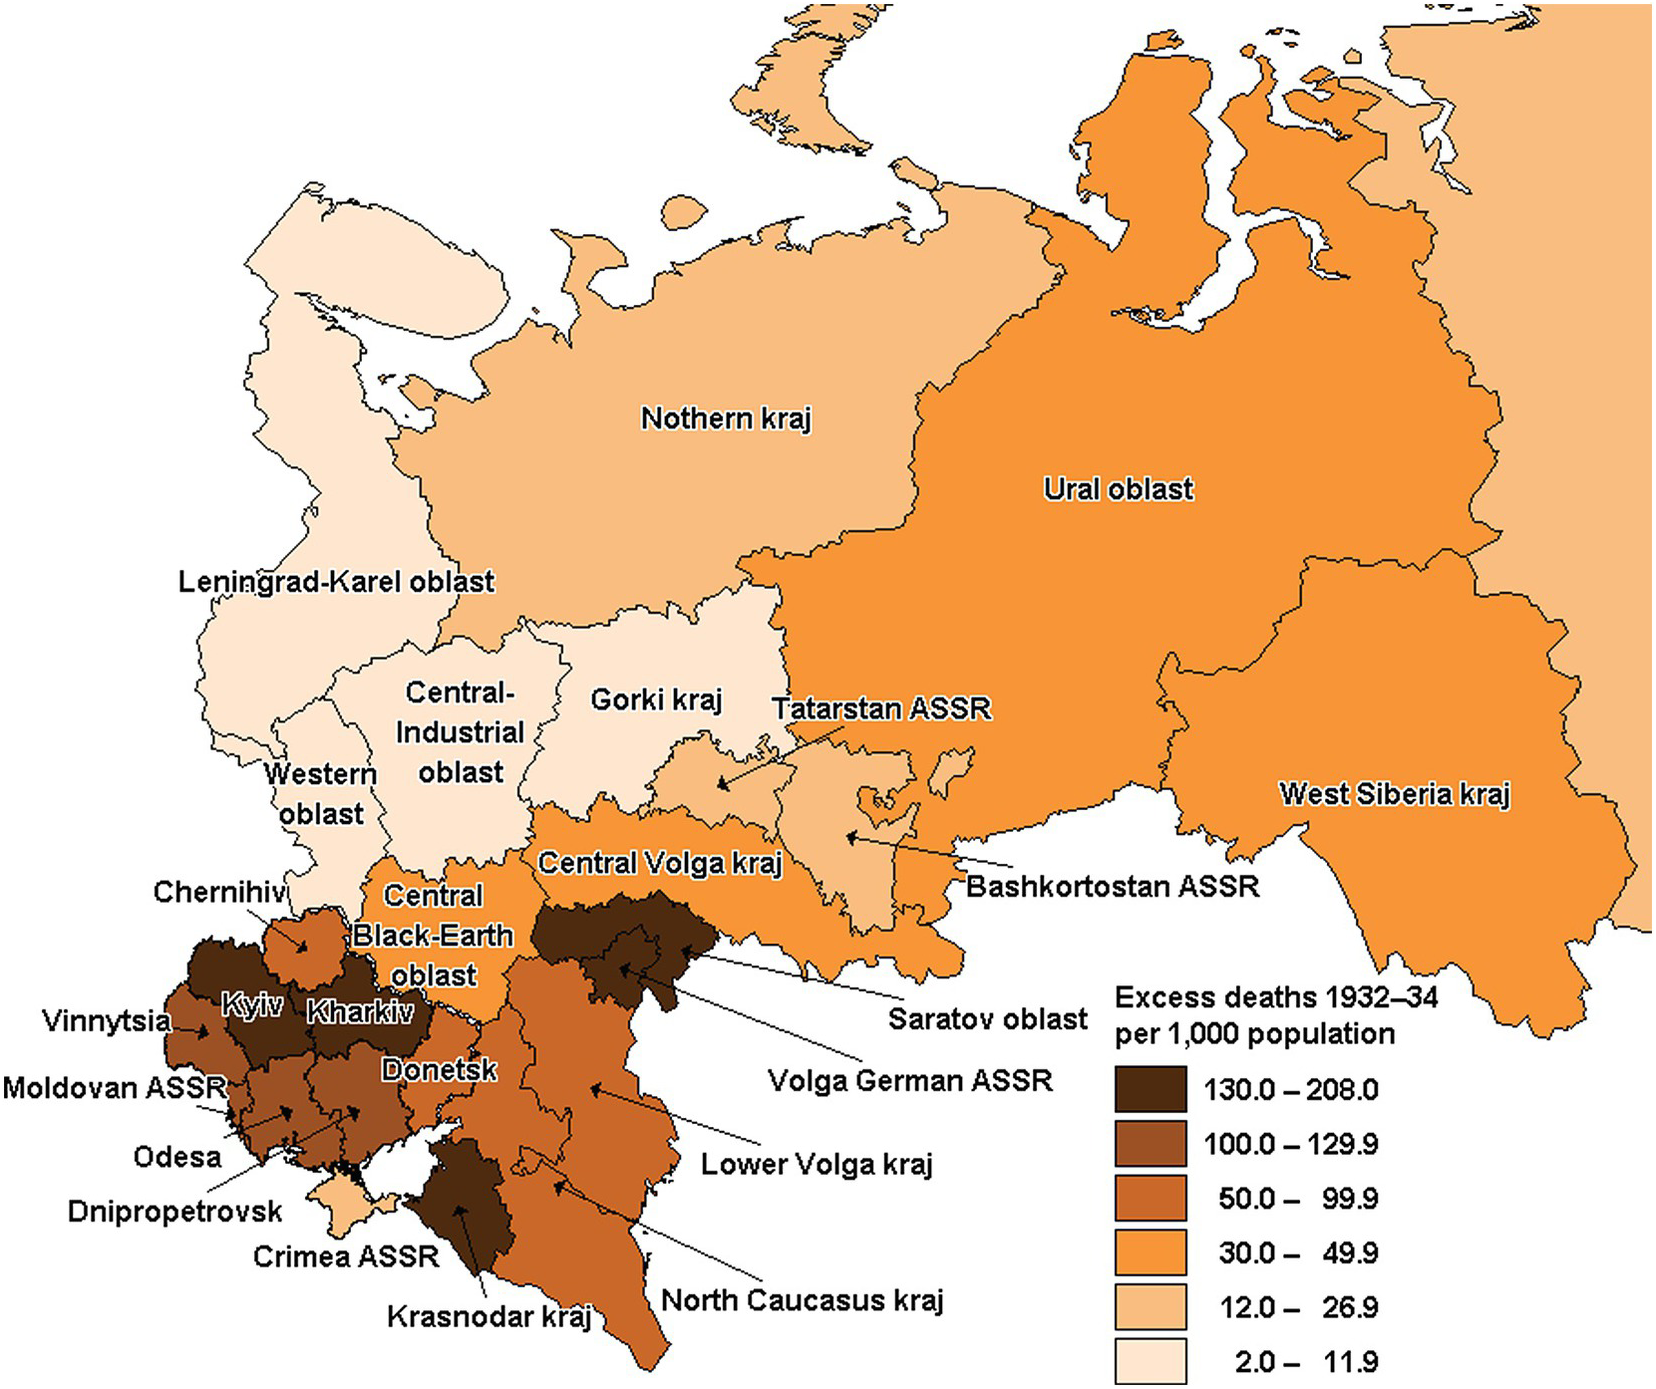
Figure 3. Map of 1932–1934 excess deaths for UkrSSR and European part of RSFSR.
Discussion
In this section we analyze some factors that may account for the differences we found in the spatial distributions of Famine losses within and between UkrSSR and RSFSR: (a) grain procurement quotas in 1931–1932 (b) peasant resistance and repressions, (c) the nationality factor, and (d) other factors. As the discussion of regional Holodomor direct losses within UkrSSR has been presented in our previous work (Wolowyna et al. Reference Wolowyna, Plokhy, Levchuk, Rudnytskyi, Kovbasiuk and Shevchuk2016), we mainly focus here on a comparative analysis of Soviet Ukraine as a whole with the four regions of the Russian Federation that suffered the most: Lower Volga krai with German ASSR and Saratov oblast, North Caucasus with Krasnodar kraj, Central Black-Earth oblast, and Central Volga kraj.
Grain Procurement Quotas in 1931–1932
In 1931, the initial grain procurement quotas were substantially reduced for Central Volga and Lower Volga krais (by 46 and 39 percent, respectively), slightly increased for North Caucasus and Central Black-Earth oblast while the plan was not changed for UkrSSR (Table 3). North Caucasus and the Central Black-Earth oblast fulfilled their initial 1931 quotas (collective farms and independent farmers) by almost 100 percent, UkrSSR 91 percent, and Lower Volga and Central Volga krais 70 and 60 percent, respectively. It should be emphasized here that the 1931 grain procurement plan was fulfilled primarily at the expense of the Ukrainian SSR and the North Caucasus. These two regions almost did not receive a reduction in their 1931 quotas and experienced the greatest burden of the grain procurements by delivering two-thirds of the total amount of grain procured in the five main grain-producing regions of the USSR. The situation was different in 1932. The USSR’s original grain-procurement plan, established on May 6, 1932, was reduced by 19 percent compared to the plan in 1931 (with a range from 9.4 percent in Central Black-Earth oblast to 33.3 percent in Central Volga kraj) (Pyrih Reference Pyrih2007, 150–151). This plan was revised several times. The UkrSSR and the North Caucasus received the largest reduction in their original quotas by 35 and 30 percent, respectively, compared to the plan of May 6, 1932.
Table 3. The 1931 grain procurements: UkrSSR and selected regions of the RSFSR.

* Reduction of original procurements quotas as of October 31, 1932; data for collective farms, state farms, and independent farmers.
** Data for collective farms and independent farmers.
Sources: Davies and Wheatcroft (Reference Davies and Wheatcroft2004) and authors’ calculations.
UkrSSR and North Caucasus completed the initial plans at 62 and 72 percent, respectively (collective farms and independent farmersFootnote 8). By contrast, Central Volga had no change in its grain procurement quota, Lower Volga’s and Central Black-Earth’s quotas were reduced by 5–6 percent, and the three regions almost fulfilled their quotas (Table 4). We do not have data on grain procurements for the Volga German ASSR and Saratov oblast, but the archival documents indicate a high rate of plan fulfillment in these regions (Davis and Wheatcroft Reference Davies and Wheatcroft2004, 181; Kondrashin 2012, vol. 2, 229).
Table 4. The 1932 grain procurements* and 1932–1934 rural direct losses: UkrSSR and selected regions of the RSFSR.

* Data for collective farms and independent farmers.
** Compared to the plan of May 6, 1932.
Sources: Davies and Wheatcroft (Reference Davies and Wheatcroft2004) and authors’ calculations.
Comparative analysis of the actual procurements in 1931 and 1932 by region shows that the largest amount of grain was requisitioned in the UkrSSR. The North Caucasus and Central Black-Earth oblast are in the second place, and Lower Volga and Central Volga krajs hold the third position (Tables 3 and 4). However, if we calculate the relative amount of grain procured per 1,000 rural population, then the maximum number in 1931 is found for North Caucasus followed by the Ukrainian SSR, Lower Volga kraj, Central Black-Earth oblast, and Central Volga kraj (listed in descending order). In 1932, the rank of regions by their relative actual grain procurements differed: (1) Lower Volga, (2) Central Volga and North Caucasus, and (3) Central Black-Earth oblast and the Ukrainian SSR (in descending order). Table 4 shows that the relative numbers of actual grain procurement in 1932 do not correlate with the relative excess deaths during the Famine. For instance, Lower Volga kraj had the highest amount of actual grain procurement per 1,000 rural population, but was second after Ukraine in terms of population losses. North Caucasus’s losses are almost three times higher than Central Black-Earth oblast’s losses, although they had very similar relative indicators of actual grain procurements.
Despite the reduction in both planned and actual grain procurements in 1932 compared to 1931, UkrSSR and North Caucasus differed from other regions by some important characteristics of the 1932 grain procurement campaign.
First, beginning in January 1932 the districts and collective farms that fulfilled their plans were often forced to continue collecting grain in order to cover the quotas of those who failed to fulfill their procurement targets. Thus, all remaining grain was taken away, even in collective farms with completed quotas. The practice of the so-called counter plans (additional plans) was most widespread in the regions lagging behind the collection of grain, such as in UkrSSR and North Caucasus. Although counter plan practice was abolished in January of 1933, this decision came into effect only after the new harvest in summer of 1933 (Kondrashin 2013, vol. 3, 54–55).
Second, the duration of the 1932 grain procurement campaign in these two regions was unusually long and continued until the spring of 1933. It is important to note that Stalin almost did not target Russian regions for obtaining extra grain after they had eventually archived in full their grain collection plans by January 1933. By contrast, in UkrSSR the period of grain collections was greatly extended, and the seed requisition for the spring sowing campaign was launched while the grain collections still continued (Pyrih Reference Pyrih2007, 624). The decree of January 14, 1933 indicates that Kyiv and Vinyytsia oblasts of the UkrSSR met their quotas but at the same time were required to continue grain collection (Pyrih Reference Pyrih2007, 602). Next, the decree of January 29, 1933 stated that all grain collected over the fulfilled plan in Kyiv and Vinnytsia oblasts from February 1 until April 1, 1933, should be used for the sowing campaign (Pyrih Reference Pyrih2007, 625). Even though the decree of February 6, 1933 stopped grain procurements in Ukraine, there is evidence that homes were searched for hidden grain through February, and even in March foodstuffs were confiscated (Pyrih Reference Pyrih2007, 700, 741).
Third, in order to intensify grain procurements, in late 1932 the Soviet regime made a very harsh decision to confiscate all available grain reserves (including seed reserves) from the collective farms in UkrSSR that had not met their grain quotas (Pyrih Reference Pyrih2007, 390, 399, 521, 522, 530, 579). There is no evidence that this practice was implemented in the grain-producing regions of the RSFSR. In addition, confiscation of grain that had been paid to collective farmers for work previously performed was widely spread. As a result, these policies left the peasantry with no grain reserves at the start of the sowing campaign in most regions of UkrSSR and North Caucasus.
The Peasant Resistance and Repressions
Although the level of peasant protest activity in the USSR in the early 1930s was lower than in 1918–1921, the Soviet authorities encountered high peasant resistance during the period of collectivization and seizure of grain. The opposition had active and passive forms. The following active protest activities took place in 1928–1932: terror acts against local party representatives and rural activists, arson, mass peasant uprisings, and anti-Soviet propaganda (distribution of leaflets and proclamations). The passive forms of peasant protest involved the phenomenon that the Soviet leaders called “sabotage of grain procurement”: massive exodus from collective farms and fleeing from villages, hiding grain, unwillingness to work efficiently, and refusal to fulfill the quotas. The peak of peasant protests during the period of collectivization in the USSR was observed in 1930. There were 13,794 terror acts in the USSR that year, including 2,779 in Ukraine, 1,088 in Central Black-Earth oblast, 711 in Lower Volga kraj, 636 in the Central Volga kraj, and 613 in the North Caucasus (Danilov and Berelowitch Reference Danilov and Berelowitch1994; Graziosi Reference Graziosi1994). However, in terms of relative number of terror acts per one million rural population, the highest levels were observed in Lower Volga (156.1) and in UkrSSR (111.7), followed by 101.6 in Central Volga kraj, 102.3 in Central Black-Earth oblast, and 75.1 in North Caucasus.
The next wave of peasant protest activity was observed between late 1931 and early 1932. Table 5 presents data on certain active forms of resistance for the period October 1931–March 1932 (mass peasant uprisings, number of their participants, terror acts), and the regional excess deaths in 1932–1934. Although there is a correlation between these indicators, the relationship is not highly statistically significant. Lower Volga kraj has the highest relative indicators of active protest activity but has second place after Ukraine in terms of population losses. Some archival documents also suggest that active forms of protest in early 1932 were much less common in Central Black-Earth oblast and Central Volga kraj than in UkrSSR and Lower Volga. Instead, passive forms of peasant opposition were more common in these two regions, in particular, fleeing from villages (especially in Central Black-Earth oblast) and exodus from collective farms (Danilov, Manning, and Viola Reference Danilov, Manning and Viola2001, 318–354).
Table 5. Selected Indicators of Peasant Resistance in 1931–1932* and rural direct losses in 1932–1934: UkrSSR and selected regions of the RSFSR.

* October 1931–March 1932.
Sources: Danilov et al. (Reference Danilov, Manning and Viola2001, 318–354) and authors’ calculations.
We have no information on peasant resistance for different parts of the Lower Volga kraj including Volga German ASSR. The latter was one of the prime collectivization regions. The Volga German ASSR was the first region in the USSR that almost completed collectivization (95 percent) in the summer of 1931 (German Reference German2007). This was accompanied by a high rise in anti-Soviet protests during the first half of 1932 in the Northwestern districts of the Lower Volga kraj and in certain cantons of the Volga German ASSR (Kondrashin, Reference Kondrashin2011, vol. 1, book 2, 79–81).
Some regional data (although incomplete) on UkrSSR provide evidence about higher levels of active protest activities in western and central parts of the Republic compared to the south (Patryliak Reference Patryliak2012, 127–128). Peasant exodus from collective farms in the first half of 1932 was very widespread in the forest-steppe regions (Vinnytsya, Kyiv, and Kharkiv), which suffered the most from starvation, and less prevalent in the steppe regions (Dnipropetrovsk and Odesa) (Wolowyna et al. Reference Wolowyna, Plokhy, Levchuk, Rudnytskyi, Kovbasiuk and Shevchuk2016).
In order to suppress the peasant opposition to collectivization, force peasants to work hard, and fulfill the grain procurement quotas, Soviet authorities used punitive and repressive measures. The implementation of these repressions in the main grain growing regions is closely connected to the activities of three extraordinary committees headed by Molotov in Ukraine, Kaganovich in North Caucasus (dispatched on October 22, 1932), and by Postyshev in Lower Volga (dispatched on November 29, 1932) (Pyrih, Reference Pyrih2007, 349). Below are the main directives adopted by the Soviet government during the second half of 1932 and the first half of 1933. They created a legal basis for punishing peasants for “sabotage” of the fulfillment of the grain procurement quotas:
Punishment for “Stealing Bread” and “Sabotage of Grain Procurement”
• August 7, 1932: decree of the Council of People’s Commissars (CPC) of the USSR (known as “Law of Five Spikelets”) whereby “stealing collective farm property” was punishable by shooting or imprisonment for at least 10 years (Pyrih Reference Pyrih2007, 282)
• November 4, 1932: decree of the North Caucasus Kraj Committee of Communist Party (with the direct participation of Kaganovich): (a) placement of three villages on the black list; (b) prohibition of delivering any goods to 10 districts (including eight Kuban districts); (c) prohibition of delivering any goods and seizing all existing goods from ten other districts (all of them were Kuban districts); (d) deprivation of independent farmers of land and their deportation to northern regions of the RSFSR; and (e) punishment for “stealing” State property (Danilov et al. Reference Danilov, Manning and Viola2001, vol. 3, 522)
• December 12, 1932: decree of the Lower Volga Kraj Committee of Communist Party on the placement of 19 villages in seven districts of the kraj on the black list (Kondrashin 2012, vol. 2, 272)
• January 1, 1933: telegram of the Central Committee of the All-Union Communist Party to the Central Committee of the Communist Party of UkrSSR on the voluntary delivery to the State allegedly hidden bread and the use of the severest measures of punishment against all farmers who continue to conceal the “stolen and hidden bread” (Pyrih Reference Pyrih2007, 567)
Food Requisitioning
• November 18 and 20, 1932: resolutions of the Politburo of the Central Committee of the Communist Party of UkrSSR and the CPC of UkrSSR “On measures to strengthen grain procurement” that inсluded (a) fines in kind against peasants and collective farms that failed to meet the grain quotes: confiscation of meat (15-month norm), potatoes, and livestock; (b) placement of villages on the blacklist; (c) requisition of all grain reserves from collective farms that failed to fulfill the grain procurement quotas (with sanction of the regional executive committees); and (d) requisition of grain given previously to peasants for their labor days, in case of nonfulfillment of the grain procurement plan (Pyrih Reference Pyrih2007, 388–395)
• December 16, 1932: decree of the North Caucasus Kraj Committee of Communist Party that included (a) extensive search of grain stolen by collective and independent farmers; (b) use of fines in kind (meat); (c) prohibition to collect any grain reserves at collective farms that failed to fulfill their plans; and (d) additional procurements (over-the-plan) for districts and collective farms that fulfilled their quotes (Danilov et al. Reference Danilov, Manning and Viola2001, 586)
• December 24, 1932: letter from the Central Committee of the Communist Party of UkrSSR, which authorized the mandatory requisitioning all available collective farms’ reserves, including seed reserves, as part of grain procurements (Pyrih Reference Pyrih2007, 521)
Blockade of Borders and Restrictions on Peasant Movement
• January 22, 1933: directive of the Central Committee of the Communist Party of the USSR that prohibited farmers from leaving the territory of Soviet Ukraine and Kuban in search of bread to other areas of the Soviet Union and forced their return to their place of residence (Pyrih Reference Pyrih2007, 609, 616)
• February 16, 1933: extension of the directive as of January 22, 1933 to the Lower Volga kraj, prohibiting peasants’ travel outside their region (Kondrashin 2012, vol. 2, 386)
• March 17, 1933: directive of the Central Executive Committee of the USSR that reduced the possibility of peasant exodus from collective farms and made it very difficult to leave their villages (through the mandatory registration of economic agreements with the collective farmers)
The most important resolutions, with severe repressions against “sabotage of grain procurement,” were issued in the three main grain-producing regions of the USSR within a short amount of time: (a) November 4, 1932 in North Caucasus; (b) November 18 and 20, 1932 in UkrSSR; and (c) December 12, 1932 in Lower Volga kraj. Analysis of archival documents and publications shows that it was Soviet Ukraine and the North Caucasus, in particular Kuban, where a system of the most severe and massive repressions was implemented. The following key elements of this system were (a) fines in kind and in many cases confiscation of all non-grain foodstuffs through massive searches of peasant households (Boriak Reference Boriak2016; Danilov et al. Reference Danilov, Manning and Viola2001, 586; Vasiliev and Shapoval Reference Vasyliev and Shapoval2001); (b) confiscation of all grain reserves, including seed reserves and emergency reserves, from the collective farms that failed to fulfill their grain procurement quotas; (c) the blacklisting regime that was initially implemented in the Kuban region (resolution of November 4, 1932), and two weeks later introduced in UkrSSR (resolution of November 18, 1932); and (d) restrictions on peasants’ movements.
The repressive policies against “peasant sabotage” were also deployed in Lower Volga krai, but not at the same level as in Soviet Ukraine. They included blacklisting and the ban on trade and delivery of goods (Kondrashin 2012, 272). However, the blacklisting policy was not used on such a mass scale in Lower Volga kraj as in UkrSSR; fines in kind and confiscation of all foodstuffs were very rarely used or were only limited to certain areas (Papakin Reference Papakin2013, 296). The decision to ban peasants from leaving the Lower Volga was issued on February 16, 1933, that is, one month after the same decision for UkrSSR and North Caucasus, but the scale of detention of peasants and returning them back was much smaller than in UkrSSR.
The “struggle for bread,” deployed by the Kremlin in Kuban and Soviet Ukraine, served as an intimidation tool for other grain-producing regions. Archival documents and publications indicate the use of the following repressive measures during the grain procurement campaign in Central Volga kraj and Central Black-Earth oblast: arrests, imprisonment and eviction, and confiscation of peasant property and livestock, along with the seizure of grain (Goncharova Reference Goncharova2010, 33). At the same time, there is no document-based evidence on large-scale use of blacklisting or fines in kind. The scope and the extent of repressive measures in these two regions were significantly smaller than in the UkrSSR and Kuban. To a certain extent, this was facilitated by the fact that both regions had almost completed their grain procurement plans by the end of 1932 (Kondrashin 2012, 233).
Nationality Factor
Two important questions are raised: (a) Why were the most massive repressions implemented in UkrSSR and Kuban? (b) Why did the Volga German ASSR and the Saratov oblast suffer the most within the Lower Volga kraj? In our opinion, this can be related to the nationality factor. This section does not attempt to analyze the nationality factor exhaustively, but rather to illustrate its importance.
Table 6 shows the ethnic composition of the rural populations in UkrSSR and the grain-producing regions of the RSFSR. According to the 1926 census data, Ukrainians accounted for 87.5 percent of the rural population of UkrSSR, and they represented the majority in all seven oblasts. In contrast, most Russian regions were not monoethnic. There were more Ukrainians than Russians in Krasnodar kraj, but the proportion of Russians was rather high. In the Kuban district (part of the Krasnodar krai), Ukrainians accounted for two-thirds of the rural population. There were also Ukrainians in Central Black-Earth oblast, mostly in the western and southern parts bordering Soviet Ukraine (Voronezh and Kursk), with 19 and 33 percent of the rural population, respectively. The majority of the population was German in the Volga German ASSR, and Russians were the majority in Central Black-Earth oblast, Central Volga kraj, and Saratov oblast.
Table 6. Rural population distribution by ethnicity*: UkrSSR and selected regions of RSFSR, 1926.

* Three selected ethnic groups; unadjusted data from 1926 Census.
Sources: CSA USSR. 1927–1929. Т. 1-9.
There are many studies emphasizing the link between Kremlin’s national policy and the repressive policies of the 1930s (Martin Reference Martin2001; Yefimenko Reference Yefimenko, Flier and Graziosi2017). This refers primarily to the UkrSSR, where the massive national liberation movement in 1917–1921 showed the Kremlin that the local peasantry was strongly opposed to the Soviet regime and the Bolsheviks. In order to solve the nationalities question, the policy of korenization (indigenization) was implemented in the 1920s. In December 1932, the Soviet government blamed Ukrainization and bourgeois-nationalist elements in UkrSSR and North Caucasus for the grain procurement failure, and stopped “the non-Bolshevik” Ukrainization in Kuban and, a few days later, in Central Black-Earth oblast (Vasiliev and Shapoval Reference Vasyliev and Shapoval2001, 311–312). This was followed by the purge of the Ukrainian Communist party and Ukrainian intelligentsia.
Data on 1932–1933 mortality for Krasnodar kraj and the Central Black-Earth oblast (regions with higher proportions of ethnic Ukrainians) are available only at the oblast/kraj levels. Although we do not have district-level data on mortality by ethnicity, our calculations show that in Krasnodar kraj, where Ukrainians accounted for half of the rural population, Famine losses in 1932–1934 reached 164.3 per 1,000 rural population, while they were 84.5 in North Caucasus excluding Krasnodar kraj (with 35 percent of ethnic Ukrainians).
There is also evidence that the heavily Ukrainian-populated southern districts of the Central Black-Earth oblast (Kursk and Voronezh oblasts), which were areas of Ukrainization in the oblast, suffered the most from the Famine. While 27 out of 52 districts of the Central Black-Earth oblast, where Ukrainization took place, received increases in their 1932 grain procurement quotas, 75 out of 103 districts of the Central Black-Earth oblast, where the majority of the population was Russian, received reductions of the quotas (Drozdov Reference Drozdov2013, 420).
As mentioned before, the Volga German ASSR and Saratov oblast also suffered substantial losses from the 1932–1934 Famine. At that time, nine out of the 13 districts (cantons) of the Volga German ASSR had German majority and four districts were populated mostly by Russians. The analysis of registered deaths in 1933 revealed significant differences at the district level, and these differences correlate with the national factor. For example, the crude death rate in 1933 was 211 deaths per 1,000 population in the German Baltserovskii canton and 29 in the Russian Staropoltavskyi district.Footnote 9 Almost all German cantons registered very high mortality in 1933, while the death rate in Russian districts was much lower except for the Pokrovskii district. In Saratov oblast, the highest mortality in 1933 was recorded in the right-bank areas.Footnote 9 The possible link between mortality and national composition of the population in this oblast needs further research.
Other Factors
Some scholars suggest that environmental factors had a predominant role in causing the 1932–1933 Famine losses. Tauger (Reference Tauger2001) has challenged Conquest’s (Reference Conquest1986) statement regarding a politically motivated and manmade Famine in Ukraine and argued that environmental factors played a major role in determining high Famine losses, while all other factors, including human actions, only exacerbated this naturally caused disaster. He claims that the grain harvests of 1931 and 1932 were low mostly because of environmental conditions and this was the primary reason for the Famine that affected regions throughout the USSR, including UkrSSR (Tauger Reference Tauger1991, Reference Tauger2001). He refers to regional droughts, heavy rainfall in 1932, plant diseases, and insect infestations as significant natural factors responsible for the lower harvest.
Based on analysis of monthly average temperature and precipitations in UkrSSR by region throughout the 1926–1932 period, we argue that the 1932–1933 Famine in UkrSSR was not, as is often alleged, related to drought. Instead, low temperatures in February 1932 and late spring could have delayed the start of the sowing campaign, while heavy rains in June 1932 could have damaged crops and reduced yield in some regions of UkrSSR. Nevertheless, the argument that these environmental problems could have reduced the 1932 harvest of Soviet Ukraine to such serious famine levels is not plausible for the following reasons.
First, the magnitude of losses in UkrSSR is much higher than losses in other famines where weather was a key factor. For example, excess deaths during the 1921–1923 famine in Soviet Ukraine, when adverse weather conditions played a major role in determining famine, are estimated at 11.6 per 1,000 population, compared to 163.7 per 1,000 population for the 1932–1934 (Rudnytskyi et al. Reference Rudnytskyi, Kulchytskyi, Gladun and Kulyk2019), that is, more than ten times higher. Second, the argument that the weather was the main factor in reducing the 1932 harvest, which in turn led to the serious 1932–1934 famine, oversimplifies the situation, given the fact that there were raions in the UkrSSR located side by side in similar environmental conditions that suffered losses to a different extent (see Ukrainian Research Institute at Harvard University 2018). Although the unfavorable weather conditions may have affected 1932 crop yields in some regions of UkrSSR, there is no justification for ignoring or dismissing the possible effects of such well documented directives like the closing of borders with RSFSR and Byelorussian SSR and the confiscation of all foodstuffs during many searches. The role of weather conditions in the 1932–1933 Famine for regions outside of Ukraine needs also to be further explored.
Considering the 1932–1933 Famine as a result of both environmental and human actions, Davies and Wheatcroft (Reference Davies and Wheatcroft2004) admit that State procurement policy contributed to the crisis but believe that the Soviet-wide Famine, including the Famine in Ukraine, was rather an unexpected accident resulting from a series of wrongheaded agricultural policies. Wheatcroft and Garnaut (Reference Wheatcroft and Garnaut2013, 389–390) suggest the following explanation for the extremely high 1933 losses in Kyiv oblast of UkrSSR. The nonfulfillment of the 1932 grain quota in UkrSSR forced the Soviet government to lower the central food allocations to urban areas and change their distribution among cities. In particular, industrial cities in Donetsk oblast were protected, as in they received more food, at the expense of nonindustrial cities in Kyiv oblast. The central food allocation for the population of Kyiv was significantly reduced, and the oblast government started collecting grain from local rural areas to feed its urban population.
Although the issue of food distribution policy among the urban population is beyond the scope of this article, it is clear that the Soviet government’s capacity to supply urban residents was decreasing during the Famine crisis, and the amount of food allocation through the rationing system to the population was reduced. However, Wheatcroft and Garnaut’s (Reference Wheatcroft and Garnaut2013) argument overlooks an important fact that Kyiv oblast eventually met its 1932 grain procurement quotas (decree of January 14, 1933). Wheatcroft and Garnaut (Reference Wheatcroft and Garnaut2013, 390) also fail to provide evidence for their assertion. In addition, Kharkiv oblast had as high level of losses as Kyiv oblast in 1933, but Wheatcroft and Garnaut do not provide an explanation for this.
It is also worth mentioning that in the first half of 1933, the Soviet government provided food aid to UkrSSR and several regions of RSFSR. Plokhy (Reference Plokhy and Plokhy2016) suggested that the geography of Famine losses in UkrSSR might be also partly explained by Soviet government policies that favored the main southern grain-producing oblasts of Ukraine over the steppe-boreal and boreal zones of central and northern Ukraine, which grew less grain or none at all. In particular, the strategically important Odesa and Dnipropertrovsk oblasts were allocated higher 1932 procurement quotas but received significantly more food relief at the height of the Famine than Kyiv, whereas Vinnytsia and Kharkiv oblasts had lower quotas, but the central government was reluctant to provide them with sufficient food assistance. A detailed analysis of the 1933 food aid program in UkrSSR and RSFSR is provided by Wolowyna et al. (Reference Wolowyna, Levchuk and Kovbasiuk2019). Here we only note that this assistance did have some effect on the monthly variations in rural excess deaths in both Republics, but it was provided only to those who were able to work and fulfilled their work norm. However, it was insufficient to prevent huge human losses.
Conclusions
The 1932–1934 Famine affected both Soviet Ukraine and the Russian Federation. However, the statement about fairly similar consequences of the Famine in both republics is not supported by demographic evidence. First, the relative direct losses (excess deaths) in 1932–1934 are four times higher in UkrSSR than in RSFSR. Second, high Famine losses in RSFSR are mainly concentrated in a limited set of regions with relatively small population sizes, while in UkrSSR the extraordinary level of mortality due to the Famine was observed in a much larger proportion of its territory and population. Third, an important finding of our research is that there is no correspondence between the patterns of geographical distribution of losses in UkrSSR and RSFSR. The highest excess deaths in Soviet Ukraine are mostly found in the central forest-steppe zone, as in, not prime grain-growing regions. By contrast, in the Russian Federation, the four main grain-producing regions suffered the most.
Our results show that the link between the Famine losses and grain procurement factor is not straightforward. The assertion that the scale of losses is determined exclusively by the grain specialization of the region and the contribution to grain collections is not confirmed in Ukraine, but is partially confirmed in Russia, because (a) the most affected oblasts in UkrSSR, Kyiv and Kharkiv, did not play a major role in the grain procurement campaign; and (b) the highest population losses in the RSFSR were found in the Lower Volga kraj, which also had the highest actual grain procurement per 1,000 rural population in 1932. However, there is no correlation between population losses and grain quotas for the other grain-producing regions of RSFSR. In particular, the 1932 actual relative grain procurements in North Caucasus and Central Black-Earth oblast were almost the same (per 1,000 rural population), but the relative rural losses were three times higher in North Caucasus than in Central Black-Earth oblast.
We also argue that the regional pattern of the 1932–1933 Famine-induced mortality in UkrSSR and RSFSR had a political as well as ethno-social dimension. The highest 1932–1933 Famine losses were observed in those regions where nationality may have been a key factor. By blaming “the irresponsible non-Bolshevik Ukrainization” in UkrSSR and Kuban for grain procurement failure, the Soviet officials gave a national interpretation of the 1932 grain collection crisis (Martin Reference Martin2001, 302–303) and used it as a basis for the implementation of severe and large-scale repressions in regions known for their history of resistance to the Soviet regime. There is evidence that this resistance was greater in the regions where the proportion of non-Russians was higher. This applies to Ukrainians, but also to other nationalities like Germans in the Volga German ASSR. In our opinion, abnormally high mortality in 1933 was caused by special punitive measures and practices that were intensively implemented by Soviet authorities in North Caucasus (including Kuban), the Ukrainian SSR, and certain parts of Lower Volga kraj:
1. North Caucasus kraj: (a) Kuban (as a part of North Caucasus) was the first region where punitive measures against peasant sabotage were introduced, including the system of blacklisting; (b) extraction of agricultural products included grain and other foodstuffs; (c) borders were closed to prevent starving peasants from traveling outside Kuban, as well as to neighboring autonomous republics in Northern Caucasus.
2. UkrSSR: (a) All available grain funds (including seed reserves) were confiscated from collective farms that did not met their grain quotas; (b) fines in kind and in many cases confiscation of all foodstuffs were widely implemented; (c) the most extensive practice of blacklisting was implemented, covering the whole territory of UkrSSR and targeting not only collective and State farms but also entire villages and districts; and (d) borders were closed to prevent peasants from traveling in search of food and to restrict peasant movements within UkrSSR.
3. Lower Volga kraj: (a) A limited practice of blacklisting was implemented, compared to UkrSSR; (b) the use of fines in kind was more limited; and (c) the blockade of the borders was not as strict as in Kuban and Soviet Ukraine. However, the situation in the Volga German ASSR and Saratov oblast requires more detailed research.
On the other hand, Central Black-Earth and Central Volga regions of the RSFSR, with much lower Famine losses, had different characteristics. They experienced significantly less intensive repressive measures compared to UkrSSR and Kuban, and there is no evidence of blacklisting, fines in kind, or blockades of borders.
As mentioned before, the highest losses in the Russian Federation are found in the regions with high grain procurements, but the nationality factor in some regions is also important, such as Krasnodar krai for Ukrainians and Volga German ASSR for Germans. On the other hand, we have the case of Saratov oblast with high levels of losses, a rural population of about 80 percent Russian, and limited evidence of strong resistance and repressions.
Although the magnitude of the 1932–1934 Famine in RSFSR was much less dramatic than in UkrSSR, we see that differences in the Famine intensity across small geographic areas of the Russian Federation (such as raions) are substantial and remain unexplained to a large extent. Analyses at the raion level may shed light on some questions such as the following: (a) Is the nationality factor directly related to the level of losses? (b) Is the nationality factor independent from the effect of grain-growing potential of an area? For instance, according to the maps with 1933 rural crude death rates for Ukraine and the European part of USSR published by Wheatcroft and Garnaut (Reference Wheatcroft and Garnaut2013), the highest mortality rates in Central Black-Earth oblast are found in the southern raions of Voronezh and Kursk oblasts, bordering with Ukraine. As Voronezh and Kursk oblasts had the largest concentration of Ukrainians (33.0 and 19.5 percent, respectively, in 1926) and were in the prime grain-growing zone, this may provide an opportunity to estimate the effects of nationality and grain-growing potential on the level of losses. Therefore, estimating Famine losses for small territory units of Russian regions and accounting for ethnicity in both UkrSSR and RSFSR may provide new insights on regional and ethnic differences in the 1932–1933 Famine-induced mortality.
Acknowledgments.
We would like to thank Dr. Andrea Graziosi, Dr. Serhii Plokhii, and two anonymous reviewers for their helpful comments and suggestions. This work has been done in collaboration with MAPA: Digital Atlas of Ukraine project of Harvard Ukrainian Research Institute.
Financial Support.
Research for this article was supported by the Harvard Ukrainian Research Institute and the Ukrainian Studies Fund and the programs it has established.
Disclosure.
Authors have nothing to disclose.