


1. Introduction
The advent of crowdsourcing platforms, such as Amazon's Mechanical Turk (MTurk), has been a boon for survey researchers. MTurk allows researchers to quickly collect data at a substantially lower cost than professional survey providers. The samples are not representative of any particular population, but they tend to be far more diverse than most common convenience samples and tend to replicate a variety of experimental and observational results (Berinsky et al., Reference Berinsky, Huber and Lenz2012; Weinberg et al., Reference Weinberg, Freese and McElhattan2014; Clifford et al., Reference Clifford, Jewell and Waggoner2015; Mullinix et al., Reference Mullinix, Leeper, Druckman and Freese2015).Footnote 1 Though met with skepticism by some, MTurk respondents tend to yield high-quality data when respondents are screened on reputation (Peer et al., Reference Peer, Vosgerau and Acquisti2014). In fact, MTurk samples generally provide higher quality data than student samples, community samples, and even some high-quality national samples (Hauser and Schwarz, Reference Hauser and Schwarz2015; Mullinix et al., Reference Mullinix, Leeper, Druckman and Freese2015; Thomas and Clifford, Reference Thomas and Clifford2017; Anson, Reference Anson2018). For these reasons, the use of MTurk for survey research has grown dramatically across a variety of disciplines, including psychology (Paolacci and Chandler, Reference Paolacci and Chandler2014; Zhou and Fishbach, Reference Zhou and Fishbach2016), economics (Horton et al., Reference Horton, Rand and Zeckhauser2011), public administration (Stritch et al., Reference Stritch, Jin Pedersen and Taggart2017), and sociology (Shank, Reference Shank2016). One survey found that more than 1200 studies were published in 2015 using the service (Bohannon, Reference Bohannon2016), and another reported that more than 40 percent of studies published in two top psychology journals had at least one experiment that used MTurk (Zhou and Fishbach, Reference Zhou and Fishbach2016). Even studies that do not report the results of MTurk experiments often rely on the service to pilot experiments.
However, a new threat to MTurk data quality emerged in the summer of 2018. Several researchers reported suddenly finding high rates of poor quality responses. Many suspected these responses were generated either by bots (semi- or fully-automated code to automatically respond to surveys) or scripts (code that assists humans in responding more rapidly to certain types of questions) (Dreyfuss et al., Reference Dreyfuss, Barrett and Newman2018; Stokel-Walker, Reference Stokel-Walker2018). The problem, however, was quickly traced back to international respondents who mask their location using virtual private servers (VPS; also sometimes referred to as virtual private networks or proxies),Footnote 2 in order to take surveys designed for US participants only. Many of these respondents provided substantially lower-quality responses, including nonsensical answers to open-ended questions, random answers to experimental manipulations, and suspicious responses to demographic questions (Ahler et al., Reference Ahler, Roush and Sood2018; Dennis et al., Reference Dennis, Goodson and Pearson2018; TurkPrime, n.d.). Although international respondents need not necessarily be less attentive than those in the USA, these findings suggest that large proportions of them were not engaging seriously with the surveys they took and their use of tactics to deceive the survey research system suggest they are less trustworthy in their survey behavior. While these studies gave a good indication of the source and severity of the current quality crisis, we still have little idea about the scale and duration of the problem or why it has spiked recently, nor have these studies provided solutions that can easily be incorporated into a researcher's standard workflow.
In this paper, we outline the scale of the quality crisis—its sources and its impact—and assess new methods and tools for ameliorating it. We begin by conducting an audit of our past studies on MTurk. Analyzing 38 surveys conducted over the past five years and encompassing 24,930 respondents, we find that VPS and non-US respondents have spiked in recent months, but that this problem likely traces back to substantially earlier, potentially placing thousands of studies at risk. Next, we detail the impacts of these VPS and non-US respondents on survey quality using two original studies (n = 2010) that incorporate extensive quality checks. Consistent with previous studies, we find little evidence that bots are completing surveys in any notable number (and that bot detection tends to correspond to VPS use). We do, however, find that VPS users provide substantially worse quality data than other respondents, in terms of responses to explicit quality checks, answers to open-ended questions, and responsiveness to experimental treatments. Finally, we introduce a set of tools to identify and prevent fraudulent responses. To remove fraudulent respondentsFootnote 3 retrospectively, we provide new packages in R and Stata, along with an online Shiny app for those who do not use R or Stata. We also introduce an easy-to-implement protocol for Qualtrics that prevents VPS users and international respondents from taking a survey in the first place. We provide evidence from a further study (n = 411) that this screening procedure is effective and causes minimal disruption.
2. What is happening?
To better understand the quality crisis, we conducted an audit of 37 studies fielded by three of the authors since 2013, covering 24,610 respondents. All of these studies requested US respondents with at least a 95 percent approval rate on previous Human Intelligence Tasks (HITs).Footnote 4 For all of the studies, we used IP Hub (https://iphub.info) to gather information on the IP from which the user accessed our surveys. We marked those participants who accessed the surveys through an international IP address (i.e., they took the survey from a non-US location, even though we selected only US respondents from MTurk) or used a VPS service to access the survey (i.e., their internet service provider suggested they were masking their location).
IP Hub produces two levels of VPS detection. When “block” is equal to 1, it indicates that the IP was from a non-residential source, meaning high confidence that a VPS or proxy is being used. When “block” is equal to 2, it indicates that the IP is from a residential source, but has been reported as a potential VPS, meaning that there is uncertainty about whether a VPS is being used. In this section, we ignore the uncertain category, as there are very few respondents in this category. Moreover, as we show below, they do not clearly provide lower-quality data.
The results are stark. Not only did we discover a large number of respondents who were either using a VPS or were located outside of the USA, but we also learned that this was not a new phenomenon. Figure 1 shows the results of this audit, broken down by the month in which the study was conducted. Figure 1A shows the number of total respondents in each month. While we had more respondents in some months than others, in none of them did we have fewer than 150 unique respondents. Figure 1B shows that the largest number of fraudulent respondents comes in summer/fall 2018, when about 20 percent of respondents were coming either from a VPS or a non-US IP address, but we notice a significant proportion of potential fraudulent respondents as far back as April 2015 (over 15 percent of respondents), and even some non-US IP addresses dating back to 2013.Footnote 5
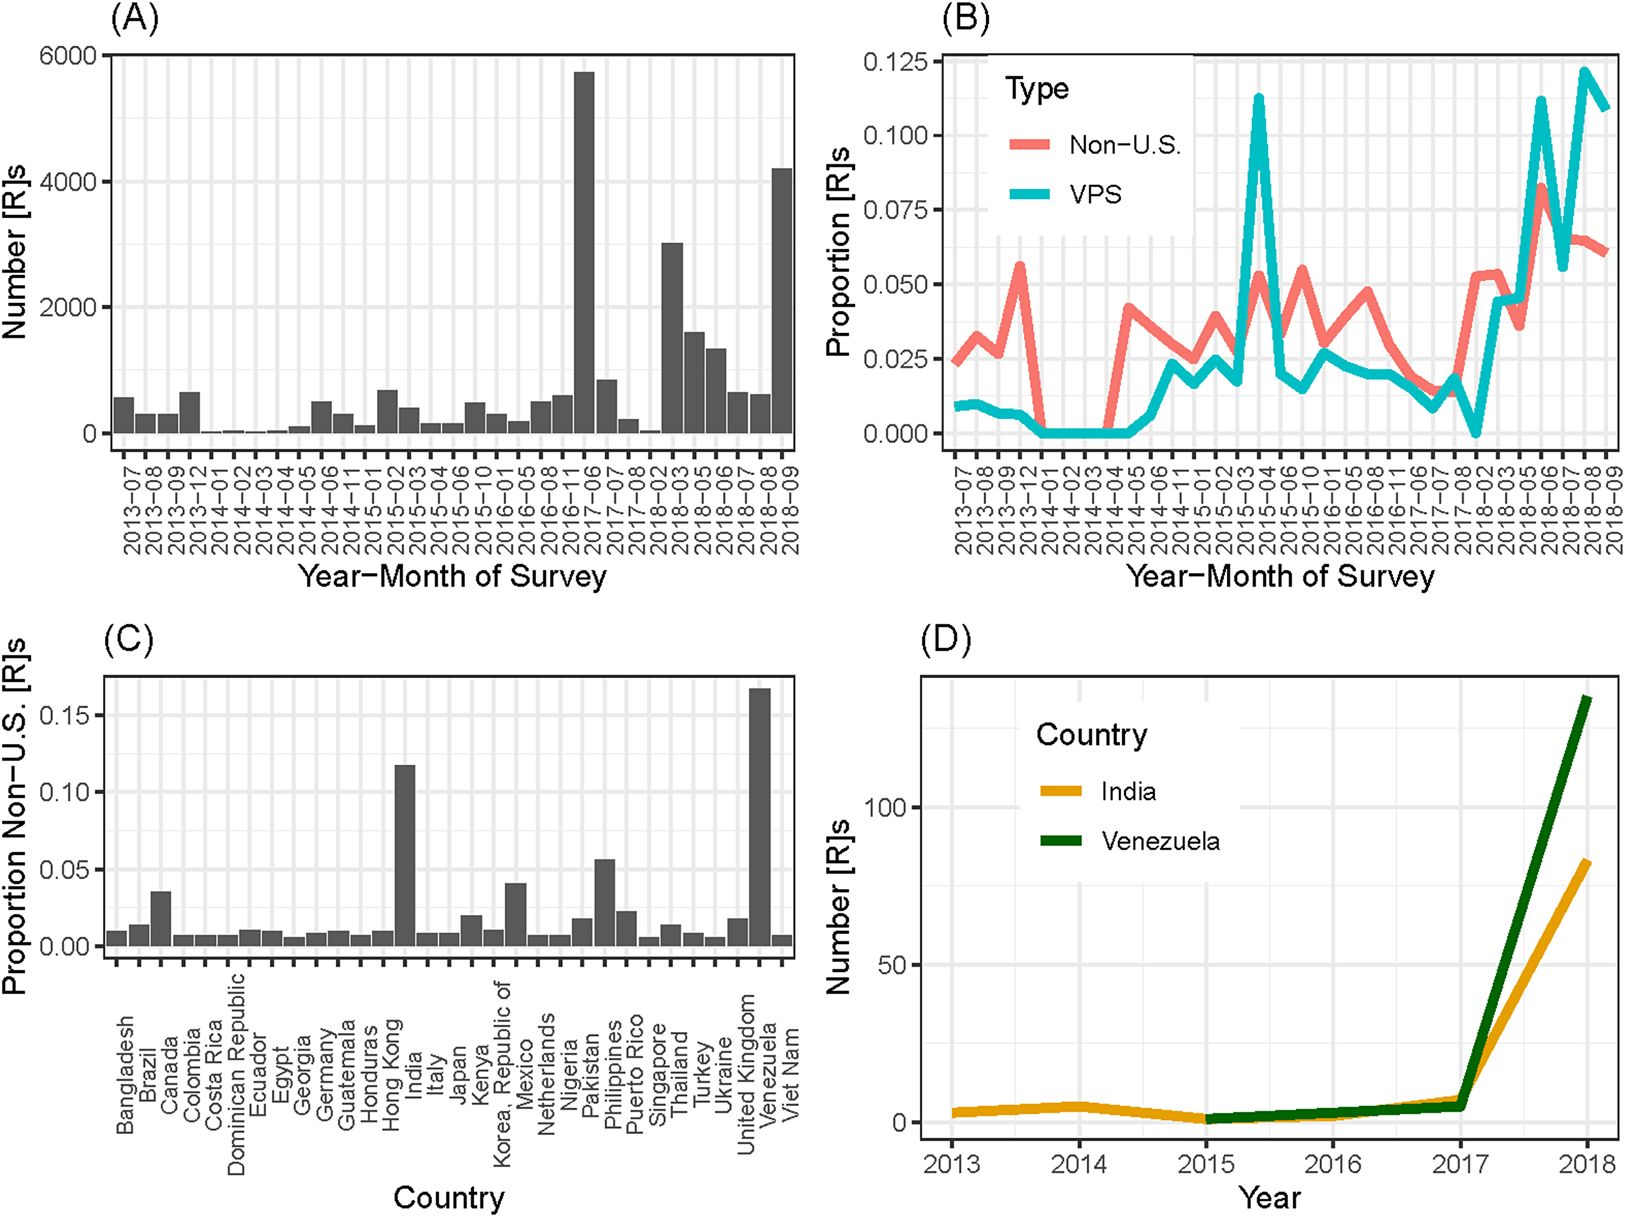
Figure 1. Audit of past studies.
But from where are these responses coming? It is impossible to track down a person's true location when they are using a VPS. Such services have strict privacy policies unless the VPS is being used to break a law.Footnote 6 There are, however, a few clues we can use to make an educated guess. TurkPrime (n.d.) devised a test for English-speakers native to India. They asked respondents to identify a picture of an eggplant, which is known as a “brinjal” in Indian English. A little over half of the fraudulent respondents using a VPS identified it as a “brinjal”; they inferred that these users were likely from India. This, however, does not appear to be the entire explanation. A substantial number of non-US users took our surveys without using a VPS, allowing us to see their true location. These respondents may have simply forgotten to turn on their VPS, though we cannot be sure. Panel C of Figure 1 shows the proportion from each country that contributed more than four responses in our audit. We find the largest proportion of international respondents are coming from Venezuela (about 18 percent), with the second largest coming from India (about 12 percent). Finally, panel D of Figure 1 shows the substantial increase in both these groups since 2017.Footnote 7 Of course, we cannot be sure that this geographic distribution is the same for users who hid their location using a VPS, so the data are suggestive, but not definitive.Footnote 8
The results in this section both raise concerns about the extent of the MTurk quality crisis and provide some indication of its likely sources. However, just because a respondent is using a VPS or is responding from outside of the USA does not necessarily imply they are providing low-quality data. Many people in the USA use VPSs out of privacy concerns and thus our VPS users may be valid respondents. Similarly, some US residents may be responding to MTurk surveys while traveling or living overseas. We directly address this question in the next section.
3. What is the impact?
In this section, we present results from two studies that included a variety of quality checks to see how data quality varies across the IP categories described above. Researchers have identified several sources of low-quality data, including a lack of English proficiency, a lack of familiarity with relevant cultural norms, satisficing, and random responding. Therefore, we developed a range of indicators to measure this diversity of data problems. As we detail below, we examine attention checks, consistency checks, and the quality of open-ended responses. In addition, we replicate well-known correlations and investigate the size of experimental treatment effects. Together, these measures provide a comprehensive look at the quality of data provided by fraudulent respondents.
3.1 Retrospective study 1
For our first retrospective study, we sought to recruit 575 participants from MTurk. Data were collected on 22 August 2018. While 607 respondents began the survey, only 576 completed the survey and are retained for our primary analyses. Respondents were required to be located in the USA, have completed at least 100 HITs, and have an approval rate greater than 95 percent. Respondents were paid $0.75 for completing the study. The study began with a set of demographic questions, continued to a vignette experiment involving judging the character and ideology of individuals, then on to four political knowledge questions and several data quality questions.
We sought to measure data quality in several ways. Although researchers often use instructional manipulation checks (Oppenheimer et al., Reference Oppenheimer, Meyvis and Davidenko2009; Berinsky et al., Reference Berinsky, Margolis and Sances2013), we avoid this style of attention check because the format is easily recognizable, making it less diagnostic of attention among professional survey respondents (Thomas and Clifford, Reference Thomas and Clifford2017). Instead, we rely on novel measures of data quality that are less likely to be gamed. First, early in the survey, we asked respondents to select the year they were born from a drop-down menu. In the final section of the survey we then asked respondents to enter their age. Those whose reported age did not match their birth year were flagged as low-quality respondents. Second, we asked respondents to select their state and to report their city of residence. We expected this may be difficult for respondents from other countries; we flagged as low-quality any response that was not an actual location (e.g., “Texas, Texas”). Third, at the end of the survey we asked respondents to choose their location of residence from a list. The list included their response from the beginning of the survey, along with ten other options that represent the ten least-populated cities in the USA. We flagged as low quality any respondent who did not choose their original answer. This check should be easy for any minimally attentive respondent, but difficult for a bot to pass. Fourth, we asked respondents to explain their main task in the survey in just a few words. Any respondent who did not provide a reasonable description of the survey (e.g., “judge people's character”) were flagged as providing low-quality data (e.g., “NICE”). Finally, we also asked respondents if they had any comments for the researcher. Although many did not answer this question, we flagged responses as low-quality if they were not in English, were unintelligible, or irrelevant to the question prompt. We then created a dichotomous variable representing whether a respondent was flagged as providing low-quality data on any of these five indicators. Among the full sample, 6.8 percent (n = 39) provided low-quality data.
At the end of the survey, we also utilized reCAPTCHA to weed out potential bots (von Ahn et al., Reference von Ahn, Maurer, McMillen, Abraham and Blum2008). Six respondents completed the data quality checks on the page prior to the reCAPTCHA, but did not submit the reCAPTCHA, suggesting there may have been a very small number of bots in our survey. Five of these six respondents were using a VPS (block = 1), suggesting that these potential bots can be identified using IP addresses.
Of the 576 respondents who completed the survey, 71 (12.3 percent) were identified as VPS users (block = 1) and nine (1.6 percent) of uncertain status (block = 2). Additionally, 38 (6.6 percent) were flagged for a non-US location, 25 of whom were not flagged for VPS use.Footnote 9 Together, 96 (16.7 percent) were flagged as fraudulent, with an additional nine (1.6 percent) flagged as potentially fraudulent. In the following, we refer to the remaining 81.7 percent who were not flagged as “valid” respondents.
We now turn to examining whether respondents whose IPs are flagged as fraudulent provide unusually low-quality data (see Figure 2). Of the valid respondents, only 2.8 percent (95 percent CI: 1.6–4.7 percent) were flagged by at least one of the quality checks. Among VPS users, 23.9 percent (15.3–35.5 percent) were flagged as providing low-quality data, while 11 percent (0.9–62.6 percent) of respondents with an uncertain VPS status were flagged for low-quality data. Finally, among non-VPS users who were located outside of the USA, 32.0 percent (16.0–53.7 percent) were flagged as low-quality.Footnote 10 While VPS users and foreign respondents both provided lower-quality data than valid respondents (ps < 0.001), data quality was indistinguishable between VPS users and foreign respondents (p = 0.430), contrary to the claim that many VPS users may be valid US respondents. Overall, tracing the users' IP addresses seems to be effective at identifying low-quality respondents.
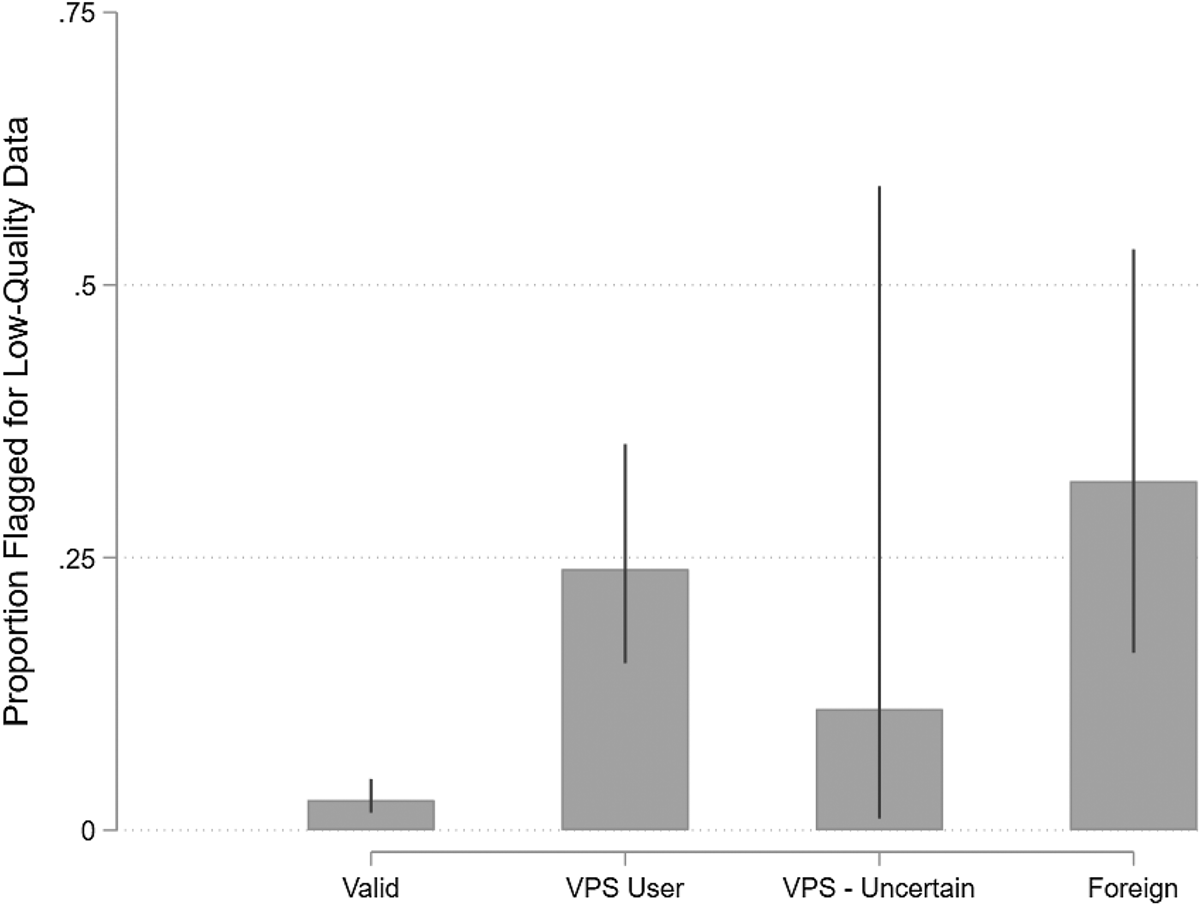
Figure 2. Prevalence of low-quality data by respondent IP type in study 1.
To assess levels of cultural knowledge among foreign respondents, we draw on a set of four general political knowledge questions. Respondents were instructed not to look up the answers, following standard practice (Clifford and Jerit, Reference Clifford and Jerit2016). On average, valid respondents answered 2.7 questions correctly, while VPS users answered significantly fewer correctly (2.3, p = 0.045).Footnote 11 However, our other categories of fraudulent respondents did not significantly differ from the valid respondents (VPS Uncertain: M = 3.00, p = 0.439; Foreign: M = 2.76, p = 0.843). This is surprising at first glance. However, respondents can easily look up the answers to these questions and often do so (Clifford and Jerit, Reference Clifford and Jerit2016). Fraudulent respondents may be particularly inclined to cheat, in order to pass themselves off as valid. While we do not have direct measures of cheating, the time respondents spend on these questions can be used as an indirect indicator. Valid respondents spent an average of 30 s on the four questions.Footnote 12 VPS users, on the other hand, spent more than four times as long (135 s, p < 0.001).Footnote 13 Foreign respondents also spent substantially longer on the knowledge questions (81 s, p < 0.001). Only respondents with uncertain VPS status did not significantly differ from our valid respondents (47 s, p = 0.206), though this comparison is hampered by the small sample size (n = 9). This pattern of results holds even after controlling for the time spent on the remainder of the survey and a set of common covariates (education, gender, race, and political interest), supporting the claim that this is indicative of cheating (see Appendix for model details). These results suggest that our fraudulent respondents know less about US politics, but spent additional time to appear knowledgeable.
Another test involves the link between partisan identification and self-reported political ideology. The relationship should be strong among Americans, but attenuated among foreign or inattentive respondents. Among our valid respondents, the correlation between the two variables is r = 0.86. However, this relationship is much weaker among VPS users (r = 0.45) and foreign respondents (r = 0.44), though not among our respondents of uncertain VPS status (r = 0.92). A regression analysis predicting partisan identification as a function of ideology, respondent status, and interactions between ideology and status demonstrates that ideology is a significantly stronger predictor of partisanship among valid respondents than among VPS users (p < 0.001) and foreign respondents (p = 0.003; see Appendix for model details). Again, these results indicate that respondents who are flagged as fraudulent based on their IP addresses are less likely to have the same cultural knowledge as our valid respondents.
We also sought to examine more directly the consequences of fraudulent respondents on the substantive conclusions that would be reached by researchers. To do so, we analyze an experiment embedded in the study. Respondents in this study were asked to evaluate six individuals based on brief vignettes; each vignette contained ten experimental conditions (including a control) (Clifford, Reference Cliffordn.d.). We stacked the data and estimated evaluations using an ordinary least squares regression model with respondent fixed effects, vignette fixed effects, dummy variables for the nine treatment conditions, and standard errors clustered on the respondent. We then re-estimated this model among three different sets of respondents: the full sample (respondents: 576, observations: 3456), valid respondents who are located in the USA and not using a VPS (respondents: 480, observations: 2880) and fraudulent respondents who are either not located in the USA or are using a VPS (respondents: 96, observations: 576). Full model details are shown in the Appendix.
Figure 3 plots the treatment effects and confidence intervals for the valid sample on the x-axis. The left panel plots the treatment effects for the fraudulent sample on the y-axis and the right-hand panel plots the treatment effects for the full sample on the y-axis. To formalize the relationship, we regressed the nine effects estimated among the fraudulent sample on the same nine effects among the valid sample. Our null hypothesis is an intercept of 0 (no bias in treatment effects) and a slope of 1 (equal responsiveness). The constant is greater than 0 (b = 0.275, p < 0.001), indicating that effects are biased in a positive direction among the fraudulent subsample. The slope is much smaller than 1 (b = 0.284, p < 0.001), indicating that the fraudulent sample is less responsive to differences between the treatments (left-hand panel). We repeat this process by regressing the effects from the full sample on the effects from the valid sample. The constant is close to 0 (b = 0.043, p < 0.001), indicating little bias. However, the slope is significantly smaller than 1 (b = 0.871, p < 0.001), indicating that the full sample produces smaller treatment effects than the valid sample (right-hand panel). These results indicate that fraudulent respondents produce substantially different treatment effects, and these respondents are prevalent enough to cause a small, but a noticeable decrease in treatment effects if they are not removed from the sample. Of course, we cannot be sure of how well this finding generalizes to other studies, a question we take up in more detail in the conclusion.
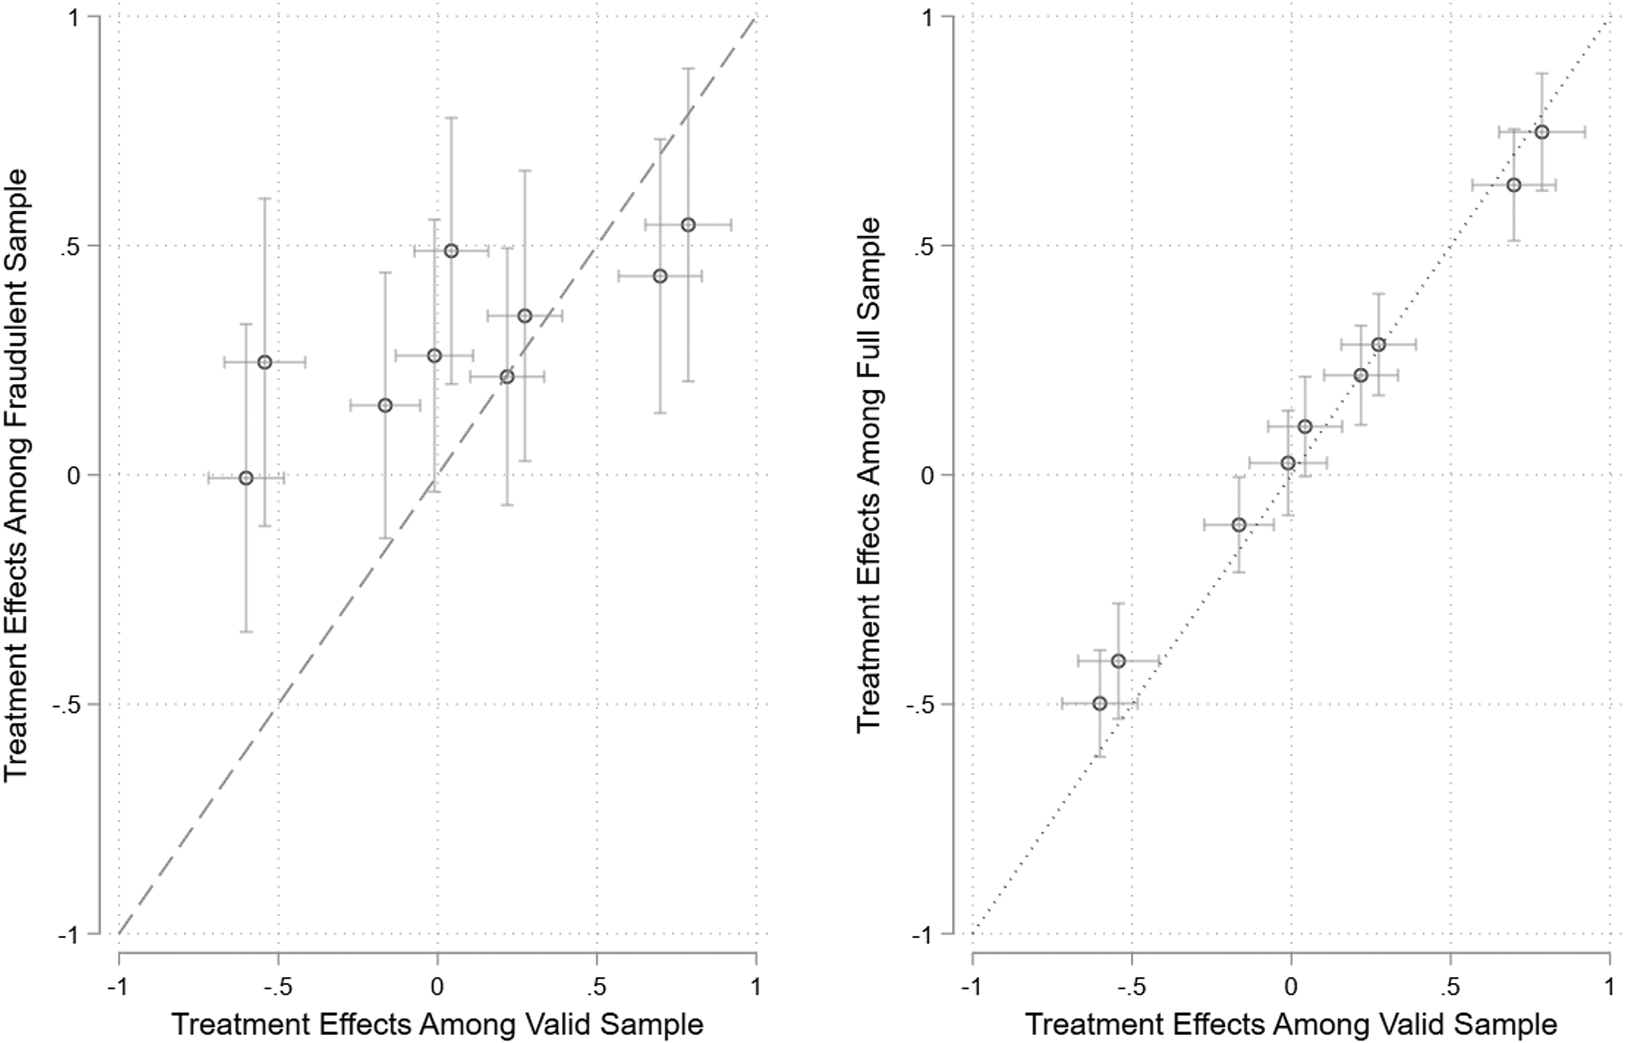
Figure 3. Comparing treatment effects among valid and fraudulent respondents.
3.2 Retrospective study 2
In our second retrospective study, we sought to recruit 1400 respondents on 12–13 September 2018. Though 1641 respondents started the study, only 1440 completed it. Respondents were required to be located in the USA and have an approval rate greater than 95 percent.Footnote 14 Respondents were paid $2.00 for completing the study.
As quality checks, we used the same five indicators from retrospective study 2. In addition, we included two more typical attention checks embedded within the experiment itself. Each followed the format of surrounding questions, but instructed participants to enter a particular response. If respondents failed the first, they were warned. If they failed the second check, they were sent to the end of the survey. These two items provide a more stringent and more common test of data quality.
We also included a reCAPTCHA at the end of the study. In this case, we had no respondents who dropped out of the survey at the reCAPTCHA page, providing no evidence for bots in our survey. Of course, it is possible that some bots failed both attention checks and were sent to the end of the survey. Nonetheless, our data are again inconsistent with bots being a significant contributor to data quality concerns.
Only 51.9 percent of the sample passed both instructed responses and 16.8 percent (n = 241) failed both. Because this latter group was removed from the survey, we cannot assess their data quality on the other five measures. Among respondents who passed both instructed responses, 13.6 percent were flagged as providing low-quality data according to the five alternative indicators, while 18.9 percent of those who failed one instructed response were flagged.
Of the 1440 respondents who completed the survey, including those who failed the attention checks, 73.1 percent (n = 1053) were valid respondents who were not flagged for using a VPS or being outside the USA. The remaining respondents consisted primarily of VPS users (19.3 percent, n = 278), followed by respondents with foreign IP addresses (6.9 percent, n = 100), and finally, those of uncertain VPS status (0.6 percent, n = 9).
Respondents whose IPs were flagged were significantly more likely to fail the attention checks, as shown in Figure 4. While 58.7 percent (55.7–61.6 percent) of valid respondents passed both attention checks, this figure was much lower for VPS users (31.1 percent [25.8–36.8 percent]), users with foreign IPs (41.0 percent [31.7–51.0 percent]), and respondents of uncertain VPS status (22.2 percent [3.9–67.0 percent]). Both VPS users and foreign respondents were significantly less likely to pass attention checks (p < 0.001), but were indistinguishable from each other (p = 0.165), again contrary to concerns that VPS users may be valid US respondents. While standard attention checks clearly help remove fraudulent responses, they are not a perfect solution. The proportion of fraudulent respondents drops from 26.9 to 20.5 percent when excluding respondents who failed at least one attention check. This figure falls only to 17.3 percent when removing respondents who failed either attention check. Thus, typical screeners help identify fraudulent respondents, but do not catch them all, likely because fraud and inattention are related but distinct.
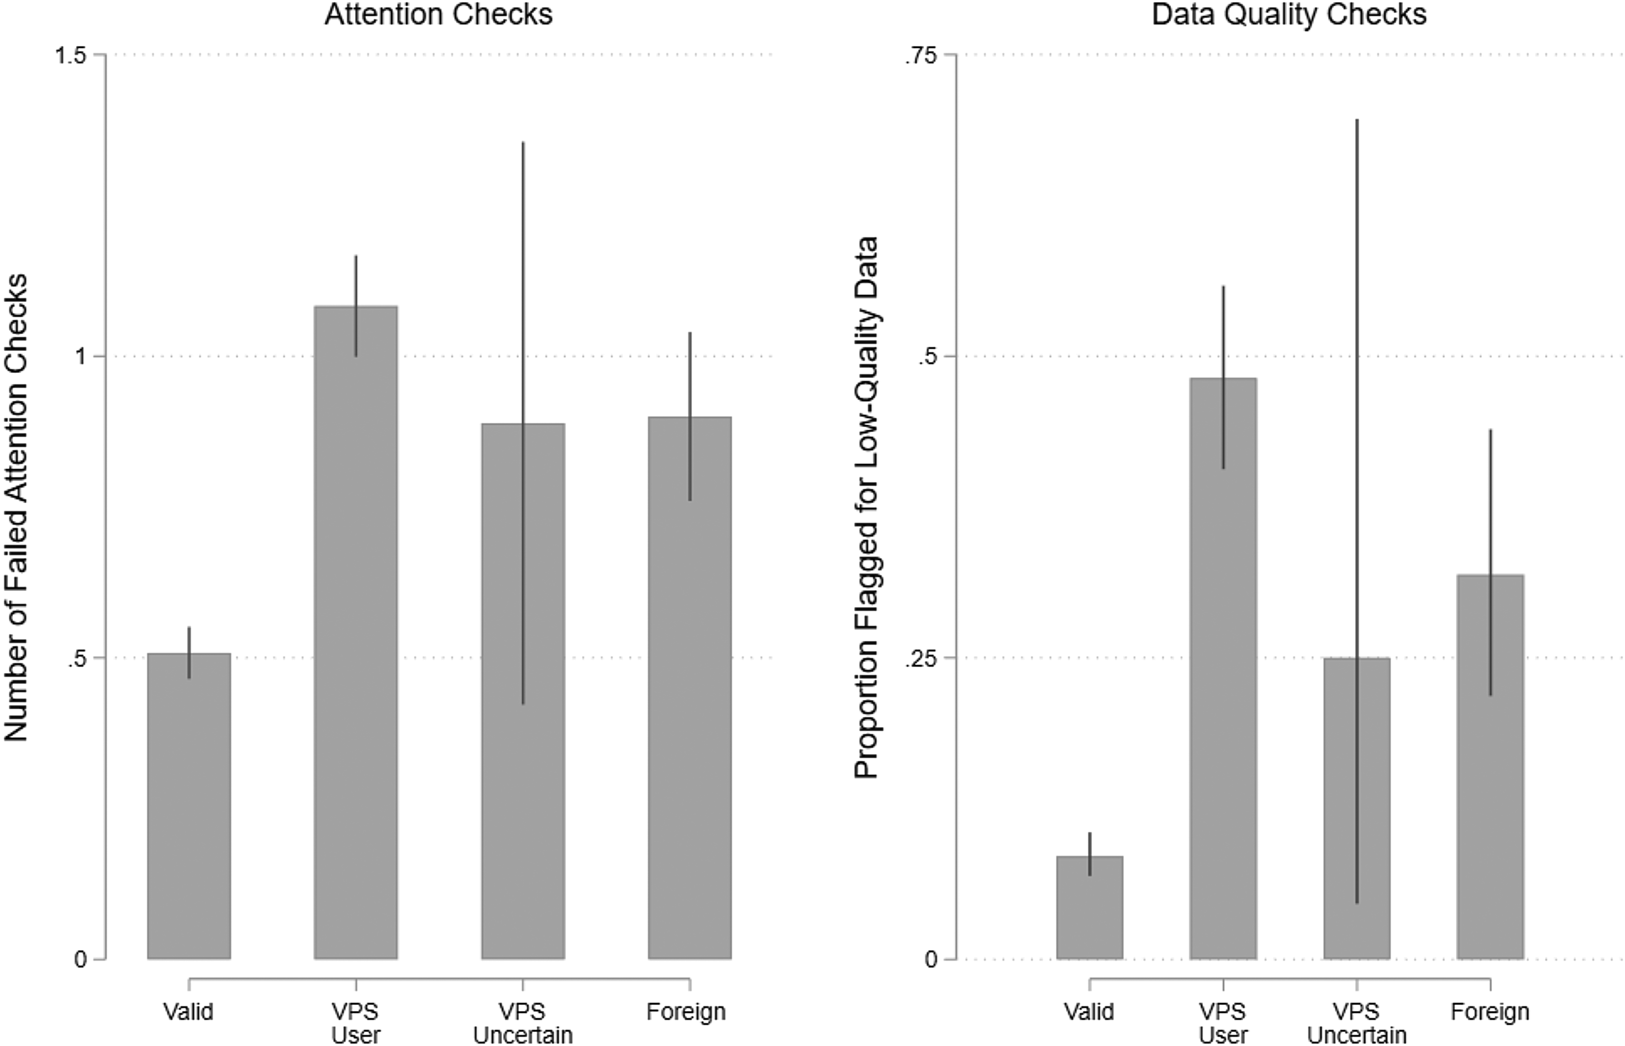
Figure 4. Prevalence of low-quality data by respondent IP type in study 2.
Turning to the five quality checks used in the previous study, 15.6 percent (n = 185) were flagged on at least one item, but this varies by the IP type. Among valid respondents, only 8.6 percent [6.9–10.5 percent] were flagged for low-quality data. This rate is much higher for VPS users (48.2 percent [40.6–55.9 percent]), users with foreign IPs (31.9 percent [21.8–44.0 percent]) and users of uncertain VPS status (25.0 percent [4.1–72.4 percent]).Footnote 15 While VPS users and foreign respondents both provided lower-quality data compared to valid respondents, VPS users actually provided lower-quality data than foreign respondents. Once again, our IP-based measure is effective at picking out low-quality respondents. Interestingly, we still find significant differences across these categories when restricting the sample to those who passed both attention checks, suggesting that common attention checks alone are insufficient.
We also examined cultural knowledge in this study by testing the relationship between partisan identification and political ideology. Again, the two variables are strongly correlated among valid respondents (r = 0.84). However, this relationship plummets among VPS users (r = 0.30) and foreign respondents (r = 0.45), though it remains high among the small number respondents with uncertain VPS status (r = 0.95). Once again, a regression model shows that ideology is more strongly associated with partisanship among valid respondents than among VPS users (p < 0.001) and foreign respondents (p < 0.001; see Appendix for model details).
3.3 Review of retrospective studies
Our two retrospective studies support some of the concerns about fraudulent respondents on MTurk, while ameliorating other concerns. We do find clear evidence that a large number of respondents are using VPSs and that a smaller number are accessing the study from outside the USA without using a VPS. However, contrary to some concerns, we found little evidence that bots make up a significant proportion of these fraudulent respondents. Consistent with the concerns of many, we found that these fraudulent respondents provide much lower-quality data than respondents located in the USA who are not using a VPS. These findings were consistent across a wide variety of measures, including standard attention checks, data consistency checks, open-ended responses, and measures of cultural knowledge. Notably, data quality among VPS users was consistently indistinguishable from or worse than data quality among foreign respondents, contrary to concerns that many VPS users may be valid US respondents. Perhaps most importantly, fraudulent respondents were less responsive to experimental manipulations, diluting estimated treatment effects. Crucially, however, even a rate of fraud of 17 percent did not change the substantive conclusions of our experiment.
4. Detecting and preventing fraudulent responses
In spite of using best practices for data collection on MTurk (e.g., HIT approval >95 percent, HITS approved >100; Peer et al., Reference Peer, Vosgerau and Acquisti2014), our studies described above uncovered substantial rates of low-quality respondents. Fortunately, our IP-based measure was highly effective at identifying these low-quality respondents, suggesting that our measure should be incorporated into best practices. In this section, we first compare our choice of IP Hub to alternative approaches, then introduce a set of tools that allow researchers to easily analyze existing datasets for fraudulent respondents and to prevent fraudulent respondents from gaining access to their surveys in the first place.
Rather than directly rely on IP addresses, some researchers have instead used latitude and longitude coordinates provided by survey software to identify fraudulent respondents (Bai, Reference Bai2018; Dennis et al., Reference Dennis, Goodson and Pearson2018; Ryan, Reference Ryan2018). Under this approach, responses coming from identical geographical coordinates are assumed to be stemming from a server farm used for VPS services. Supporting this method, respondents from duplicated coordinates tend to provide lower-quality data. However, the mapping of an IP address to its physical coordinates is not very precise and sometimes maps IP addresses from different locations to identical coordinates (TurkPrime, n.d.), and respondents using less common VPS services may not be flagged for duplicate locations.Footnote 16 Moreover, coordinates can only be analyzed post hoc, meaning they cannot be used to proactively block problematic respondents. Thus, while geographical duplicates are a reasonable proxy for fraudulent respondents, we recommend relying directly on IP addresses.
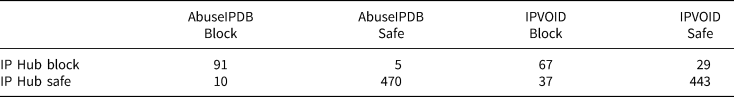
Our analyses above relied on a commercial product called IP Hub, though other alternatives are available. We find several advantages to using IP Hub. First, it is specifically targeted toward identifying likely VPS use. Other services use a much broader definition of suspicious IPs when creating their blacklist. For example, IPVOID (http://www.ipvoid.com/), used by Know Your IP and in a working paper by Ahler et al. (Reference Ahler, Roush and Sood2018), collects its blacklist from a range of other providers and is directed toward detecting IPs potentially associated with spam, virus spread, and other behaviors. Running IPVOID on the data for the second retrospective study showed that it blocked IPs from some residential providers (e.g., Comcast, AT&T, and T-Mobile) and failed to block IPs from some VPS providers (e.g., DigitalOcean).Footnote 17 Second, IP Hub's free license is relatively liberal as it allows 1000 calls per day (30,000 per month). This compares with AbuseIPDB (https://www.abuseipdb.com/), another service used by Know Your IP, which only allows users to make 2500 calls per month. Third, IP Hub returns its data in a relatively clean format that is easily combined with other datasets. Finally, IP Hub provides a straightforward return of the three key pieces of information needed by researchers: country of the IP address, internet service provider (ISP), and a flag for whether that ISP is likely providing VPS services.
To see how IP Hub compares with these other services, we ran the first retrospective study through both IP Hub and the two services linked through Know Your IP (Laohaprapanon and Sood, Reference Laohaprapanon and Soodn.d.). The results are given in Table 1. As is clear, IP Hub produces similar results to AbuseIPDB, which is designed to track similar profiles. They agree on 97.3 percent of the cases. Conversely, IPVOID does not correspond with the results from IP Hub very well, agreeing on only 88.5 percent of cases. But, as noted above, this is likely because IPVOID's blacklist is not directly aimed toward VPS detection. Nevertheless, as we show in online Appendix Figure A1, those labeled as clean in all three datasets have approximately the same performance on our quality checks. When labeled clean by IP Hub, about 2.8 percent of the sample fails our quality checks, compared to 3.6 percent for AbuseIPDB and 4.2 percent for IPVOID. When labeled outside the USA by IP Hub, about 32.0 percent fail the quality checks, compared with 33.3 percent for AbuseIPDB and 16.7 percent for IPVOID. And when labeled as using a VPS by IP Hub, about 23.9 percent fail the quality checks, compared with 17.6 percent for AbuseIPDB and 18.5 percent for IPVOID. Overall, IP Hub appears to be comparable in terms of finding true positives, while being more accurate in locating true negatives, which is useful for practitioners in avoiding dealing with complaints from their workforce. Given the similar performance of these services, we recommend IP Hub for its liberal license and ease of use.
Table 1. Comparison between IP Hub and Know Your IP
To assist researchers in auditing the existing data, we wrote and released packages for two common programs used for statistical analysis in the social sciences: R and Stata.Footnote 18 These packages significantly streamline analyzing IP addresses, from verifying IP address validity for interacting with application programing interface (API) calls. All the researcher has to do is register for an API license from IP Hub (https://iphub.info/api) to use the package. For users unfamiliar with R and Stata, we also provide an online Shiny app that can take a comma separated values (csv) file, run the data through IP Hub, and output a csv file to be merged with the users dataset in any statistical software.Footnote 19 These tools require minimal startup costs for most political and social scientists, as compared with the knowledge of Python programing required to use Know Your IP (Ahler et al., Reference Ahler, Roush and Sood2018).
While these processes offer a method for checking IP addresses after the data have been collected, it is far more efficient for both the researcher and workers if fraudulent respondents can be screened out at the beginning of the survey. We developed a method for such screening that can be easily incorporated into Qualtrics surveys. In brief, researchers need to create a free account with IP Hub (for surveys of less than 1000 per day, or a paid account if more are expected) and embed code at the beginning of their survey. The code will check each respondent's IP address against the IP Hub database and classify each respondent based on VPS use and location. The survey will then direct respondents who are using a VPS or taking the survey from abroad to an end of survey message that informs them they are ineligible for the study (see path diagram in Figure 5). Respondents whose IP status cannot be immediately identified will be provisionally allowed to take the survey, but should be checked by researchers. Just as importantly, we recommend in the protocol for researchers to warn participants that responses from outside the USA are not permitted and to turn off their VPS prior to taking the survey. This warning allows respondents who may be inside the USA and using a VPS for privacy reasons to turn off their VPS and continue with the survey, decreasing the number of false positives and deterring those using a VPS to commit fraud.Footnote 20 Step-by-step instructions can be found on SSRN (Winter et al., Reference Winter, Burleigh, Kennedy and Clifford2019) or in the Appendix to this paper.Footnote 21
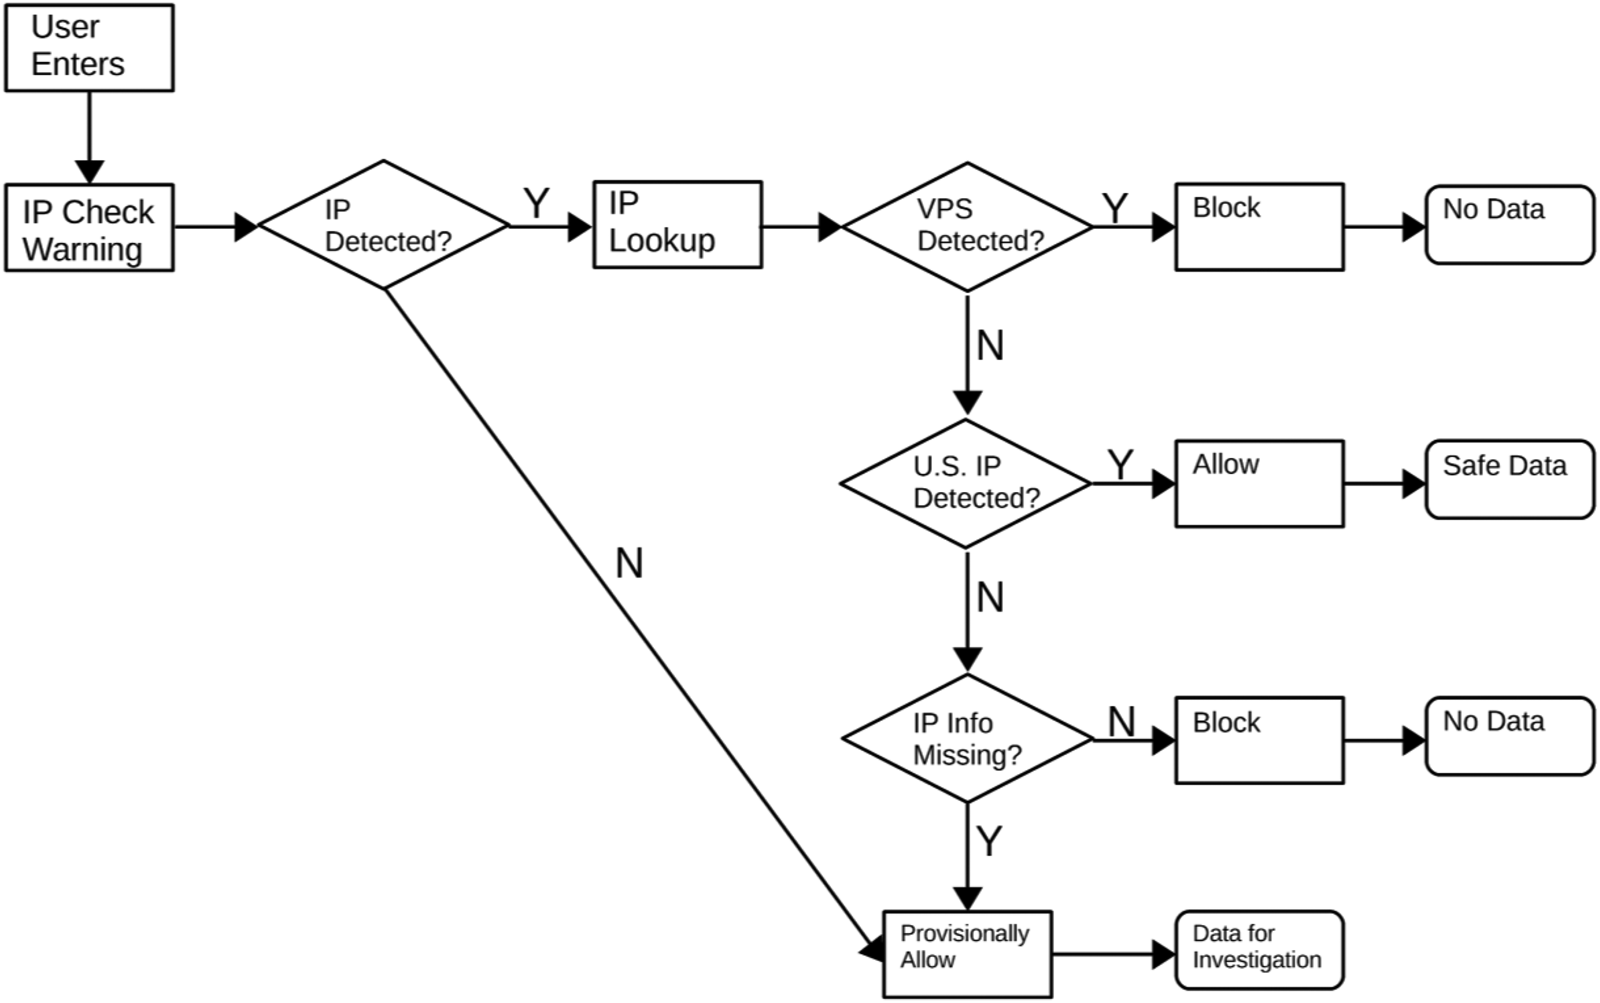
Figure 5. Path diagram of screening protocol.
Following this protocol, we fielded a survey using Qualtrics on 11 October 2018 on MTurk. We followed standard practices (US respondents, 95 percent+ approval rate) and solicited 300 HITs. We had 406 Turkers who tried to take the survey. Of those, 18 were from foreign IPs and 67 were detected as using a VPS, all of whom were successfully blocked. In six cases, we collected an IP address but were unable to collect information from IP Hub, likely because they were using very slow internet connections that did not allow the lookup process to complete. After being warned that their location would be evaluated after the study, these participants completed the survey and submitted the HIT. We checked the IP information for these participants after the data were collected, and, in all of these cases, they were found to be taking the survey from a legitimate residential IP address in small towns in the Midwest.Footnote 22 Because the protocol was being evaluated, we allowed an appeal process (also discussed in the full protocol) wherein they could give us their MTurk worker ID and contact us to appeal the results of the screening. We did not have any workers contact us to appeal the findings of the screening protocol. We did have one worker who complained on the survey of being a US citizen who was trying to take the survey while abroad, a claim we could not verify.
Overall, this result is quite impressive. A certain number of complaints and concerns are to be expected when working on any MTurk survey—especially if it includes attention checks. The marginal additional workload for the researcher from this protocol was minimal, while it successfully blocked access to a substantial number of respondents who would have likely contributed very low-quality data. Pre-screening respondents also have the advantage of not wasting the time of respondents who do not meet the qualifications to participate.
5. Conclusion
While it may be tempting from some of the discussion above to conclude that MTurk is corrupted and needs to be abandoned for other platforms, this would be a mistake. MTurk is both the most popular and most studied platform for this kind of work, and shifting to other platforms would require an increase in costs that many researchers simply cannot afford. Even for scholars who can afford larger surveys, many use MTurk to pilot studies prior to pre-registration and fielding. As reviewed above, MTurk samples have long provided high-quality data that replicate many experimental and observational results, illustrating the value of the platform.
As we have seen, however, there are a few bad actors that are jeopardizing both the quality of data collected through MTurk and the future viability of the platform. Across 38 studies spanning 2013–2018, we find clear evidence that fraudulent respondents have long been on the platform, but these numbers spiked in the summer of 2018, with many of these fraudulent responses coming from India and Venezuela.
Of course, just because a respondent is using a VPS or is located outside of the USA does not guarantee intentional fraud. However, across a number of tests of data quality, including common attention checks, open-ended comments, consistency checks, experimental treatment effects, and cultural knowledge, we find that these respondents tend to contribute much lower-quality data and serve to diminish experimental treatment effects. Moreover, of the 85 respondents who were blocked by our screening protocol, only one contested their exclusion, suggesting that few respondents are inappropriately being flagged as fraudulent.
We provide two means to deal with this threat to data quality on MTurk. First, for studies that have already been conducted, we recommend that researchers use our R or Stata package, or its associated online Shiny app, to identify and remove fraudulent respondents from their datasets. Because this method relies on IP addresses to identify fraud, rather than attention checks, it avoids the possibility of post-treatment bias (Montgomery et al., Reference Montgomery, Nyhan and Torres2016). Second, we recommend that researchers who are preparing to field a study embed our code in their survey to actively check IP addresses and screen out fraudulent respondents before they have a chance to complete the study, while giving credible users, who may use a VPS for regular internet browsing, a chance to turn it off and participate. Fielding a study using this protocol, we showed that this protocol is highly effective at screening out fraudulent respondents.Footnote 23
Our new protocol provides a clear path forward for conducting research on MTurk, but it is less clear how to interpret studies that have already been published. Although we found evidence of fraudulent respondents as far back as 2013, rates of fraud were generally much lower prior to 2018. Moreover, a variety of replication studies conducted between 2012 and 2015 provide clear evidence of high data quality during this time frame (Mullinix et al., Reference Mullinix, Leeper, Druckman and Freese2015; Coppock, Reference Coppock2018). Thus, it seems unlikely that fraudulent responses compromised the findings of studies prior to 2018, but it is less clear what to make of data collected more recently. Our own studies show high rates of fraudulent respondents, and these respondents contributed particularly low-quality data. However, our analyses suggest that we would reach nearly the same substantive conclusions, both in terms of statistical significance and effect magnitude, from these studies regardless of whether or not the fraudulent respondents were included. Of course, we have little basis for extrapolating from our experiment here to the wide variety of studies that are fielded on MTurk. Certain types of studies might be more vulnerable to the influence of fraudulent respondents, such as correlational studies assessing low or high base-rate phenomena (Credé, Reference Credé2010) or other types of observational studies or studies using observed moderators.Footnote 24 Bias may be particularly likely in studies of rare populations, attitudes, or behaviors, as fraudulent respondents may make up a disproportionate share of these rare categories (Chandler and Paolacci, Reference Chandler and Paolacci2017; Lopez and Hillygus, Reference Lopez and Hillygus2018). For this reason, we encourage researchers to use the R and/or Stata packages to reanalyze data they have collected on MTurk.
More generally, while this study has focused on MTurk, as the most popular crowdsourcing site for social science studies, and US respondents, as the most common target population for the service, the problems identified here are unlikely to be limited to this platform or location. The fraudulent Turkers showed a surprising level of ingenuity to get around MTurk's standard location checks. If scholars simply moved en masse to a different platform, such issues are likely to simply move with them (if they have not already). Similarly, the reason this was primarily observed in surveys meant for US respondents was likely because this was the most common qualification required for surveys. There is little reason to believe that similar patterns would not emerge with respondents from other countries, given the proper economic incentives. This opens up a new field for scholars using crowdsourcing for their studies that combines the survey skills for the study itself with the cybersecurity understanding that is needed for online systems management. As we have seen throughout the internet, there will always be those willing to cheat the system, but even a small amount of vigilance can minimize the damage of these bad actors.
Supplementary material
The supplementary material for this article can be found at https://doi.org/10.1017/psrm.2020.6.
Financial support
This research is based upon work supported in part by the Office of the Director of National Intelligence (ODNI), Intelligence Advanced Research Projects Activity (IARPA), via 2017-17061500006. The views and conclusions contained herein are those of the authors and should not be interpreted as necessarily representing the official policies, either expressed or implied, of ODNI, IARPA, or the US Government. The US Government is authorized to reproduce and distribute reprints for governmental purposes notwithstanding any copyright annotation therein. IRB approval from the University of Houston under MOD00001384 of STUDY00000547 and MOD00001334 of STUDY00000905.


 Open access