
Abstract
Extreme climatic events are growing more severe and frequent, calling into question how prepared our infrastructure is to deal with these changes. Current infrastructure design is primarily based on precipitation Intensity-Duration-Frequency (IDF) curves with the so-called stationary assumption, meaning extremes will not vary significantly over time. However, climate change is expected to alter climatic extremes, a concept termed nonstationarity. Here we show that given nonstationarity, current IDF curves can substantially underestimate precipitation extremes and thus, they may not be suitable for infrastructure design in a changing climate. We show that a stationary climate assumption may lead to underestimation of extreme precipitation by as much as 60%, which increases the flood risk and failure risk in infrastructure systems. We then present a generalized framework for estimating nonstationary IDF curves and their uncertainties using Bayesian inference. The methodology can potentially be integrated in future design concepts.
Introduction
Human activities in the past century have caused an increase in global temperature1,2,3. The rising temperatures boost the atmosphere's water holding capacity by about 7% per 1°C warming, thus directly affecting precipitation4. Higher atmospheric water vapor can lead to more intense precipitation events5,6. Furthermore, rising temperatures and subsequent increases in atmospheric moisture content may increase the probable maximum precipitation (PMP) or the expected extreme precipitation5. Consequentially, global warming increases the risk of climatic extremes1,7,8 including floods and damage to infrastructure such as dams, roads and sewer and storm water drainage systems9,10. Indeed, ground-based observations in the U.S. show a substantial increase in extreme rainfall events during the past century1,7,11,12,13,14,15. Global-scale studies also show increased precipitation in northern Australia, central Africa, Central America and parts of southwest Asia16.
Current infrastructure design concepts to deal with flooding and precipitation are based on local rainfall Intensity-Duration-Frequency (IDF) curves. These curves are widely used in municipal storm water management and other engineering design applications across the world17,18,19,20,21,22,23,24,25. The IDF curves are based on historical rainfall time series data and designed to capture the intensity and frequency of precipitation for different durations. Rainfall intensities corresponding to particular durations (e.g., 1-hr, 2-hr, 6-hr, 24-hr) are obtained by fitting a theoretical probability distribution to annual extreme rainfall. Current IDF curves are based on the concept of temporal stationarity, which assumes that the occurrence probability of extreme precipitation events is not expected to change significantly over time17,26. However, climate change is expected to alter the intensity, duration or frequency of climatic extremes over time. This change is termed nonstationarity in the literature26,27,28,29.
Given the observed increase in heavy precipitation events, we argue that the IDF curves should be updated to account for a changing climate, especially for urban infrastructure design17. There are many studies on changes in precipitation intensity or frequency and also multivariate frequency analysis18,30,31,32,33,34,35,36,37,38. However, methods for assessing changes in precipitation intensity, duration and frequency and their uncertainty in a nonstationary climate are limited. Climate-related nonstationarity in a time series of precipitation extremes can be associated with climate variability as well as climate change39. There are different parametric and non-parametric methods to address nonstationarity in time series40,41,42,43,44,45,46,47,48. In this paper, we assess the effect of nonstationarity on IDF curves and the occurrence of extremes. We also outline a generalized framework for constructing IDF curves under nonstationary conditions. The fundamental concept is based on the Generalized Extreme Value distribution (GEV) combined with Bayesian inference for uncertainty assessment (see Methods Section).
Our analyses are based on ground-based observations of precipitation extremes (here, annual maxima) from the United States National Oceanic and Atmospheric Administration Atlas 14, the basis for IDF curves in the United States49. Following the NOAA Atlas 14 approach, the annual maxima series is constructed by extracting the highest precipitation amount for different precipitation durations (e.g., 1-hr, 6-hr) in each successive water year (i.e., 12-month period beginning October 1 and continuing through September 30). While previous studies show that precipitation extremes in several regions have increased, still most ground-based stations do not exhibit a strong trend and only limited stations show a statistically significant nonstationary behavior50. To examine the effect of ignoring nonstationarity, historical rainfall data (1949–2000), used in the updated NOAA Atlas 14, from five stations that exhibit significant increasing trends are used to assess IDF curves under nonstationarity (Table 1). In the selected stations and based on the Mann-Kendall trend test, precipitation extremes exhibit nonstationary behavior for different durations (here, 1-hr to 96-hr) at 95% confidence level (Figure S1 in Supplementary Material). The presence of a statistically significant increasing trend in precipitation extremes violates the basic assumption of stationary IDF curves.
A unique feature of this modeling framework is that it offers uncertainty bounds of IDF estimates based on a Bayesian approach (see Equations 3 and 4 in Methods Section). To illustrate, the stationary and nonstationary IDF curves for different return periods (2-, 10-, 25-, 50- and 100-year) and durations for the White Sands National Monument Station in New Mexico are presented in Figure 1. As discussed in Method Section, along with model parameters, the uncertainty bounds of IDF curves can be obtained simultaneously in the proposed framework. The gray lines show the uncertainty bounds of the nonstationary IDF estimates based on the Differential Evolutionary Monte Carlo algorithm built into a Bayesian framework51 for extreme value analysis (Methods Section). This Bayesian framework has several advantages over the commonly used frequentist inference52. For example, a Bayesian framework allows using priors (or results from a previous/similar model) to inform model parameter inference (e.g., priors derived from a nearby or similar station with longer records to improve inferences at a location with a shorter record). Furthermore, Bayesian inference offers uncertainty of the parameter estimates, yielding more realistic estimations53. For more information on both Bayesian and frequentist options the interested reader is referred to Bernardo and Smith52 and Press54.
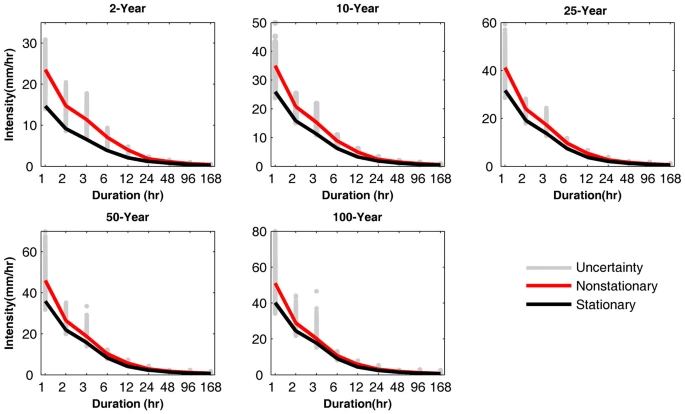
Nonstationary vs. stationary IDF Curves for different return periods and durations at the selected station in White Sands National Monument Station, New Mexico.
The stationary assumption consistently underestimates the IDF curves over different durations. The gray area shows the uncertainty bound of nonstationary IDF estimates (figure generated using Matlab®).
We found that the stationary assumption delivers IDF curves that can substantially underestimate extreme events. If such a stationary IDF curve is used for an infrastructure design, the project may not be able to withstand more extreme events, which are shown by nonstationary estimates for the same return period. For example, for a 2-year 2-hr storm (i.e., an event with a return period of 2 years and duration of 2 hours), the difference between the nonstationarity (14.7 mm/hr) and stationarity (9.1 mm/hr) extreme precipitation is about 5.6 mm/hr (+61.5%); while for a 10-year 1-hr event, the difference between nonstationarity (35.0 mm/hr) and stationarity (25.9 mm/hr) extreme precipitation is over 9.1 mm/hr (+35.1%). Even for a small watershed, this extra 9.1 mm/hr (+35.1%) precipitation would lead to a significant increase in flood peak. In other words, a stationary assumption will underestimate the peak flood and as a result the actual flood risk will be higher than what the system or infrastructure is designed for.
The differences between the nonstationary and stationary estimates decrease for longer durations (e.g., 168-hr precipitation). This implies that in this station, shorter precipitation events have been intensified more in the past decades, while longer events have not changed substantially. For the same station shown in Figure 1, the boxplots of differences between the nonstationary and stationary precipitation extremes are presented in Figure 2. The figure shows that for all durations and return periods, the quantile boxes are above zero, indicating underestimation of extremes in a stationary assumption. In all durations, the uncertainty increases as the return period increases. Consequently, the uncertainties in the stationary and nonstationary precipitation differences increase at higher return periods.

Differences between the nonstationary and stationary precipitation extremes for different return periods and durations in White Sands National Monument Station, New Mexico.
The boxplots show the median (center mark) and the 25th (lower edge) and 75th (upper edge) percentiles (figure generated using Matlab®).
By examining storm durations, we found that the shorter the duration the larger the differences between the nonstationary and stationary extremes. As an example, for the 100-year return period, the differences between nonstationary and stationary IDF curves of 1-hr and 2-hr events reduce from 4.7–15.6 mm/hr to 1.4–7.3 mm/hr, while for a 168-hr storm, the difference approaches zero (see Figure 2). Similar behavior is observed in the other stations and as a result we have focused on shorter durations. For the other stations in Nevada (NV), California (CA) and North Carolina (NC), Figure 3 summarizes the differences between the stationary and nonstationary precipitation extremes for different return periods and durations (top two rows: 1-hr duration; bottom two rows: 2-hr duration). The boxplots show the median (center mark) and the 25th (lower edge) and 75th (upper edge) percentiles of the differences between stationary and nonstationary estimates. Similar behavior emerges in different stations, indicating that nonstationary estimates are larger than their corresponding stationary values. Such difference in underestimation raises the risk of extreme floods and damage to infrastructure if nonstationarity is ignored55.

Difference between the nonstationary and stationary precipitation extremes estimates for different return periods and durations (top two rows: 1-hr duration; bottom two rows: 2-hr duration) in mm/hr and percent (%).
The boxplots show the median (center mark) and the 25th (lower edge) and 75th (upper edge) percentiles (figure generated using Matlab®).
Infrastructure health and safety during precipitation extremes is closely related to human health and security, particularly downstream of major structures (e.g., dams, spillways, reservoirs). For this reason, methods that can account for changing precipitation extremes are essential for updating engineering standards and design codes. Potential non-uniform and climate-induced changes on heavy rainfall events calls into question the accuracy and adequacy of current infrastructure design concepts, which rely on an assumption of climate stationarity. Previous studies show that limited locations across the United States exhibit a strong nonstationary increase in precipitation extremes. The reported underestimation of extremes corresponds to the few stations investigated in this paper that exhibit a strong nonstationary increase in precipitation extremes. While still limited locations exhibit a statistically significant increasing trend in precipitation extremes, future projections indicate that extremes may become more frequent. We show that ignoring the nonstationary assumption could lead to substantial underestimation of extremes, especially at sub-daily durations (e.g., 1-hr, 2-hr).
We outline a novel framework to create the next generation of IDF curves to be incorporated into infrastructure design. This paper does not argue that the proposed methodology should be used for all stations. In fact, the suggested nonstationary IDF curve estimation method would only be necessary when observations or model projections indicate a nonstationary future climate. If there is no indication of change in historical records or model simulations, current stationary IDF curve models may be sufficient for infrastructure design. The presented methodology can be used to improve our understanding of the climate-induced changes in the intensity, duration and frequency of heavy precipitation and can potentially be integrated in design concepts. However, infrastructure design and construction require substantial investment over a long period of time and effective integration of this methodology as well as development of adaptive design frameworks will require collaborative and interdisciplinary research with engineers, policy makers, economists, climate scientists and decision makers.
Finally, given that IDF curves have been widely used for design and practical applications, this study focuses on a nonstationary framework that still relies on the IDF concept. Alternative methods such as the stochastic storm transposition method offer a different way forward for flood risk assessment56,57. However, incorporating nonstationarity in these methods deserves a great deal of research. We predict that in future more research will be dedicated to develop more physically-based nonstationary frameworks for flood risk assessment.
Methods
The GEV distribution is a combination of Gumbel, Fréchet and Weibull distributions and is based on the limit theorems for block maxima or annual maxima58. The standard cumulative distribution of the GEV can be expressed as59:

where ψ(x) is defined for  ; elsewhere, ψ(x) is either 0 or 160. The GEV distribution has the location parameter (μ), the scale parameter (σ) and the shape parameter (ξ) to specify the center of the distribution, the deviation around μ and the tail behavior of the GEV distribution, respectively. For ξ→0, ξ < 0 and ξ > 0, the GEV leads to the Gumbel, Weilbull and Fréchet distributions, respectively.
The extreme value theory of stationary random sequences assumes that statistical properties of extremes (here, distribution parameters θ = (μ, σ, ξ) are independent of time51. In a nonstationary process, however, the parameters of the underlying distribution function are time-dependent and the properties of the distribution would therefore vary with time61. As in previous studies, the location parameter (μ) is assumed to be a function of time (Equation 2), while keeping the scale and shape parameters constant51,58,62,63:

where t is time and β = (μ1, μ0) are the regression parameters.
The non-parametric rank based Mann-Kendal (MK) test is used to detect trends in annual maximum rainfall intensity of the selected storm durations (i.e., 1, 2, 3, 6, 12, 24, 48 and 168 hours). The null hypothesis of no trend is rejected if the test statistic is significantly different from zero at a 0.05 significance level. Upon detection of a significant trend, the location parameter will be computed under the nonstationary assumption (Equation 2). This will allow estimating rainfall quantities in a more realistic way consistent with the behavior of observed precipitation extremes. It is worth pointing out that the purpose including the MK test is solely to avoid implementing a time varying extreme value analysis on a data that does not show a significant change in extremes over time. Technically, the same methodology can be applied to all data sets regardless of their trend, avoiding a subjective significance measure. In fact, recent studies highlight the need to go beyond subjective criteria for significance analysis, especially in a nonstationary world64.
Providing uncertainty estimates for IDF curves is fundamental to risk assessment and decision making. In this study, a Bayesian-based Markov chain approach is integrated into the nonstationary GEV for uncertainty assessment65. This approach combines the knowledge brought by a prior distribution and the observation vector  of N annual maxima (Equations 3 and 4) into the posterior distribution of parameters θ = (μ, σ, ξ). Assuming independence between observations, the Bayes theorem for estimation of GEV parameters under the nonstationary assumption can be expressed as51,63:


where y(t) denotes the set of all covariate values under the nonstationary assumption and stationarity can be treated as a special case without the term y(t). The resulting posterior distributions  provide information on the distribution parameters (μ1, μ0, σ, ξ).
To estimate the parameters inferred by Bayes, the Differential Evolution Markov Chain (DE-MC) is integrated to generate a large number of realizations from the parameters' posterior distributions66,67. The DE-MC attributes to the genetic algorithm Differential Evolution (DE)66,67 for global optimization over real parameter space with the Markov Chain Monte Carlo (MCMC) approach. In this model, the target posterior distributions are sampled through five Markov Chains constructed in parallel. These chains are allowed to learn from each other by generating candidate draws based on two random parent Markov Chains (rather than to run independently66); therefore, it has advantages of simplicity, speed of calculation and convergence over the conventional MCMC66. By combining DE-MC with Bayesian inference, the confidence interval and uncertainty bounds of estimated return levels based on the sampled parameters can be obtained simultaneously for IDF curves. The probabilistic nature of the methodology allows investigating the posterior histograms of the model parameters and sample regression parameters. For example, the sampled regression parameters of μ0 and μ1 for White Sands National Monument Station in New Mexico are presented in Supplementary Material Figures S2 and S3, respectively.
For a time series of annual maxima, the time-variant parameter (μ(t)) is derived by computing the 95th percentile of DE-MC sampled μ(t), termed as  (i.e., 95th percentile of μ(t = 1),…, μ(t = 100)). The model parameters will then be used to estimate the nonstationary precipitation intensity (or equivalently, return level) analogous to the standard ones as follows:

Where p (the non-exceedance probability of occurrence) is frequency, i.e., how often a storm of specified intensity and duration is expected to occur. The n-year precipitation intensity refers to the annual maximum rainfall of specified depth/intensity and duration having a probability of exceedance of 1/n. In this approach, precipitation intensity is expressed as a function of the return period T,  , i.e., the average length of time between events of a given depth/intensity and duration.
References
Karl, T. R., Melillo, J. M. & Peterson, T. C. Global climate change impacts in the United States. (Cambridge University Press, New York, 2009).
Min, S. K., Zhang, X., Zwiers, F. W. & Hegerl, G. C. Human contribution to more-intense precipitation extremes. Nature 470, 378–381 (2011).
Stocker, T. F. et al. Climate Change 2013. The Physical Science Basis. Working Group I Contribution to the Fifth Assessment Report of the Intergovernmental Panel on Climate Change-Abstract for decision-makers. Groupe d'experts intergouvernemental sur l'evolution du climat/Intergovernmental Panel on Climate Change-IPCC, C/O World Meteorological Organization, Switzerland. (2013).
Trenberth, K. E. Changes in precipitation with climate change. Clim Res 47, 123 (2011).
Kunkel, Kenneth, E. et al. Probable maximum precipitation and climate change. Geophys Res Lett 40, 1402–1408 (2013).
Berg, P., Moseley, C. & Haerter, J. O. Strong increase in convective precipitation in response to higher temperatures. Nat Geosci 6, 181–185 (2013).
Hao, Z., AghaKouchak, A. & Phillips, T. J. Changes in concurrent monthly precipitation and temperature extremes. Environ Res Lett 8, 034014 (2013).
Emori, S. & Brown, S. J. Dynamic and thermodynamic changes in mean and extreme precipitation under changed climate. Geophys Res Lett 32, L17706 (2005).
Jongman, B. et al. Increasing stress on disaster risk finance due to large floods. Nat Clim Change 4, 264–268 (2014).
Das, T., Dettinger, M. D., Cayan, D. R. & Hidalgo, H. G. Potential increase in floods in California's Sierra Nevada under future climate projections. Clim Change 109, 71–94 (2011).
Karl, T. R. & Knight, R. W. Secular trends of precipitation amount, frequency and intensity in the United States. B Am Meteorol Soc 79, 231–241 (1998).
Groisman, P. Y., Knight, R. W. & Karl, T. R. Changes in intense precipitation over the central United States. J Hydrometeorol 13, 47–66 (2012).
Groisman, P. Y. et al. Trends in intense precipitation in the climate record. J Climate 18, 1326–1350 (2005).
Kunkel, Kenneth, E. et al. Monitoring and understanding trends in extreme storms: State of knowledge. B Am Meteorol Soc 94, 499–514 (2013).
DeGaetano, A. T. Time-dependent changes in extreme-precipitation return-period amounts in the continental United States. J Appl Meteorol 48, 2086–2098 (2009).
Damberg, L. & AghaKouchak, A. Global trends and patterns of drought from space. Theor Appl Climatol 117, 441–448 (2014).
Simonovic, S. P. & Peck, A. Updated rainfall intensity duration frequency curves for the City of London under the changing climate. Department of Civil and Environmental Engineering, The University of Western Ontario (2009).
Endreny, T. A. & Imbeah, N. Generating robust rainfall intensity–duration–frequency estimates with short-record satellite data. J. Hydrol. 371, 182–191 (2009).
Hosking, J. R. M. & Wallis, J. R. Regional frequency analysis: an approach based on L-moments. (Cambridge University Press, 2005).
Madsen, H., Arnbjerg-Nielsen, K. & Mikkelsen, P. S. Update of regional intensity–duration–frequency curves in Denmark: tendency towards increased storm intensities. Atmos Res 92, 343–349 (2009).
Sugahara, S., Da Rocha, R. P. & Silveira, R. Non-stationary frequency analysis of extreme daily rainfall in Sao Paulo, Brazil. Int J Climatol 29, 1339–1349 (2009).
Willems, P. Adjustment of extreme rainfall statistics accounting for multidecadal climate oscillations. J Hydrol 490, 126–133 (2013).
Madsen, H., Mikkelsen, P. S., Rosbjerg, D. & Harremoës, P. Regional estimation of rainfall intensity-duration-frequency curves using generalized least squares regression of partial duration series statistics. Water Resour Res 38, 1–11 (2002).
Haddad, K., Rahman, A. & Green, J. Design rainfall estimation in Australia: a case study using L moments and generalized least squares regression. Stoch Env Res Risk A 25, 815–825 (2011).
Foufoula-Georgiou, E. A probabilistic storm transposition approach for estimating exceedance probabilities of extreme precipitation depths. Water Resour Res 25, 799–815 (1989).
Jacob, D. Nonstationarity in extremes and engineering design. Extremes in a Changing Climate [AghaKouchak et al. (eds.)], 363–417. (Springer, Dordrecht, 2013).
Alexander, L. V. et al. Global observed changes in daily climate extremes of temperature and precipitation. J Geophys Res-Atmos 111, 1–22 (2006).
Field, C. B. (Ed.). Managing the risks of extreme events and disasters to advance climate change adaptation: Special report of the intergovernmental panel on climate change. (Cambridge University Press, New York, 2012).
Gregersen, I. B., Madsen, H., Rosbjerg, D. & Arnbjerg-Nielsen, K. A spatial and nonstationary model for the frequency of extreme rainfall events. Water Resour Res 49, 127–136 (2013).
Cooley, D. Return periods and return levels under climate change. Extremes in a Changing Climate [AghaKouchak et al. (eds.)], 97–114. (Springer, Dordrecht, 2013).
Salas, J. D. & Obeysekera, J. Revisiting the concepts of return period and risk for nonstationary hydrologic extreme events. J Hydrol Eng 19, 554–568 (2013).
Hassanzadeh, E., Nazemi, A. & Elshorbagy, A. Quantile-Based Downscaling of Precipitation Using Genetic Programming: Application to IDF Curves in Saskatoon. J Hydrol Eng 19, 943–955 (2013).
Grimaldi, S. & Serinaldi, F. Asymmetric copula in multivariate flood frequency analysis. Adv Water Resour 29, 1155–1167 (2006).
Gräler, B. et al. Multivariate return periods in hydrology: a critical and practical review focusing on synthetic design hydrograph estimation. Hydrol Earth Syst Sc 17, 1281–1296 (2013).
De Michele, C. & Salvadori, G. A Generalized Pareto intensity-duration model of storm rainfall exploiting 2-Copulas. J Geophys Res-Atmos 108, 1–11 (2003).
Salvadori, G. & De Michele, C. Multivariate multiparameter extreme value models and return periods: A copula approach. Water Resour Res 46, 1–11 (2010).
Lenderink, G. & Van Meijgaard, E. Increase in hourly precipitation extremes beyond expectations from temperature changes. Nat Geosci 1, 511–514 (2008).
Aryal, S. K. et al. Characterizing and modeling temporal and spatial trends in rainfall extremes. J Hydrometeorol 10, 241–253 (2009).
Zhang, X., Wang, J., Zwiers, F. W. & Groisman, P. Y. The influence of large-scale climate variability on winter maximum daily precipitation over North America. J Climate 23, 2902–2915 (2010).
Yilmaz, A. G. & Perera, B. J. C. Extreme Rainfall Nonstationarity Investigation and Intensity–Frequency–Duration Relationship. J Hydrol Eng 19, 1160–1172 (2013).
Cunderlik, J. M. & Ouarda, T. B. Regional flood-duration–frequency modeling in the changing environment. J Hydrol 318, 276–291 (2006).
Hanel, M., Buishand, T. A. & Ferro, C. A. A nonstationary index flood model for precipitation extremes in transient regional climate model simulations. J Geophys Res-Atmos 114, 1–16 (2009).
Seidou, O. et al. A parametric Bayesian combination of local and regional information in flood frequency analysis. Water Resour Res 42, 1–21 (2006).
Khaliq, M. N. et al. Frequency analysis of a sequence of dependent and/or non-stationary hydro-meteorological observations: A review. J Hydrol 329, 534–552 (2006).
Strupczewski, W. G., Singh, V. P. & Feluch, W. Non-stationary approach to at-site flood frequency modelling I. Maximum likelihood estimation. J Hydrol 248, 123–142 (2001).
Cunha, L. K., Krajewski, W. F., Mantilla, R. & Cunha, L. A framework for flood risk assessment under nonstationary conditions or in the absence of historical data. J Flood Risk Manag 4, 3–22 (2011).
Zhu, J., Stone, M. C. & Forsee, W. Analysis of potential impacts of climate change on intensity-duration-frequency (IDF) relationships for six regions in the United States. J Water Clim Change 3, 185–196 (2012).
Hailegeorgis, T., Burn, D. & Eng, P. (2009). Uncertainity Assessment of the Impacts of Climate Change on Extreme Precipitation Events. Canadian Foundation for Climate and Atmospheric Sciences Project, WMO.
Bonnin, et al. Precipitation-frequency atlas of the United States. NOAA Atlas 14, 1–65 (2006).
Westra, S., Alexander, L. V. & Zwiers, F. W. Global increasing trends in annual maximum daily precipitation. J Climate 26, 3904–3918 (2013).
Renard, B., Sun, X. & Lang, M. Bayesian methods for non-stationary extreme value analysis. In: Extremes in a Changing Climate [AghaKouchak et al. (eds.)], 39–95. (Springer, Dordrecht, 2013).
Bernardo, J. & Smith, A. Bayesian Theory (John Wiley & Sons, West Sussex 2000).
Robert, C. The Bayesian Choice (Springer, Paris, 2007).
Press, S. J. Applied multivariate analysis: using Bayesian and frequentist methods of inference (Courier Dover Publications 2012).
Milly, P. C. D. et al. Stationarity Is Dead: Whither Water Management? Science 319, 573–574 (2008).
Wright, D. B., Smith, J. A. & Baeck, M. L. Flood frequency analysis using radar rainfall fields and stochastic storm transposition. Water Resour Res 50, 1592–1615 (2014).
Wright, D. B., Smith, J. A., Villarini, G. & Baeck, M. L. Estimating the frequency of extreme rainfall using weather radar and stochastic storm transposition. J Hydrol 488, 150–165 (2013).
Katz, R. Statistics of extremes in climate change. Clim Change 100, 71–76 (2010).
Coles, S., Bawa, J., Trenner, L. & Dorazio, P. An introduction to statistical modeling of extreme values (Springer, London, 2001).
Smith, R. L. Extreme value statistics in meteorology and the environment. Environ Stat 8, 300–357 (2001).
Meehl, G. A. et al. An Introduction to Trends in Extreme Weather and Climate Events: Observations, Socioeconomic Impacts, Terrestrial Ecological Impacts and Model Projections. B Am Meteorol Soc 81, 413–416 (2000).
Gilleland, E. & Katz, R. W. New software to analyze how extremes change over time. EOS Trans Am Geophys Union 92, 13–14 (2011).
Cheng, L., AghaKouchak, A., Gilleland, E. & Katz, R. W. Non-stationary extreme value analysis in a changing climate. Clim. Change 1–17, 10.1007/s10584-014-1254-51-17 (2014).
Rosner, A., Vogel, R. M. & Kirshen, P. H. A risk-based approach to flood management decisions in a nonstationary world. Water Resour Res 50 (2014).
Stephenson, A. & Tawn, J. Bayesian inference for extremes: accounting for the three extremal types. Extremes 7, 291–307 (2004).
Ter Braak, C. J. A Markov Chain Monte Carlo version of the genetic algorithm Differential Evolution: easy Bayesian computing for real parameter spaces. Stat Comput 16, 239–249 (2006).
Vrugt, J. A. et al. Accelerating Markov chain Monte Carlo simulation by differential evolution with self-adaptive randomized subspace sampling. Int J Nonlin Sci Num 10, 273–290 (2009).
Acknowledgements
This study is supported by the Environmental Sciences Division of the Army Research Office (Award No. W911NF-14-1-0684) and the National Science Foundation (Award No. DMS 1331611).
Author information
Authors and Affiliations
Contributions
L.C. and A.A. conceived the study. L.C. analyzed the data and performed the experiment. A.A. and L.C. wrote the paper. All authors reviewed the manuscript.
Ethics declarations
Competing interests
The authors declare no competing financial interests.
Electronic supplementary material
Supplementary Information
Supplementary Material
Rights and permissions
This work is licensed under a Creative Commons Attribution 4.0 International License. The images or other third party material in this article are included in the article's Creative Commons license, unless indicated otherwise in the credit line; if the material is not included under the Creative Commons license, users will need to obtain permission from the license holder in order to reproduce the material. To view a copy of this license, visit http://creativecommons.org/licenses/by/4.0/
About this article

Cite this article
Cheng, L., AghaKouchak, A. Nonstationary Precipitation Intensity-Duration-Frequency Curves for Infrastructure Design in a Changing Climate. Sci Rep 4, 7093 (2014). https://doi.org/10.1038/srep07093
Received:
Accepted:
Published:
DOI: https://doi.org/10.1038/srep07093
This article is cited by
-
The rain, it is a changing: non-stationarity of precipitation and the effect on water infrastructure design
Sustainable Water Resources Management (2024)
-
A warming-induced reduction in snow fraction amplifies rainfall extremes
Nature (2023)
-
Trend analysis of maximum rainfall series of standard durations in Turkey with innovative methods
Natural Hazards (2023)
-
Examining the stage-IV radar-rainfall product for Probabilistic rainfall estimation: case study over Iowa
Stochastic Environmental Research and Risk Assessment (2023)
-
Frequency analysis based on Peaks-Over-Threshold approach for GPM IMERG precipitation product
Theoretical and Applied Climatology (2023)
Comments
By submitting a comment you agree to abide by our Terms and Community Guidelines. If you find something abusive or that does not comply with our terms or guidelines please flag it as inappropriate.
