
Abstract
A model for carbon nanotube (CNT)/polymer composite conductivity is developed, considering the effect of inter-tube tunnelling through the polymer. The statistical effects of inter-tube distance and alignment on the tunnelling are investigated through numerical modelling, to highlight their role in the conductance and piezoresistance of the composite film. The impact of critical parameters, including the concentration, alignment and aspect ratio of the CNTs and the tunnelling barrier height of the polymer is statistically evaluated using a large number of randomly generated CNT/polymer composite films. A numerical model is presented for the tunnelling resistance as a function of CNT concentration and polymer properties, which provides good agreement with the reported conductance in the literature. In particular, for a low concentration of CNTs close to the percolation threshold, we demonstrate how tunnelling dominates the conductance properties and leads to significant increase in the piezoresistance of the composite. This is important for gaining insight into the optimum concentration and alignment of the CNTs in the composite film for applications such as strain sensors, anisotropic conductive films, transparent electrodes and flexible electronics.
Export citation and abstract BibTeX RIS
1. Introduction
Due to the remarkable thermal, electrical, mechanical and optical properties of carbon nanotubes (CNT), films made from networks of CNTs and their polymer composites have been widely investigated for different electronic applications including large-area flexible electronics, strain sensors, transparent electrodes, transistors and photovoltaic (PV) devices. Individual CNTs can have exceptional electric-current-carrying capacities approximately 1000 times higher than copper [1]. The high aspect ratio of CNTs leads to one of the smallest percolation thresholds among films made from percolating sticks [2]. If introduced in an insulating polymer matrix even at a very low concentration level, the composite can demonstrate excellent electrical properties [3]. CNTs also possess unique mechanical strength, as reported by Yu et al [4] for the Young's modulus of individual multi-walled nanotubes (MWNTs) (0.27–0.95 TPa). For single-walled nanotubes (SWNTs), this value is found to be higher (0.32–1.47 TPa) [5]. CNTs when embedded in polymers have been reported to enhance the piezoresistive property of the composite and show higher sensitivity than conventional strain sensors [6]. CNT/polymer composite nanofibres can be used as transparent conductive (TC) electrodes as a replacement for the indium tin oxide (ITO) films used for thin film solar cells [7, 8].
Despite all these attractive features of CNT/polymer composites with a broad range of applications in nanoelectronic and optoelectronic devices, there still is a gap in our theoretical understanding of the conduction properties of CNT/polymer composite films. While in a CNT/polymer composite film electrical conduction occurs through a percolating network of nanotubes, several parameters including type, concentration, aspect ratio, orientation and alignment, synthesis method, surface modification of CNTs as well as polymer type and dispersion method influence the percolation threshold, scaling law exponent and maximum conductivity of the composite [9]. Usually higher concentration, larger aspect ratio and random isotropic orientation of the tubes lower the percolation threshold, and therefore enhance the conductivity of a CNT thin film [2, 10, 11]. However, some recent studies have indicated that the electrical conduction of a CNT/polymer composite is primarily governed by the tunnelling of electrons through the gaps between neighbouring CNTs, rather than conduction through the intimate CNT contacts [12, 13]. This has become more significant in many applications such as strain sensors where a lower concentration of CNTs is used.
This paper uses a Monte Carlo based statistical method to investigate the role of inter-tube distance and alignment on the tunnelling resistance and strain sensitivity of CNT/polymer composites, so as to provide a deeper perception of the conduction mechanism through the composite films. Here, we use numerically generated samples with different concentration ϕ, length L, diameter D, and alignment angle θ of the nanotubes and polymer tunnelling barrier height λ to investigate their role on the tunnelling resistance Rt and the sensitivity to mechanical strain, i.e. gauge factor GF. These results are critical for understanding the conduction in nanocomposite films used for strain sensing, solar cell transparent electrodes and flexible electronics.
2. Percolation and tunnelling in a composite
In a CNT–polymer composite, the CNTs act as conductive fillers in the insulating polymer matrix. Generally, in a conductor–insulator composite, if we gradually increase the number of conductive fillers, after reaching a certain filler volume fraction ϕc, the percolation threshold, the electrical conductivity of the composite takes a sharp upturn. At this concentration, the electrical conduction effectively begins through the percolating conductive filler network. Traditionally for a percolating network the conductivity is given by [14]

where r is the critical exponent, ϕ is the volume fraction of the conductive filler, ϕc is the percolation threshold, and σo is the electrical conductivity of the filler. r depends on the dimensionality of the filler network and is ideally independent of the aspect ratio or orientation of the fillers, whereas ϕc is a function of both aspect ratio and orientation order of the fillers [15]. Usually both these parameters are determined experimentally.
The measured sheet resistance of the CNT/polymer film arises from both the intrinsic resistance along the CNTs and the inter-tube junction resistance between CNT pairs along the conduction path. Again, the junction resistance consists of resistance due to direct CNT–CNT contact and resistance due to tunnelling. Here by tunnelling resistance we mean the resistance between those CNT pairs which are not at direct contact, but are separated by a distance smaller than the electron tunnelling gap. Ideally in a percolating network the tube–tube contacts are made by intimate contact, which means that they touch each other. But in practice in the case of most of the junctions of a filler network in a CNT/polymer composite, a thin layer of the insulating polymer (or surfactant) prevents direct contact between the CNTs. Thus the electric conduction at CNT–CNT junctions is dominated by tunnelling [16, 17]. The thin insulating layer of polymer between the CNTs acts as the tunnelling barrier, unless the layer thickness goes higher than 1.8 nm [18]. The electrical conductivity of individual CNTs varies within the range of 104–107 S m−1 [19, 20], whereas most of the measured composite conductivities range from 10−5 to 102 S m−1 at or above the percolation thresholds [16, 21]. This in turn indicates that the tunnelling resistance plays a dominant role in the composite resistance, in particular for films that have a lower concentration of tubes, as is the case for many practical applications. The tunnelling resistance greatly influences the composite conductivity and strain sensitivity [18, 22]. Variation of the CNT concentration and orientation allows for tuning of the electrical and mechanical properties of the nanocomposite film.
3. Numerical method and simulation results
In this work, a thin film of CNT/polymer composite is simulated as a square quasi-two-dimensional thin film, where the CNTs are assumed as MWNTs and stick-like fillers dispersed in the polymer matrix. We considered the CNTs as penetrable soft-core cylinders with length L and diameter D. At low concentration of tubes in the composite, as the concentration of CNTs increases, the inter-tube distance decreases, thereby enhancing the probability of percolation. When the minimum distance between two arbitrary tubes decreases to the maximum allowed tunnelling gap, then electrons can tunnel between these two tubes. Thus, an electrical-percolation network in the composites is formed, although a geometrically connected physical-percolation network is still absent.
A typical two-dimensional sample space with randomly generated CNTs is shown in figure 1(a). The sample area is 10 µm on each side. The CNTs have length L = 1 µm, diameter D = 1 nm, and hence the aspect ratio AR = 1000. The electrical conduction is assumed in the X-axis direction, determined by the locations of the electrodes. The percolating cluster which builds up a conducting bridge from the left electrode to the right one is shown within the dashed line. The resistance of the CNT/polymer composite thin film mainly comprises the inter-tube tunnelling resistance, affected by different factors, including the overlapping area at the CNT–CNT junction, the CNT diameter, the thickness of the polymer layer between adjacent CNTs, and the polymer properties. Assuming a square tunnelling barrier height of λ, the tunnelling resistance between two neighbouring CNTs can be approximated by [22]

where m is the mass of an electron, e is the elementary charge, h is Planck's constant, d is the distance between CNTs, and A the cross-sectional area of the junction. Smaller diameter CNTs usually result in a smaller overlapping area A and higher Rt. The cross-sectional area A may vary with bending and alignment of the tubes. For simplicity, we approximated this area at the overlapping position by A = D2. A schematic diagram of a CNT pair with tunnelling distance is shown in figure 1(b), where electron conduction occurs between two tubes through the minimum inter-tube gap dmin, and also through the tubes themselves. A schematic diagram illustrates the series resistances representing tunnelling and conduction along CNT segments, denoted by Rt and Rc, respectively.
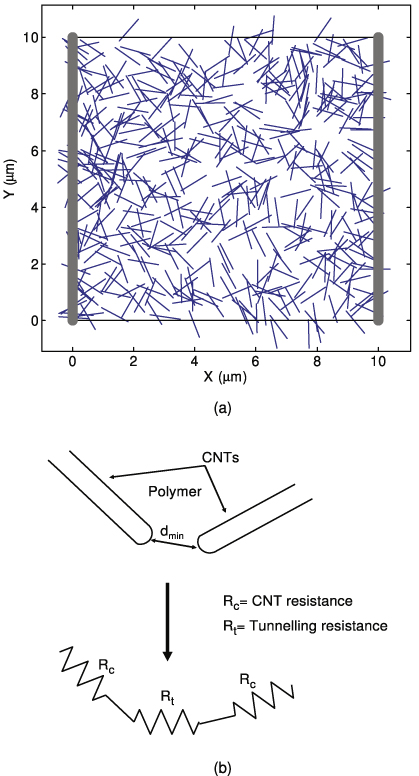
Figure 1. Schematic diagrams of (a) a 2D CNT network with electric field applied on it and the percolating cluster shown within the dashed line, and (b) a CNT pair with a tunnelling gap between them. The resistance along the CNTs is denoted as Rc and the tunnelling resistance as Rt.
Download figure:
Standard imageSince tunnelling occurs only between nearest neighbour CNTs, the minimum distance between any arbitrary pair of tubes determines the tunnelling probability. In this work, we have estimated the average minimum distance between any arbitrary pair of tubes dmin in a CNT network for varying CNT concentration and alignment order. We generated random samples of CNT 2D networks using MATLAB with wide variation in the sample parameters. The parameters considered here are concentration, alignment, aspect ratio of the CNTs, tunnelling barrier potential of the polymer, and applied mechanical strain. For each set of parameters, the minimum inter-tube distance is calculated by the Monte Carlo procedure with 1000 randomly generated samples following the method [14]. The CNT concentration in a thin film is measured here in terms of the volume fraction ϕ.
Figure 2 shows that with increasing CNT volume fraction ϕ the minimum inter-tube distance dmin decreases exponentially. For a randomly oriented CNT network, we propose here a relation between dmin and ϕ that reads

which can be extracted as k = 1.345 × 10⁻⁸ and n = 3.0109 for a random CNT network attained from a large number of simulations. Therefore, we propose a model of the inter-tube tunnelling resistance of a randomly oriented CNT network as a function of volume fraction,

where  and
and  . α and β are polymer dependent parameters, whereas k is ideally independent of polymer type, but is a function of the aspect ratio and the degree of alignment of the CNTs in the composite.
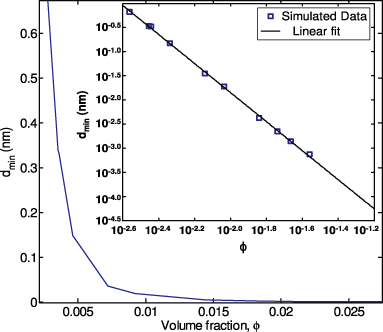
Figure 2. Minimum inter-tube distance for varying CNT concentration for a random network. The figure in the inset shows an approximation of the simulated data.
Download figure:
Standard imageSince we have assumed the direction of the desired electrical conduction to be along the X axis, the CNTs can be randomly distributed or partially aligned to this axis. We simulated the inter-tube distance for different orientation angles θ of the CNTs. The overall tube orientation in the sample space is measured here in terms of a cut-off angle θμ [11] with respect to the X axis, i.e. the desired direction of conduction. The orientation angle of an arbitrary tube can take a statistically random value between + θμ and − θμ, where 0°≤ θμ ≤ 90°. So, at θμ = 0° the tubes are completely aligned towards the X axis, whereas at θμ = 90°they are distributed with random orientation. Figure 3 illustrates the simulated result for the inter-tube gap as θμ is varied from 10° to 90° for different concentrations of CNTs. This figure shows that the inter-tube gap is minimum for a random orientation of tubes for any level of concentration.
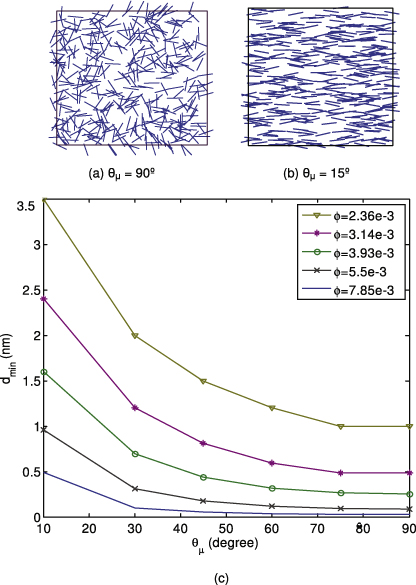
Figure 3. Schematic diagrams of CNT 2D networks with θμ = 90° and θμ = 15° are shown in (a) and (b) respectively; (c) shows the minimum inter-tube distance for varying alignment order of the CNTs at different volume fractions.
Download figure:
Standard imageIn a CNT/polymer composite, the tunnelling resistance Rt depends not only on the inter-tube distance, but also on the polymer type. The tunnelling energy barrier height λ varies widely depending on the polymer used. For instance, poly(methyl methacrylate) (PMMA), polydimethylsiloxane (PDMS), polyethylene, polystyrene and some epoxies are examples of polymers used in CNT composites. Some of these polymers have low tunnelling barriers (e.g. for PMMA λ = 0.17 eV [23]), whereas some have relatively high values of λ (e.g. for epoxy λ = 1.5 eV [22]). Figure 4 illustrates the tunnelling resistance Rt at varying CNT concentration for different values of the tunnelling barrier height λ for composite samples with randomly distributed CNTs. This figure reveals that, at lower volume fractions of CNTs, higher tunnelling resistances are obtained with polymers of high λ, but at higher CNT concentrations the result reverses. This result points to the competing effects of the inter-tube distance determined by the CNT concentration and the tunnelling barrier height of the polymer based on (4). As we discuss later, this may be helpful in choosing the appropriate polymer for a specific strain sensor, since the strain sensitivity of a CNT/polymer composite film is mostly influenced by the tunnelling resistance, and therefore the comparative values of Rt as shown in figure 4.
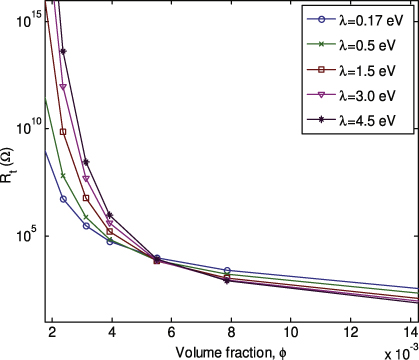
Figure 4. Inter-tube tunnelling resistances of CNT/polymer composites at varying volume fraction of CNTs for polymers with different tunnelling barriers.
Download figure:
Standard imageSince the composite conductivity is greatly influenced by the tunnelling resistance, the effect of the tunnelling energy barrier height λ on Rt has an impact on the overall conductivity of the composite. This effect has been reported in [13]. We numerically calculated the electrical conductivity for CNT/polymer composites σcomp first without including the tunnelling effect, and then considering tunnelling through polymers with different λ. The result is shown in figure 5. The CNT aspect ratio is taken as 100 and λ is varied from 0.5 to 2 eV. This result shows that when we consider tunnelling we get increased conductivity of the composite, and this effect is prominent near the percolation region. As the height of the tunnelling barrier λ becomes lower the conductivity becomes higher. However, the effect of the increased conductivity due to tunnelling gradually decreases at higher CNT volume fraction.
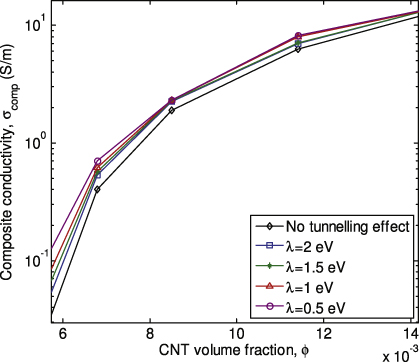
Figure 5. Electrical conductivities of CNT/polymer composites at varying volume fraction of CNTs for polymers with different tunnelling barrier heights (following [13]).
Download figure:
Standard imageElectron tunnelling through the thin polymer layers allows electrical conduction through a filler network even when the physical network has not reached percolation. Again, after reaching percolation, although the conduction occurs through the physically connected filler network, tunnelling conduction still continues through the CNT–CNT junctions where inter-tube distance is within the tunnelling gap. Therefore both the percolating and tunnelling conduction simultaneously contribute to the composite conductivity. If the tunnelling effect were not present, the composite conductivity would depend only on the percolation process and the filler properties, and not on the polymer, as can be understood from (1). But in fact the use of different polymers, i.e., different λ, with the same fillers changes the composite conductivity, which indicates the effect of the polymer via tunnelling. From figure 5 we see that as λ is decreased, we obtain the same conductivity at a lower CNT concentration, which means it effectively lowers the electrical-percolation threshold. The minimum CNT concentration at which the tunnelling conduction begins is named here as the tunnelling threshold, ϕt. Since conduction starts via tunnelling before the CNT concentration reaches the actual percolation threshold ϕc, we can say that ϕt < ϕc. This effect of tunnelling on the composite conductivity was reported in [13], but only based on numerical results. Here we propose a model for the CNT/polymer composite conductivity which includes the effects of both percolation and tunnelling,

where σp = σcnt(ϕ−ϕc)r for ϕ > ϕc and σt = σt0(ϕ−ϕt)s for ϕ > ϕt. Here, σp is the percolation conductivity, σt is the tunnelling conductivity, σcnt is the conductivity of the CNTs. σt0 and s can be determined from experiments.
We simulated σp and σcomp for MWNTs with AR = 100, σcnt = 104 S m−1 and for polymers with different λ. From these numerical results we obtained σt for varying CNT volume fraction. This result is shown in figures 6 and 7. Figure 6(a) shows that the tunnelling conductivity displays linear behaviour with increasing ϕ for all λ. Therefore s proves to be independent of the polymer properties and we can use s = 1 in (5). However, both ϕt and σt0 should depend on the polymer type and be a function of the tunnelling barrier height. Figures 6(b) and (c) show the effect of tunnelling barrier height on ϕt and σt0. For a higher λ we get higher ϕt and lower σt0. Using (5) and the parameters ϕt, σt0 and s obtained from the linear fitting of numerical data, we calculated the conductivity σcomp for an MWNT/epoxy composite. For epoxy we used λ = 1.5 [13].
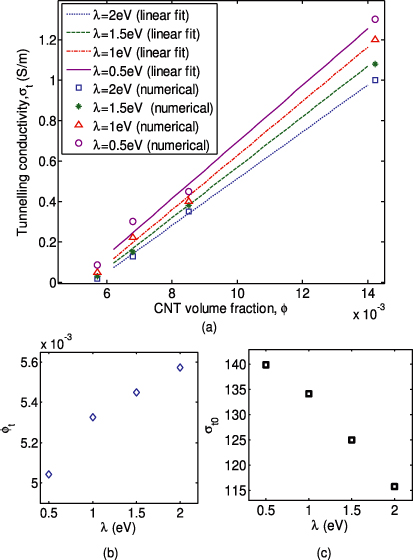
Figure 6. The tunnelling conductivity of CNT/polymer composites at varying volume fraction of CNTs for polymers with different tunnelling barrier heights.
Download figure:
Standard image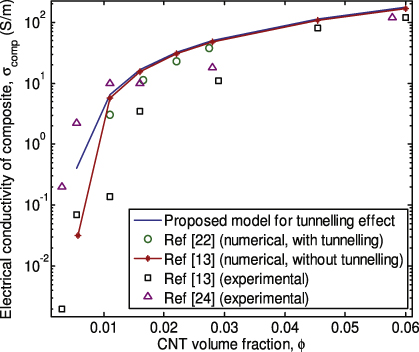
Figure 7. Comparison of different numerical and experimental data of MWNT/epoxy composite conductivity at varying volume fraction of CNTs.
Download figure:
Standard imageFigure 7 compares the results from our model with some other experimental and numerical results reported in the literature [13, 22, 24]. As can be seen, the σcomp obtained from our model shows higher conductivity than the numerical result without the tunnelling effect in [13], in particular for low CNT volume fraction. This is in agreement with the results comparing the effect of polymer barrier height and no tunnelling effect in figure 5, following [13]. But the result that incorporates tunnelling in [22] shows lower conductivity in comparison to the results without tunnelling which contradicts the result shown in figure 5. Our result agrees with the fact that allowing tunnelling conduction increases the composite conductivity near the percolation region, and better describes the experimental results for low CNT volume fraction. There is still a lot to be explored on the effect of tunnelling resistance between CNT pairs on the tunnelling threshold and the impact of different CNT orientations or aspect ratios on these parameters.
We varied the orientation and alignment of CNTs by changing the cut-off angle θμ, and observed the effect on the tunnelling resistance for polymers with different tunnelling barrier heights. The CNT volume fraction was kept fixed at ϕ = 0.0055. The result is demonstrated in figure 8. It shows that Rt is higher for a polymer with higher λ and lower θμ, i.e. a higher alignment of CNTs in the direction of conduction. At lower θμ, i.e., higher CNT alignment, the probability of making tunnelling CNT–CNT junctions decreases and hence the percolation threshold goes higher [15]. This actually results from the higher inter-tube gap at lower θμ, as shown by figure 3, and subsequently increases Rt.

Figure 8. The inter-tube tunnelling resistance of CNT/polymer composites at varying orientation of CNTs for polymers with different tunnelling barriers.
Download figure:
Standard imageWe can tune the tunnelling resistance and as a result the thin film resistance by varying the orientation angle of the CNTs in the composite film. The effect of the tube orientation order on the tunnelling resistance is shown in figure 9. We changed the CNT concentration and alignment order, keeping the tunnelling barrier potential of the polymer at 1.5 eV. We can see that Rt decreases with increased cut-off angle, i.e., decreased alignment of the tubes for the whole range of CNT volume fractions.
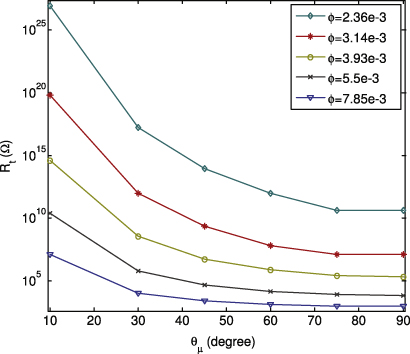
Figure 9. The inter-tube tunnelling resistance at varying orientation cut-off angle of the CNTs for different CNT volume fractions.
Download figure:
Standard image4. Sensitivity to mechanical strain
When tensile strain is applied on a CNT/polymer composite film, the film dimension and the orientation angle of most of the tubes in the film are modified, which in turn change the inter-tube distance and the tunnelling resistance. Consequently, the overall film resistance is affected. The change in film dimension is determined by the applied strain  and the Poisson's ratio of the polymer ν. The sensitivity of a thin film strain sensor is presented as the gauge factor GF, described by

Here R is the film resistance and L is the initial length of the film before the strain is applied. For a given strain , the higher the resistance change ratio △R/R is, the higher the gauge factor is and the better the sensitivity is.
Since the film resistance is mostly dominated by the tunnelling resistance, and the change in tunnelling resistance is in turn governed by the inter-tube distance variation with applied strain, the tunnelling resistance change ratio can be used as a powerful indicator of the strain sensitivity of a CNT/polymer composite thin film. We simulated the values of the tunnelling resistance change ratio △Rt/Rt for different mechanical strains applied on a CNT/polymer thin film using the fibre reorientation model [25].
For the small applied strain ( ≤ 0.01) that occurs in many sensing applications, we simulated △Rt/Rt and the corresponding gauge factor GFt. Figure 10 shows the effect of CNT concentration on △Rt/Rt and GFt for a polymer with λ = 1.5 eV and ν = 0.4. From the inset of figure 10 we can see, at lower strain levels, that △Rt/Rt increases almost linearly with the strain, hence the tunnelling gauge factor GFt appears to be constant for a given CNT concentration. A lower CNT concentration is shown to yield a higher △Rt/Rt and hence a higher sensitivity, which agrees with the result reported in [22]. This indicates that the tunnelling resistance change ratio demonstrates a behaviour similar to the film resistance change ratio under mechanical strain for elastic sensors. However, the result for very high applied strains (0.2 < < 1.5) in highly stretchable rubber composites appears to be different, as shown in figure 11. This figure illustrates an exponential increase in △Rt/Rt with increasing strain up to a certain limit, then △Rt/Rt saturates for higher CNT concentrations, and falls for lower CNT concentrations. This change in the △Rt/Rt pattern may result from the narrowing width of the film at high strains and the corresponding change in the tube positions. As the strain becomes higher, the CNTs in the longitudinal direction are displaced to have a larger distance. But at the same time the width of the polymer film decreases according to its Poisson's ratio, and brings the CNTs lying in the same cross-section closer to each other. Therefore, these two effects work simultaneously in the redistribution of the tubes and in determining the dmin, Rt and △Rt/Rt under a particular mechanical strain. The drop in the △Rt/Rt after a certain strain may be caused by the dominant effect of the change in the film width and the minimum inter-tube distance, and is being investigated further.

Figure 10. The tunnelling gauge factor as a function of CNT volume fraction at small mechanical strains. The inset illustrates the tunnelling resistance change ratio as a function of strain for different CNT volume fractions.
Download figure:
Standard image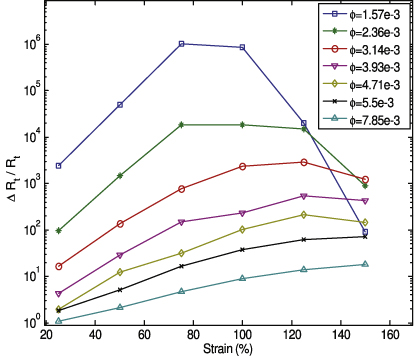
Figure 11. The tunnelling resistance change ratio at large mechanical strains for different CNT concentrations.
Download figure:
Standard imageFigures 12 and 13 illustrate the effect of CNT alignment on the strain sensitivity at low and very high applied mechanical strains, respectively. At low strains, as shown in the inset of figure 12, △Rt/Rt shows linear increment with increasing strain. We can see that as the cut-off angle θμ is decreased from 90° to 30°, i.e. as the CNTs become more aligned, we get increased sensitivity, i.e. higher GFt, but as θμ goes even lower from 30° to 15°, the sensitivity is decreased. This result is quite reasonable, because when the CNTs are not aligned with the strain direction then any change in the strain will change both the linear and the angular distance between the tube pairs, thus affecting △Rt/Rt. At different applied strains, the CNTs will be reoriented with a new θμ and dmin, leading to incremental changes in dmin and Rt. From figure 3 we can see that near the random orientation order, i.e. θμ = 90°, the incremental change in dmin with θμ is low, but it is higher as the θμ decreases, i.e., the tubes are more aligned. The higher the incremental change in dmin is, the higher the change in Rt is and the higher the sensitivity is. But when the tubes are arranged in complete alignment, there will be no change in the angular distance of the tubes with the applied strain. So the lower incremental change in inter-tube gap will result in lower resistance range, and hence lower strain sensitivity. Therefore the orientation order of the CNTs is crucial in determining the optimum sensitivity for a given strain range. However, this result of low strain effect conflicts with the result in [22], which reports a lower resistance change ratio at higher alignment, possibly due to the elimination of changes in the angular distance between tubes. When large strain is applied, as shown in figure 13, we see that initially △Rt/Rt increases non-linearly with increasing strain, and after reaching a maximum value it begins to drop. For lower θμ, this drop in △Rt/Rt begins at lower strain values. The probable cause behind this result in the high strain regime may be the effect of the film dimensions on the distribution of the tubes. However, our result agrees with the experimental reports in [26].
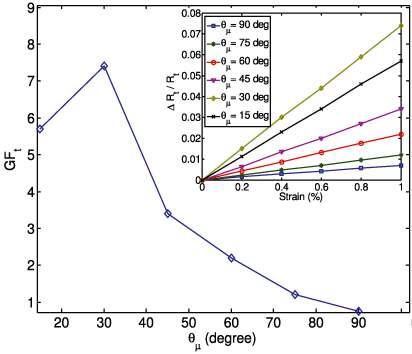
Figure 12. The tunnelling gauge factor as a function of the orientation cut-off angle of the CNTs at small mechanical strains. The inset illustrates the tunnelling resistance change ratio as a function of strain for different orientation cut-off angles.
Download figure:
Standard image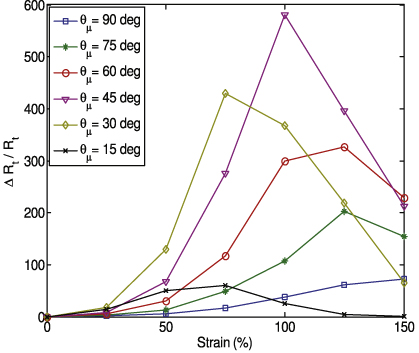
Figure 13. The tunnelling resistance change ratio at large mechanical strain for different orientation cut-off angles.
Download figure:
Standard imageWe have also studied the effect of different CNT aspect ratios on the tunnelling resistance and strain sensitivity of CNT/polymer thin films. These results can be found in the supplementary information (available at stacks.iop.org/Nano/23/055703/mmedia).
5. Conclusion
We have proposed a model for CNT/polymer composites which includes the effect of inter-tube tunnelling, and associated parameters such as CNT concentration and tunnelling barrier height of the polymer. We numerically studied the effects of CNT concentration, alignment and aspect ratio on the inter-tube distance and tunnelling resistance in CNT/polymer thin films using a Monte Carlo based statistical simulation. The CNT and polymer properties can be modified to obtain the desired resistance and sensitivity to strain. We calculated the tunnelling resistance change ratio and gauge factor for a wide range of external mechanical strains to estimate the effect on strain sensitivity of variation of different parameters (CNT concentration, aspect ratio, alignment order). Our results demonstrate that higher sensitivity can be obtained for a lower concentration and aspect ratio of the CNTs and at a specific partial alignment with respect to the conduction direction, rather than in a random network. The choice of polymer and its energy barrier height play a critical role in determining the role of tunnelling and percolation of NTs in the overall conductance and piezoresistance of the composite film. Our numerical analysis is a step towards understanding the role of inter-tube tunnelling in determining the resistance and strain sensitivity of a CNT/polymer composite, and thus can be utilized for optimization of composite fabrication for specific applications such as flexible electronics and sensors.
Acknowledgment
The authors acknowledge the financial support of the Natural Sciences and Engineering Research Council (NSERC) of Canada.