Abstract
We investigate the benefits of tuning the frequencies of an energy harvester to extract more energy from a base excitation that comprises three frequency components. The energy harvester is composed of a unimorph cantilever beam with asymmetric tip masses. By adjusting the asymmetry of the tip masses, we can tune this beam–mass structure to harvest energy from multifrequency components of a base excitation. We model the beam using the Euler–Bernoulli beam theory and use the first three global mode shapes of the harvester in a Galerkin procedure to derive a reduced-order model describing its response. We derive an exact analytical solution for the tip deflection, twisting angle, voltage output, and harvested electrical power. Using this solution, we investigate the advantages of harvesting energy from a response that contains multifrequencies in comparison to a response that contains a single frequency by tuning only the fundamental frequency. The advantages of this bending–torsion energy harvester and the effect of its tuning are investigated for different short- and open-circuit configurations. The results show that, through a proper tuning of this bending–torsion harvester, the harvested power can be increased significantly and it can be made to cover a wide range of electrical load resistances.
Export citation and abstract BibTeX RIS
1. Introduction
Vibration-based energy harvesting systems have been the focus of many recent investigations. This interest stems from the need to power microelectromechanical systems [1–3], health monitoring sensors [4], and wireless grid sensors [5]. These harvesters have also been proposed to power devices that rely on batteries, which have a finite life span and are difficult or expensive to maintain. The transduction mechanisms used for transforming vibration to electric power include electromagnetic [6], electrostatic [7], and piezoelectric mechanisms. Because it can be used to harvest energy over a wide range of frequencies, the piezoelectric option has attracted significant interest and has been investigated by many researchers [8–13].
The most common vibration-based energy harvester consists of a cantilever beam, which is generally composed of one or two piezoelectric layers. These layers are bounded by electrodes that harvest the produced voltage. The electrodes are externally connected by an electric circuit that is usually modeled as a simple electrical load resistance. Different beam designs have been considered to maximize the amount of harvested electrical power [14–19]. Abdelkefi et al [19] proposed a unimorph piezoelectric cantilever beam that undergoes coupled bending–torsion vibrations under transverse harmonic base excitation. Using the Galerkin procedure, they derived a reduced-order model and determined analytical expressions for the displacement, twisting angle, voltage output, and harvested power. They demonstrated that the bending–torsion harvester yields a 30% increase in the harvested power when compared to classical symmetric designs. This comparison was based on a response with a single frequency component.
Different tuning mechanisms [20–24] have been proposed to tune the global fundamental frequency of a harvester to the dominant frequency of the excitation. Roundy et al [25] showed that some tuned harvesters cannot be used in cases of random or fast-varying frequency excitations. The reason is that external power is needed to power actuators for active tuning of the resonance frequency. This power could be larger than the harvested power. Masana and Daqaq [26] proposed an axially loaded piezoelectric clamped–clamped beam in order to tune the natural frequency of the harvester with the excitation frequency. Other investigations [27–30] have proposed the use of the bi-stable magneto-elastic structure developed by Moon and Holmes [31] to excite a fixed harmonic frequency from broadband vibrations.
In many applications, the ambient vibrations may be random or composed of a few discrete frequency components [32]. In these cases, it is possible to design or tune the harvester to respond to more than one frequency component. This enhancement, in terms of system tuning, may harvest more power than what would be obtained from a structure responding to a single frequency component. Concerning random vibrations, some studies [33–37] have investigated the effects of these vibrations on the average harvested power. Adhikari et al [33] used a stochastic approach to analyze the influence of white Gaussian noise on the response of a piezoelectric energy harvester. Daqaq [38] presented analytically a generic lumped model which takes into consideration the effects of tuning the natural frequency of the harvester, mono- and bi-stable inductive vibratory energy harvesters and white Gaussian noise intensities.
In cases where the ambient vibrations are composed of a few discrete frequency components, tuning can be performed to extract energy from all the components. This tuning can be implemented passively by adjusting the asymmetry of the tip masses of the bending–torsion harvester proposed by Abdelkefi et al [19]. The objective of this paper is to quantify the increase in the level of power obtained by tuning this harvester to generate energy from more than one frequency component. Using the Euler–Bernoulli beam theory, the Euler–Lagrange and Gauss law equations, and the Galerkin procedure based on the first three bending–torsion mode shapes, we obtain closed-form solutions for the tip deflection, twisting angle, voltage output, and harvested power. The effect of exploiting a response with multifrequency components on the electrical load resistance is investigated for both short- and open-circuit configurations.
2. Problem formulation
A schematic of the bending–torsion unimorph piezoelectric cantilever beam is presented in figure 1. The base excitation is assumed to be parallel to the y-axis. The beam is modeled using the Euler–Bernoulli theory with length L, width b, and height h. The thickness comprises the steel and piezoelectric layers with thicknesses hs and hp, respectively. The tip masses and their attachments are assumed to be rigid and asymmetrically placed with respect to the x-axis. This asymmetry creates a coupling between the bending and torsion motions described, respectively, by v(x,t) and θ(x,t). As shown in figure 2, the position of each layer is defined with respect to the neutral axis. These positions are given by

where  is the neutral axis position.
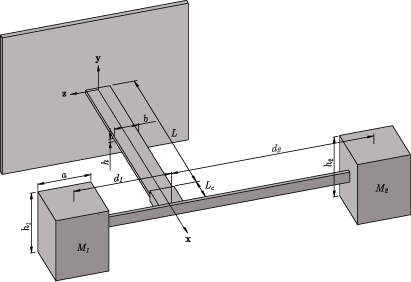
Figure 1. Schematic of the bending–torsion unimorph cantilever beam.
Download figure:
Standard image
Figure 2. The neutral axis position.
Download figure:
Standard imageTo derive a reduced-order model of the proposed system, we write the kinetic energy T and potential energy Π of the harvester as [19]
and

where Y(t) is the base displacement of the harvester, m is the mass per unit length of the beam,
is the cross-sectional moment of inertia, ![${I}_{0}=[{I}_{1}+ ({M}_{1}{d}_{1}^{2}+{M}_{2}{d}_{2}^{2})]$](https://content.cld.iop.org/journals/0964-1726/21/7/075029/revision1/sms422695ieqn121.gif) is the tip masses' polar moment of inertia with respect to the reference frame, and
is the tip masses' polar moment of inertia with respect to the reference frame, and  . The subscript L denotes a variable calculated at x = L,M = M1 + M2 is the total tip mass, and the parameter Mt = M1d1 − M2d2 is used to describe the asymmetry of the two tip masses. In equation (2),
  is the piezoelectric stress coefficient, V(t) is the voltage between the piezoelectric electrodes, and

We also use the Gauss law

where D is the electric displacement vector,  is the permittivity at constant strain, and n is the normal vector to the plane of the beam.
For convenience, we introduce the following nondimensional variables:
For the rest of this paper, the hats will be omitted.
To determine the transverse displacement, twisting angle, and harvested voltage, we use the Galerkin procedure to develop a reduced-order model that describes the dynamic behavior of these quantities. We assume that the global frequencies of the harvester have been tuned to the lowest three frequencies in the base displacement. Therefore, we expand the nondimensional bending displacement and twisting angle as
where the ϕi(x) and the ψi(x) are the nondimensional global mode shapes corresponding to the lowest three global frequencies of the harvester (coupled beam–electrical circuit). To develop the reduced-order model, there are two possibilities: to implement the Galerkin procedure either in the Gauss law and the Lagrangian of the system or in the Gauss law and Euler–Lagrange equations and associated boundary conditions obtained from equations (1) and (2). Here, we choose the first option. Thus, we rewrite the kinetic and potential energies in nondimensional form  and
and  and form the nondimensional Lagrangian
  . Next, we substitute equation (4) into the Lagrangian and integrate the outcome from x to L to obtain l. Then, we develop the reduced-order model using the Euler–Lagrange equation which is given by
Carrying out this procedure and adding linear viscous damping, we obtain the following three coupled ordinary differential equations:

where

Implementing the Galerkin approximation in the Gauss law (3), we obtain
Equations (5) and (6) represent a set of coupled linear ordinary differential equations (ODEs) for the modal mechanical response qi(t) and the harvested voltage V(t).
3. Closed-form expression of the steady-state solution
As aforementioned, the lowest three global frequencies are tuned to the lowest three base frequencies and, hence, we consider

where Yi and τi represent the amplitude and phase of the component of base displacement at the frequency Ωi,Re(f) denotes the real part of the complex-valued function f, and  . Because the system of equations (5) and (6) is linear, we use the superposition principle to find analytical solutions for the voltage V and modal amplitudes qi. Therefore, we seek a solution of the system corresponding to the excitation proportional to frequency ej(Ωit+τi) in the form

where m = 1–3, Q1i,Q2i, Q3i, and Vi are complex-valued amplitudes. Substituting equation (7) into equations (5) and (6) and equating the coefficients of ej(Ωit+τi) on both sides, we obtain the algebraic system of equations
where
and
Using equation (8), we determine the exact solutions for Q1i, Q2i, Q3i, and Vi. Then, using the principle of superposition, we obtain the following closed-form expressions for the modal amplitudes and voltage:
Consequently, the exact expressions for the tip displacement, twisting angle, and harvested electrical power can be expressed as
4. Results
The physical and geometric properties of the beam and the asymmetric masses that constitute the bending–torsion energy harvester shown in figure 1 are presented in table 1. To take advantage of the bending and torsion motions, we tune the structure by choosing a configuration in which the distance d1 − d2 is different from zero [19]. Figure 3 shows variations of the first four structural natural frequencies of the harvester with the tip asymmetry parameter Mt = M1d1 − M2d2, which is varied by changing d1 from −50 to 50 mm. We note that negative values of d1 correspond to placing both masses on the same side of the cantilever beam. Figure 3 shows that the frequencies of the first and fourth modes, which are mainly associated with bending, are not impacted by the asymmetry parameter. On the other hand, the frequency of the second mode, which is associated with the torsional moment, is significantly impacted by varying Mt. The frequency of the third mode is impacted slightly over a small range of negative d1 values between −10 mm and zero. Of particular interest are the d1 values for which the separation between the frequencies of the first and second modes is small. Under these conditions, a broadband excitation may lead to enhanced levels of harvested power.
Table 1. Physical and geometric properties of the unimorph cantilever beam.
| Es | Steel Young's modulus (N m−2) | 193 × 109 |
| Ep | Piezo Young's modulus (N m−2) | 66 × 109 |
| Gs | Steel Coulomb's modulus (N m−2) | 74.81 × 10⁹ |
| Gp | Piezo Coulomb's modulus (N m−2) | 25.19 × 10⁹ |
| ρs | Steel density (kg m−3) | 8000 |
| ρp | Piezo density (kg m−3) | 7800 |
| L | Length of the beam (mm) | 25 |

|
tip mass offset (mm) | 3.5 |
| b | Width of the beam (mm) | 3.2 |
| hs | Steel layer thickness (mm) | 0.1 |
| hp | Piezo layer thickness (mm) | 0.4 |
| e31 | Piezoelectric coupling coefficient (C m−2) | −12.54 |

|
Piezoelectric permittivity (F m−1) | 1.328 × 10⁻⁸ |
| Tip mass parameters | ||
| d1 | Offset mass distance for M1 (mm) | 45 |
| d2 | Offset mass distance for M2 (mm) | 5 |
| M = M1 + M2 | Tip mass (kg) | 0.006 |
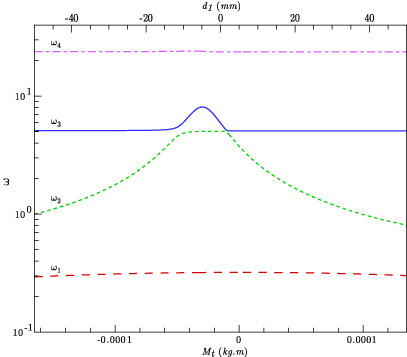
Figure 3. Variations of the first four structural natural frequencies with Mt.
Download figure:
Standard imageThe advantage of using a harvester such as the one considered here is that the distances d1 and d2 and the two masses M1 and M2 can be adjusted or tuned to enable energy harvesting from different frequency components of the base displacement. In the rest of this paper, we focus on the effect of tuning the structure to respond at three frequencies, namely Ω1, Ω2, and Ω3. We consider two values for the load resistance R, namely 104 Ω and 106 Ω, to determine its impact on the harvested power. The amplitudes of the three frequency components are set equal to the same nondimensional value  , where g is the gravitational acceleration; that is,

Moreover, the phases τi are set equal to  .
.
4.1. Variation in the harvested power by frequency tuning
Figures 4, 5, 6 and 7 show time histories of the harvested electrical voltage and power for different configurations of tuned frequencies and a load resistance equal to 106 Ω. The choice of the tuned frequencies is made such that the first global frequency, as presented in table 2, matches the first excitation frequency. The short and open global frequencies are defined by setting the electrical load resistance to 102 Ω and 106 Ω, respectively. The superscripts s and o denote, respectively, frequencies calculated for the short- and open-circuit configurations. The averaged power is calculated from the root mean square (RMS) value of the generated voltage as

As expected, and because of the linearity of the system, the maximum attainable extracted average electrical power is obtained by tuning all three frequencies. Figure 5 shows that an increase of 12% in the harvested power is obtained when the first short global frequency  is tuned to match the first excitation frequency and the open global frequencies
  and
and  are tuned to match the frequencies of the second and third components in comparison to the case where the second and third frequencies are not tuned; that is, ω2 and ω3 are set far from the excitation frequencies Ω2 and Ω3, respectively. Similarly, figure 7 shows that tuning the open global frequencies to the excitation frequencies (
 , and
, and  ) increases the harvested power by 21% in comparison to the case where only the first open global frequency is tuned to the first excitation frequency (
 ). The harvested voltage and power increase as the number of matched global frequencies increases. We also note the quasiperiodic aspect of the time series when the excitation frequencies are incommensurate.
Time histories of the harvested voltage and power for different configurations of tuned frequencies for the case R = 104 Ω are presented in figures 8 and 9. The results show that, by additional tuning of the second and third frequencies, the level of harvested power is increased from 2.65 × 10⁻⁴ W (figure 9(a)) to 0.0512 W (figure 9(d)). Clearly, tuning the bending–torsion energy harvester leads to a significant improvement in the level of harvested power.
Table 2. Global natural frequencies for short- and open-circuit configurations.
| ω1 | ω2 | ω3 | |
|---|---|---|---|
| Short circuit | 0.306 86 | 0.898 82 | 5.084 53 |
| Open circuit | 0.326 55 | 0.906 06 | 5.160 94 |

Figure 4. Time history of the harvested voltage when R = 106 Ω. (a) Tuning only  . (b) Tuning only
  and
and  . (c) Tuning only
  and
and  . (d) Tuning
  ,
,  , and
, and  .
.
Download figure:
Standard image
Figure 5. Time history of the harvested power when R = 106 Ω. (a) Tuning only  . (b) Tuning only
  and
and  . (c) Tuning only
  and
and  . (d) Tuning
  ,
,  , and
, and  .
.
Download figure:
Standard image
Figure 6. Time history of the harvested voltage when R = 106 Ω. (a) Tuning only  . (b) Tuning only
  and
and  . (c) Tuning only
  and
and  . (d) Tuning
  ,
,  and
and  .
.
Download figure:
Standard image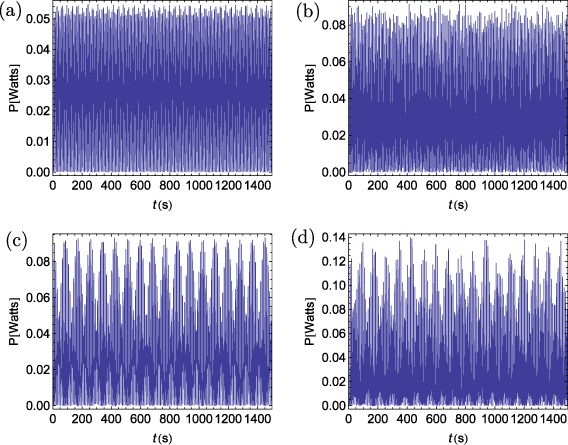
Figure 7. Time history of the harvested electrical power when R = 106 Ω. (a) Tuning only  . (b) Tuning only
  and
and  . (c) Tuning only
  and
and  . (d) Tuning
  ,
,  and
and  .
.
Download figure:
Standard image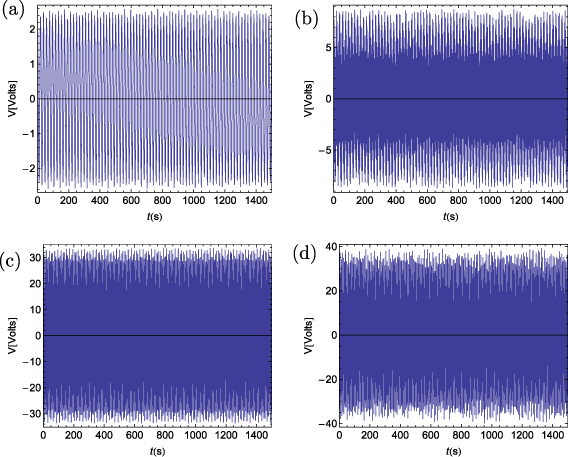
Figure 8. Time history of the harvested voltage when R = 104 Ω. (a) Tuning only  . (b) Tuning only
  and
and  . (c) Tuning only
  and
and  . (d) Tuning
  ,
,  and
and  .
.
Download figure:
Standard image
Figure 9. Time history of the harvested electrical power when R = 104 Ω. (a) Tuning only  . (b) Tuning only
  and
and  . (c) Tuning only
  and
and  . (d) Tuning
  ,
,  and
and  .
.
Download figure:
Standard image4.2. Influence of the electrical load resistance
It has been shown in other studies [15, 19] that the load resistance can be optimized to increase the generated power. We investigate here the effect of the load resistance on the harvested electrical power from a harvester with frequencies tuned to match the excitation frequencies. To illustrate the significance of using a tuned energy harvester, we plot the amplitude of the generated power as a function of the load resistance for both short- and open-circuit configurations for three different cases. In the first and second cases, we consider the configuration where the fundamental frequency is the only tuned frequency by matching it to the first excitation frequency; that is,  or
or  . These two cases are referred to as harmonic configurations. In the third and fourth cases, the three global frequencies of the structure (all short or all open, depending on the circuit configuration) are tuned with the first three excitation frequencies. These cases are referred to as the multifrequency configurations. A fifth case is introduced for the multifrequency configuration in which the circuit configuration is set by tuning the structure frequencies as follows:
  , and
, and  . This configuration is referred to as the short/open/open-circuit configuration. In the sixth considered circuit configuration, we set
  , and
, and  . This configuration is referred to as the open/short/short-circuit configuration.
Figure 10 shows variations of the harvested power with the load resistance for all of the above six configurations. We note that there is an intersection point of all short- and all open-circuit configurations, which corresponds to a resistance value Rint ≈ 2 × 10⁶ Ω. We also note that, for all considered configurations where  , the level of the harvested power does not improve in the region R < Rint whether the other frequencies are tuned or not. In contrast, there is an increase in the level of harvested power in the short/open/open-circuit configuration for R > Rint and there is a second peak when R ≈ 2 × 10⁸ Ω. Clearly, the tuning of the second and third open global frequencies with the second and third excitation frequencies increases the power level significantly over the range of load resistance R > Rint.
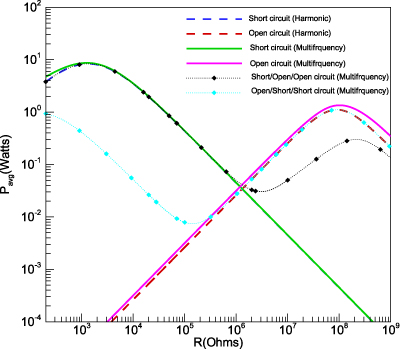
Figure 10. Variation of the harvested power with the load resistance for different open- and short-circuit configurations.
Download figure:
Standard imageTable 3. Comparison of the averaged harvested power for different values of the load resistance for the open circuits when using harmonic and multifrequency excitations.
| R (Ω) | Harmonic | Multifrequency | % |
|---|---|---|---|
| 102 | 2.650 × 10⁻⁶ | 3.177 × 10⁻⁶ | 19.9 |
| 104 | 2.650 × 10⁻⁴ | 3.178 × 10⁻⁴ | 20 |
| 105 | 2.635 × 10⁻³ | 3.175 × 10⁻³ | 20.5 |
| 106 | 0.0262 | 0.0317 | 21 |
| 107 | 0.2553 | 0.3013 | 18 |
For the open-circuit configurations, a comparison of the harvested power levels between the open harmonic configuration ( ) and all of the open configurations of the multifrequency case (
 ,
,  , and
, and  ) shows an increase of about 20% (red solid and dashed lines) in the region R < Rint. This is also presented in table 3. In the region R > Rint, the level of harvested power from the open/short/short-circuit configuration is approximately the same as that of the open harmonic case. Finally, we note the increase by several orders of magnitude in the harvested power when the second and third short global frequencies are tuned to match the second and third excitation frequencies when R < Rint.
5. Conclusion
We have investigated the enhancement in the level of energy harvesting from a bending–torsion unimorph piezoelectric cantilever beam when the frequencies of its first three modes are tuned to the frequencies in the excitation source. The Euler–Bernoulli beam theory and the Galerkin method were used to derive a representative model based on the first three mode shapes of the associated global eigenvalue problem. The multifrequency excitations were considered as the sum of three temporary harmonic terms. Exact analytical solutions for the tip deflection, twisting angle, voltage output, and harvested power were then derived. Using the derived expressions, we quantified the differences in the harvested energy among the different cases in which the first three global frequencies are tuned with the excitation frequencies and the case in which only the first global frequency is tuned with the first excitation frequency. We have performed a parametric study to determine the advantages of tuning the structure to harvest energy at multiple frequencies. We have shown that, when the second and third global frequencies are tuned to match the second and third excitation frequencies, the level of harvested energy can be increased significantly. We have also shown how different circuit configurations can be used to enhance the power generation over a wide range of load resistance.