

Abstract
Flexible foam composite materials offer multiple benefits to future electronic applications as the rapid development of the electronics industry requires smaller, more efficient, and lighter materials to further develop foldable and wearable applications. The aims of this work were to examine the electrical properties of three- and four-phase novel foam composites in different conditions, find the optimal mixture for four-phase foam composites, and study the combined effects of lead zirconate titanate (PZT) and graphite fillers. The flexible and highly compressible foams were prepared in a room-temperature mixing process using polyurethane, PZT, and graphite components as well as their combinations, in which air acted as one phase. In three-phase foams the amount of PZT varied between 20 and 80 wt% and the amount of graphite, between 1 and 15 wt%. The four-phase foams were formed by adding 40 wt% of PZT while the amount of graphite ranged between 1 and 15 wt%. The presented results and materials could be utilized to develop new flexible and soft sensor applications by means of material technology.
Export citation and abstract BibTeX RIS
1. Introduction
In recent decades polymer composite research has concentrated on studying two- and three-phase composite materials containing dielectric, ferroelectric, and/or conductive particles for electronic applications. The permittivity of these composites typically slowly increases as the filler content is increased [1, 2]. By increasing the filler content, the achieved permittivity is limited due to the desired flexibility of the polymer [3] when the required filler level is high. Besides filler content, permittivity is also dependent on the manufacturing method used to produce the material and particularly dependent on the size and shape of the filler particles [4]. The foregoing problems can be partly solved by introducing conductive particles into the composite material [1, 5]. Composite materials that include conductive particles can utilize the percolation theory in which the conductivity of the material is abruptly increased as the filler content approaches the percolation threshold [2, 6–8]. Percolative composite materials with conductive particles require a smaller filler content than polymer composites with a large ceramic filler content [9].
The typical applications for flexible composite materials are various pressure sensors based on piezoelectric, optical, magnetic, capacitive, or resistive principles [10–12]. In these, distortion and tension can be transformed into an electrically measured signal. A piezoelectric sensor generates a signal as the pressure changes, wherefore it is not usually possible to observe static loads. Static loads can, however, be sensed with resistive or capacitive sensors, while the capacitive measuring method has better resolution [10]. A piezoresistive sensing principle utilizes the change in resistivity as a material is exposed to mechanical force [10]. For example, in previous research polyurethane foams have been utilized to produce a resistive compressible pressure sensor [12].
Percolation is described as a powerful change in material properties as the filler content in the composite material is increased to a critical threshold. Due to the increased filler content, the particles come into contact with each other. An abrupt change in the conductivity of the material is a consequence of an insulator–conductor transition that occurs at a critical concentration level of the filler [13–15]. The transition at the percolation threshold can be visualized as a forming of polymer layers between the conductive particles, which creates multiple micro-capacitors [2, 8, 15, 16]. The dielectric losses of a percolative composite are difficult to control as the conductive particles create conductive paths in the composite as the concentration approaches the percolation threshold [5]. The percolation threshold depends on the fillers used, especially their shape and size. A reduction in the size of the filler increases the percolation threshold. The percolation threshold also depends on the conductivity of the filler as well as the distance between the conductive particles [13].
The rigidity of a typical composite material raises problems, for example, for adjusting the conductivity of the material as conductivity can only be controlled by changing the material's composition during the fabrication process [12]. Modification of the composition causes problems in the physical properties of the material that affect the flexibility of the fabricated sample. Flexibility enables the conductivity of the material to be adjusted by controlling the pressure, which makes the feature important. As the pressure increases, the randomly distributed conductive particles approach each other until the particles come into contact with each other, thereby increasing the conductivity of the material [12]. The particles return to their initial position as the pressure is released. This mechanism can be exploited to adjust the electrical conductivity of the material by controlling the pressure.
The room-temperature process of the foam allows 80 wt% addition of lead zirconate titanate (PZT). This addition to PUR foam increases its dielectric permittivity and, more fundamentally, increases the change in permittivity as the foam is pressed between plates. The hypothesis is to increase the relative permittivity of fabricated three- and four-phase foams by adding PZT and graphite particles to the foam. This will also affect the mechanical properties of the foam.
This paper introduces novel foam form composites based on two to four phases with polyurethane (PUR) as a matrix that includes air acting as one phase, and ferroelectric PZT and/or conductive graphite (C) as fillers. The effects of different loading levels of PZT and C on the dielectric, capacitive, and resistive properties of the fabricated samples as well as a PUR reference sample containing pure air were studied at 1 kHz. Furthermore, a system enabling simultaneous compression and measurement of the electrical properties was developed and the achieved results are discussed.
2. Experimental procedure
2.1. Preparation of the composite foams
The chemicals for the flexible polyurethane (PUR) foam composite were purchased from Vosschemie Benelux (Germany). Component A includes polyether polyol and component B, 4.4'-diphenylmethane diisocyanate.
PZT powder from Meggit Sensing Systems (Denmark, Ferroperm Piezoceramics catalogue) was chosen due to its high relative permittivity (εr = 2900 at 1 kHz) as a bulk material and its grain size (1–5 μm) suitable for the foaming process. The dielectric loss for PZ29 is relatively low at 1 kHz (tan δ = 0.019). In addition, the TIMREX SFG75-group graphite powder (TIMCAL, Switzerland) with a grain size of 75 μm that was used was chosen since it has very high electrical conductivity (1335 S m−1) and excellent compressibility.
The PUR foam was prepared by mixing component A with PZT and/or C until the mixture had dispersed evenly. In the case of four-phase composite foams (PUR, air, PZT, and C), the conductive additive was added before PZT. Component B was added thereafter under continuous mixing for 20 s. The mixture was prepared in an 8.5 cm high and 6.5 cm diameter plastic mold where the foaming process was completed. The foam was left in the mold for over 60 min at room temperature before further use. The bottom of the plastic mold was cut off to ensure the quality of the samples, after which they were cut into 2–3 foam samples (30 × 30 mm2) with different thicknesses from 9 to 13 mm. As a reference, a pure PUR sample with air was prepared similarly by mixing components A and B. Thus, samples with two phases (PUR with foam and air), three phases (PUR + PZT or PUR + C), and four phases (PUR + PZT + C) were analyzed.
In the three-phase composite foams the amount of PZT additions were 20, 40, 50, 60, 70, and 80 wt% and C additions were 1, 2.5, 5, 10, and 15 wt%. The mixing ratios of the three-phase composites are shown in table 1, where the related volume percentages are also shown through the mass and density calculations of the starting materials.
Table 1. Mixing ratios of the three-phase composite foams.
| Total mass (g) | wt% of PZT | wt% of graphite (g) | Mass of PZT (g) | Mass of graphite (g) | Vol% of PZT | Vol% of graphite |
|---|---|---|---|---|---|---|
| 20 | 20 | 0 | 4 | 0 | 3.4 | 0 |
| 26.67 | 40 | 0 | 10.67 | 0 | 8.7 | 0 |
| 32 | 50 | 0 | 16 | 0 | 12.5 | 0 |
| 40 | 60 | 0 | 24 | 0 | 17.6 | 0 |
| 53.33 | 70 | 0 | 37.33 | 0 | 24.9 | 0 |
| 80 | 80 | 0 | 64 | 0 | 36.3 | 0 |
| 16.16 | 0 | 1 | 0 | 0.16 | 0 | 0.6 |
| 16.41 | 0 | 2.5 | 0 | 0.41 | 0 | 1.1 |
| 16.84 | 0 | 5 | 0 | 0.84 | 0 | 2.8 |
| 17.78 | 0 | 10 | 0 | 1.78 | 0 | 5.8 |
| 18.82 | 0 | 15 | 0 | 2.82 | 0 | 9 |
In the four-phase composite foams the amounts of PZT and C were 40 wt% and 1, 2, 5, 10, and 15 wt%, respectively (table 2). The PUR mixing ratio, 100 mass parts of component A and 35 mass parts of component B, was kept the same in the three- and four-phase composites. The total mass of the PUR foam components was kept at 16 g while the mass of component A was 11.85 g and the mass of component B was 4.15 g.
Table 2. Mixing ratios of the four-phase composite foams.
| Total mass (g) | wt% of PZT | wt% of graphite (g) | Mass of PZT (g) | Mass of graphite (g) | Vol% of PZT | Vol% of graphite |
|---|---|---|---|---|---|---|
| 27.12 | 40 | 1 | 10.85 | 0.27 | 8.7 | 0.9 |
| 27.59 | 40 | 2 | 11.04 | 0.55 | 8.8 | 1.7 |
| 29.09 | 40 | 5 | 11.64 | 1.45 | 9 | 4.4 |
| 32 | 40 | 10 | 12.80 | 3.20 | 9.3 | 9.1 |
| 35.56 | 40 | 15 | 14.22 | 5.33 | 9.6 | 14.2 |
2.2. Electrical characterization
The dielectric properties of the composite foams were measured using an HP 4284A Precision LCR meter at 1 kHz and an amplitude of 1 V at room temperature. The LCR meter was connected to the measurement head with coaxial cables. The dielectric measurements are based on the theory of an ideal parallel-plate-capacitor structure where a material is placed between two electrically conductive plates to measure the capacitance and conductivity of the sample [17]. The 30 × 30 mm2 foam samples were compressed between one round and one square electrode with a radius of 25 mm and a width of 30 mm, respectively. The main reason for this was that the sample is easier to adjust evenly between the plates if the bottom plate is larger. Also, the different shapes of the top and bottom plates facilitated the adjustment even more.
The resistance of the foams was measured using an Agilent 34401A Digital Multimeter with a measurement range of 0–100 MΩ and a resolution of 100 μΩ. The electrical conductivity of the foams was measured using a Keysight B2985A High Resistance Meter, which offered a broader measurement range than the Agilent multimeter. The resistance measurement range in this case was 10 PΩ.
2.3. Measurement head for simultaneous measurement of compressibility and electrical properties
The measurement system for the soft foams was comprised of a rectangular stand built from plywood with a micrometer screw fitted to the top of the measurement stand. At the head of the micrometer screw was a hollow plastic cylinder to which the top electrode plate (radius 25 mm) was affixed. The 30 mm wide square electrode plate was attached to the bottom of the rectangular stand. The measurement head could be moved downwards and upwards by gradually turning the micrometer screw.
Different levels of compression were achieved accurately in the foam samples by changing the position of the micrometer screw. The purpose of the measurement head was to ensure repeatability and to simplify interpretation of the results. A similar method has been used earlier for pressure-dependent measurement of PUR foams with graphene layers [12].
2.4. Measurement head calibration
The measurement head was calibrated by measuring the distance between the top and bottom electrodes after which the results were compared with a change in the measurement scale of the micrometer screw. To ensure accurate calibration, the thickness of the electrode plates was measured as well as the reference level of the minimal distance between the plates. The dielectric measurements were done by increasing the compression in the foam samples by turning the screw one full round, reducing the distance between the electrode plates by 0.5 mm.
After calibrating the distance between the electrode plates to the measurement head scale, capacitance was measured while there was no material between the plates. The measured capacitances were plotted as a function of the distance between the plates and the results were compared with the ideal parallel-plate-capacitor values calculated at a specific plate distance when there was only air between. The difference between the two measurements was considered an error component. The error component contained measurement errors as well as an error due to a fringing effect, because the dimensions of the measurement head were not ideal [17]. For an ideal parallel-plate-capacitor setup the error due to fringing effects was considered to be zero. The restrictions of dielectric measurement using a parallel-plate-capacitor have been studied earlier and it has been confirmed that problems occur when the distance between the plates is large compared to the dimensions of the plates [18–20].
The calculated error between the real and ideal values was extracted directly from the measured capacitance values as well as from the calculated relative permittivity. The relative permittivity, εr, was calculated from the capacitance, C, measured with an HP 4284A Precision LCR meter, using equation (1) where ε0 is permittivity in a vacuum, and d and A are the distance between the electrodes and their effective size, respectively

It was confirmed that the material between the plates had no influence on the calculated error component. However, it was noticed that the shape and size of the material altered the value of the error component due to the fringing effect. The change in the error component due to the fringing effect can be roughly estimated, e.g., by measuring three samples: one smaller and one larger than the plates and one of equal size. The change in the error component can then be estimated by comparing the measured capacitance values and the dimensions of the samples.
3. Results and discussion
3.1. Polyurethane–PZT composite foams
The relative permittivities of the foam samples were measured as a function of the compression ratio. Figure 1 shows (a) capacitance, (b) resistance, (c) relative permittivity, and (d) dielectric losses as a function of the plate distance to the original thickness of the pure PUR and PUR + PZT foam samples, which varied from 9 to 12 mm. The ratios of the sample thicknesses in a compressed state to the original thickness of the samples were calculated as

where x is the distance between parallel plates and d is the original thickness of the sample. The measurement results in figure 1(a) show that the capacitance of the pure PUR sample as well as the samples with 40, 50, and 60 wt% PZT loading increased strongly as the compression ratio decreased. Additionally, it is clear that although the addition of PZT itself increased permittivity, its influence on capacitance was more significant under compression. The increases in capacitance for 40, 50, 60, 70, and 80 wt% PZT-loaded foams were 2060, 1010, 2090, 350, and 180%, respectively (ratios 0.14–0.20 and 0.45–0.64). As the proportion of PZT increased further to 70–80 wt%, the high-level compressibility was lost. Figure 1(c) shows a plateau for 80 wt% PZT-loaded foam as the compression increased, which might indicate a drop in relative permittivity if the compression caused by the measurement system could be increased. Possibly, due to the porosity of the sample, the PUR cell walls lock the pore in space as compression increases over a critical point [11].
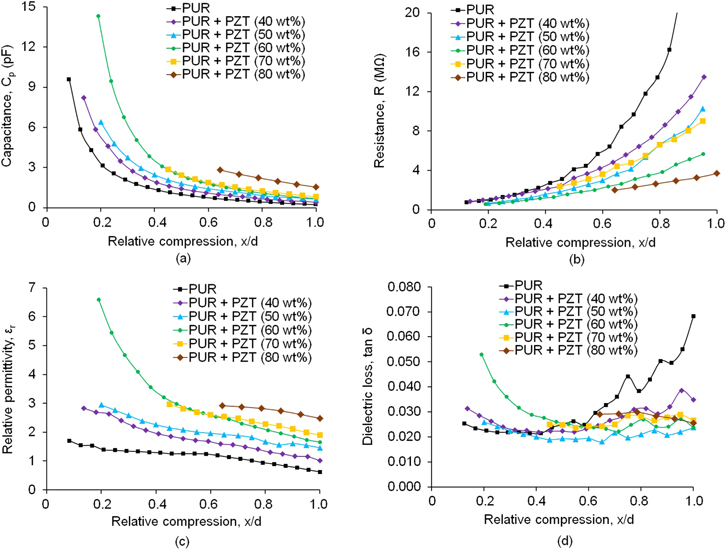
Figure 1. Measured three-phase PZT-loaded composite foam samples and the reference PUR sample at 1 kHz frequency and 1 V amplitude, (a) capacitance (Cp), (b) resistance (R), (c) relative permittivity (εr), and (d) dielectric loss (tanδ).
Download figure:
Standard image High-resolution imageInterestingly, at lower loading levels relative permittivity as a function of compression behaved differently than capacitance. With 40–50 wt% addition of PZT, permittivity did not show a prominent increase at higher compression levels, being in line with the pure PUR sample, but with 60 wt% loading it increased rapidly when the compression ratio was decreased to 0.19. Thus, at lower loading levels the main increase in capacitance was caused by the smaller gap between the electrodes, but with 60 wt% loading the main reason was the increase in permittivity due to the closer connectivity of the PZT particles. The relative permittivities were 2.83, 2.94, 6.59, 2.96, and 2.92, respectively, for 40, 50, 60, 70, and 80% PZT-loaded foams. The increases in relative permittivity for the same foams were 280, 200, 400, 160, and 120%, respectively (ratios 0.14–0.20 and 0.45–0.64).
Figure 1(b) shows that the addition of PZT decreased resistance and there was a clear response to increased compression except for the PUR + PZT 80 wt% foam. All these composites approached the same low resistance value, meaning that even though at 60 wt% PZT addition the connectivity of the particles increased with higher compression, it did not effect resistance due to their non-conductivity.
The addition of PZT also decreased the dielectric loss of the foam composites (figure 1(d)). With compression tanδ first started to decrease when the air came out of the microstructure, but increased again especially in the sample with 60 wt% loading of PZT. This is well in line with the observation of the behavior of permittivity under compression. Thus, when the connectivity of the PZT particles increased, the loss of the piezoelectric phase also became more dominant. The reason why tanδ values as high as 0.053 were measured in the foam sample with 60 wt% loading of PZT at a compression ratio of 0.19 could presumably be explained by the surface interaction of the particles. The tan δ values of the foams in figure 1(d) were between 0.025 and 0.053.
3.2. Polyurethane–graphite composite foams
Figures 2(a)–(d) show the dielectric properties of the three-phase foam samples with 1–10 wt% loading of C. Due to the excellent flexibility of the fabricated graphite samples, a compression level as high as 0.1 could be reached.
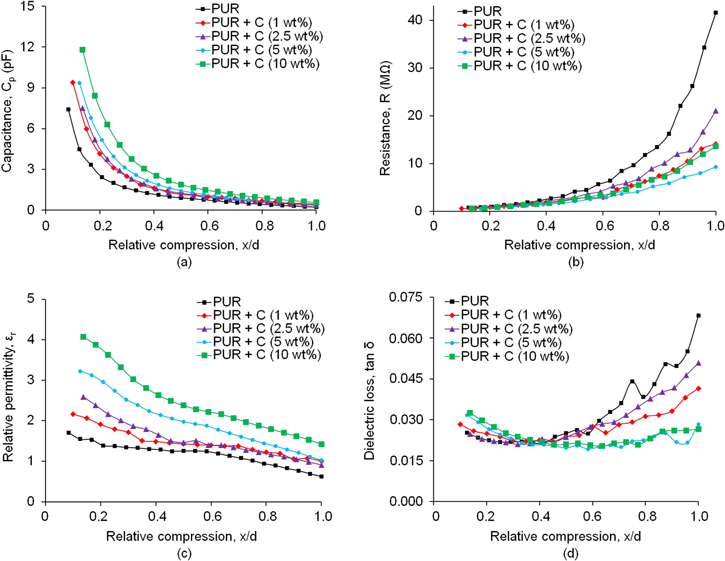
Figure 2. Measured three-phase graphite-loaded composite foam samples and the reference PUR sample at 1 kHz frequency and 1 V amplitude, (a) capacitance (Cp), (b) resistance (R), (c) relative permittivity (εr), and (d) dielectric loss (tanδ).
Download figure:
Standard image High-resolution imageIn figure 2(a) the changes in the capacitances were 2150, 2010, 2520, and 2010%, respectively for three-phase 1, 2.5, 5, and 10 wt% graphite-loaded foams at maximum compression when the relative compression ratios varied from 0.14 to 0.08. At this state the samples were compressed 87%–90% from the uncompressed initial state. The increases in capacitances were moderate compared with the pure PUR foam (3200% at a ratio of 0.08), which was due to the low measured initial value while the PUR foam was uncompressed and the very high flexibility of the sample. The largest changes in capacitances were measured in 1 and 5 wt% graphite foams under compression. DC resistance measurements indicated that all the graphite foams for 1, 2, 5, and 10 wt% graphite loadings were highly resistive under compression. The results were verified with an Agilent multimeter, but due to the limited measuring range of 1 M the meter was unable to measure the resistance values of the samples, meaning that with these loading levels the connectivity of the graphite particles did not percolate and cause increased conductivity.
Figure 2(c) shows that the addition of graphite itself also increased the relative permittivity of the PUR. Under compression the change in the relative permittivity was almost identical as the graphite loading increased gradually from 1 to 10 wt% when comparing measurement points while the ratio decreased from 1.0 to less than 0.2. Also, the increase in the relative permittivity level due to compression was nearly steady regardless of the graphite loading, which is interesting. The relative permittivities of 1, 2, 5, and 10 wt% graphite-loaded foams at maximum compression were 2.16, 2.59, 3.23, and 4.07, respectively (ratio 0.10–0.14). The increases in relative permittivity due to compression in these foams were 190, 210, 290, 330, and 290% at the same compression ratio. The dielectric losses under compression were quite low, 0.025–0.033. The results indicate that the losses decreased while the compression increased to a certain extent, after which the losses increased slightly when the compression was further increased. The behavior of permittivity and loss under pressure shows that the graphite particles did not reach the percolation threshold.
3.3. Polyurethane–PZT–graphite composite foams
The results in figures 3(a)–(d) show the electrical properties of the four-phase foam samples after PZT loading was increased to 40 wt%. The capacitance values changed 3800, 2800, 2380, and 2100% with 1, 2, 5, and 10 wt% addition of graphite, respectively, at maximum compression (ratios 0.12–0.15). The maximum capacitance value in the compressed state increased compared with the three-phase foam materials, as expected.
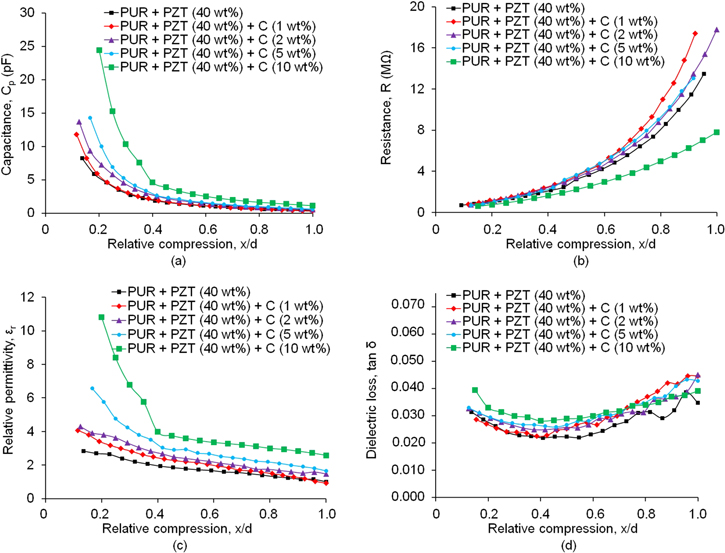
Figure 3. Measured four-phase 40 wt% PZT-loaded composite foam samples at 1 kHz frequency and 1 V amplitude, (a) capacitance (Cp), (b) resistance (R), (c) relative permittivity (εr), and (d) dielectric loss (tanδ).
Download figure:
Standard image High-resolution imageAt ratios between 0.12 and 0.15 the capacitance value varied from 11.8 to 23.5 pF as PZT loading was increased. The largest values of capacitance under compression can be seen at high graphite loadings when the amount of graphite was at least 5 wt%. However, as stated earlier, the high initial value affects the change in capacitance at higher loading levels. Compared with the other compositions, only PUR + PZT 40 wt% + C 10 wt% foam had switch-like behavior in capacitance at the critical compression ratio of 0.4. After this, the capacitance of the foam increased very rapidly with compression. Figure 3(b) shows that the resistance values were even more clustered in the full range of the x-axis than with three-phase foam compositions. The only exception was the 10 wt% graphite-loaded sample, which had significantly lower resistance values at compression ratios over 0.5.
In figure 3(c) relative permittivity changed more abruptly in the compressed state when graphite loading was at least 5 wt%. The relative permittivity of the foams with 40 wt% PZT loading containing 1, 2, 5, and 10 wt% graphite were 4.1, 4.2, 6.6, and 10.8, respectively (ratios 0.12–0.15). In these foams the changes in relative permittivity at the same compression ratios were 440, 290, 400, and 420%, respectively. The tanδ values of these foams were between 0.031 and 0.039 while the compression ratio was over 0.2. The values of dielectric losses increased slightly at high compression when the ratio was over 0.3 and the dielectric losses were higher compared with the three-phase foams. The outcomes of both results were expected according to the mutual interaction of graphite and PZT at high loading and compression levels.
3.4. Composite foams with high loading of graphite additives
Figures 4(a)–(d) show the electrical properties of the three- and four-phase composite foams with high loading of graphite (15 wt%). Due to the very high relative mechanical stiffness of the four-phase 60 wt% PZT loading sample, the measurement system was unable to compress the foam enough to interpret the results.
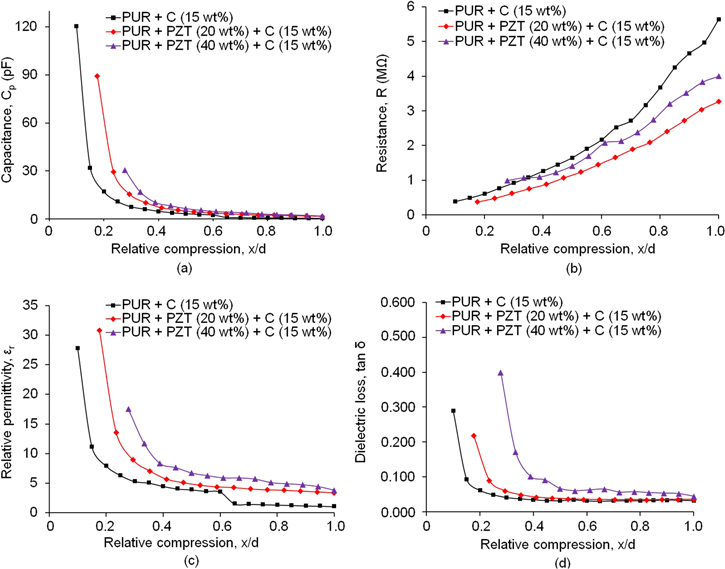
Figure 4. Measured 15 wt% graphite-loaded foam samples at 1 kHz frequency and 1 V amplitude, (a) capacitance (Cp), (b) resistance (R), (c) relative permittivity (εr), and (d) dielectric loss (tanδ).
Download figure:
Standard image High-resolution imageThe measurement results for capacitance in figure 4(a) show that capacitance changed rapidly at low compression ratios (<0.3). Under maximum compression the capacitance values of PUR + C 15 wt%, PUR + PZT 20 wt% + C 15 wt%, and PUR + PZT 40 wt% + C 15 wt% foams were 120, 91, and 31 pF, respectively (ratios 0.10–0.28). Compared with the measured results with lower graphite loadings (5–25 pF), the achieved results are very high. The increases in the capacitance of these foams were 11 050%, 5270%, and 1690%, respectively, at maximum compression. The softness of the sample and the low initial value of capacitance in the uncompressed state made the PUR + C 15 wt% foam values superior to the other composition alternatives. Due to its conductive nature, the large amount of added graphite also significantly decreased the resistance of the composites, figure 4(b). This is especially clear if the resistance of the PUR + C (15 wt%) is compared with the values achieved for the three-phase composites with a much smaller addition of graphite, figure 2(b).
Relative permittivity and dielectric loss, figures 4(c) and (d), were in strong correlation when the compression ratio decreased from 1.0 to less than 0.2. The relative permittivities of these foams were 27.7, 30.8, and 17.5 and the increases were 2690%, 920%, and 460%, respectively (ratios 0.10–0.28). The dielectric losses of the foams were extremely high compared with the three- and four-phase composite foams with 1–10 wt% graphite loading. Thus, tanδ was 0.29, 0.22, and 0.4 and the increases were 960, 610, and 890%, respectively (ratios 0.10–0.28).
The measurement results suggest that the conductivity of the foams was increased. The measured DC resistances of these foams in the uncompressed state were 1 TΩ, 385 GΩ, and 230 GΩ. Compression decreased the resistance values to 19 GΩ, 11 GΩ, and 1.8 GΩ, respectively, at maximum compression (ratios 0.10–0.28). The resistance changes in these foams under the same compression were 5260%, 3500%, and 12 560%, respectively. As the amount of graphite increased to 30 wt%, the resistance of the foam decreased by many orders of magnitude compared with foam with graphite loading of 20 wt%. The foam approached the percolation threshold of three-phase PUR + C foam. Thus, the resistance of the material was very low with the measured composition (460 Ω).
The PZT and graphite loadings have a great impact on the change in conductivity under compression. The combination of both materials further increased the conductivity of the foam, which affected the dielectric properties positively. As the distance between the conductive particles decreases, the conductive particles were close enough to be in contact with each other and/or with PZT particles. The contact between the particles created conducting paths inside the material, increasing its conductivity when the amount of filler was close to the percolation threshold. The increases PZT and graphite loadings decreases the percolation threshold of the material with both additions compared with three-phase-PZT or graphite-loaded foams. The high PZT loading samples needed less graphite to reach the four-phase percolation threshold.
The conductivity mechanism of polymer foam results from compression deformation under pressure. The polymer foams exhibits stress–strain behavior that can be divided into linear elasticity, plateau and densification regions. Each region exhibits some form of deformation. At linear elasticity region the behavior of the foams, open-cell, is controlled by bending of the cell walls. At this state, compressive force increases approximately linearly with applied pressure. The linear elasticity is followed by a long collapse plateau where stresses do not vary much. The plateau for the polymer foams is defined by elastic buckling which occurs at moderate strains. Elastic buckling induces collapsing of the cells walls. When strain is further increased the solid itself is compressed. Then, stress increases rapidly and dramatic stiffening occurs, referred as densification. At this point most of the porosity of the foam has been squeezed out as the air is expelled out the structure through interconnected cells. In densification region, squeezing of pores becomes difficult because cells are crushed together and further bending or buckling is not possible [11, 21]. Thus, the mechanical and electrical properties of the foam are related to complex microstructure. Also, factors such as specimen and cell size, important for the open-cell foams, should be considered as they have influence on material behaviour and air-flow properties of the foams, respectively.
In simplicity, electrical resistance of foam can be thought as function of density of the foam since greater density leads to smaller distance between the particles and less void space between the cell walls. As the compression in the foam is increased, its conductivity and dielectric properties increases significantly due to reduced porosity of the foam. Thus, distance between the particles reduces as the cell walls are being compressed. Because of this, number of electrical paths increases which is highly correlated to the conductivity of the foams. The conductivity for open-cell foam should be the highest at densification stage as the cells may be entirely crushed while opposing cell walls are in contact. However, in reality other factors e.g. microstructure and morphology of particles affects the conductivity of the foams. Thus, it becomes complex and sum of multiple variables.
3.5. Observed combined effects of PZT and graphite
The relationship between and combined effects of the PZT and graphite were studied by comparing the measured foam samples at a specific compression ratio. But then the loading level of these components varied. The chosen compression ratio was 0.25 due to the fact that some samples were unable to compress more than 75% from their original thickness.
The relative permittivities and dielectric losses of the three- and four-phase composite foam samples can be seen in figures 5(a)–(c). The effects of increasing PZT loading at a constant compression ratio can be seen from figure 5(a). The increase in relative permittivity was the lowest at the middle loadings when the amount of PZT varied from 20 to 40 wt%. As the amount of PZT loading increased over 40 wt%, the change in relative permittivity was significant compared with the other loading levels. At lower PZT loading levels the dielectric losses changed slowly as a function of the loading level. However, at 40–60 wt% PZT loading the losses increased rapidly due to the increased addition of PZT.
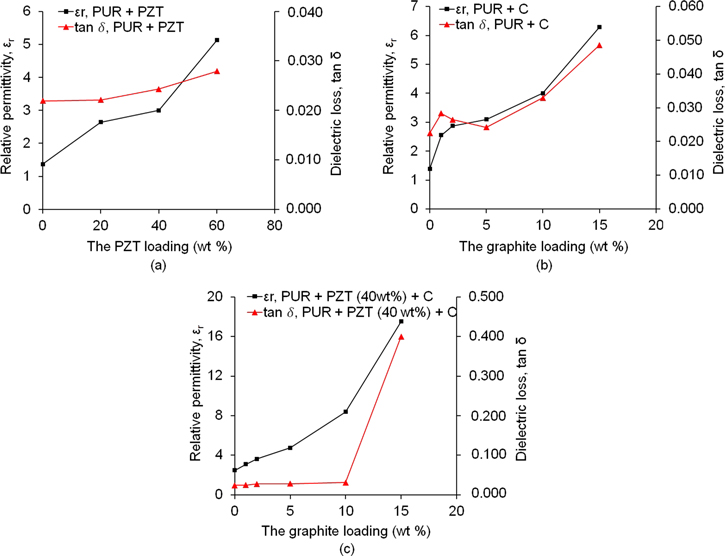
Figure 5. Measured relative permittivities and losses at the specific ratio of 0.25 as a function of PZT loading (a) and graphite loadings (b), (c).
Download figure:
Standard image High-resolution imageFigure 5(b) shows that graphite loading increases relative permittivity more intensively when graphite loading is below 2 wt% or over 10 wt%. Nevertheless relative permittivity and losses both increased in the whole curve of the line despite the amount of graphite. The change that occurred at high loading levels of graphite was more abrupt as the amount of graphite increased over 15 wt% towards the percolation threshold of the three-phase composite material. The graphical similarity of the whole curves of the lines in PZT and graphite loadings can be seen in figures 5(a) and (b). The change in relative permittivity was similar when comparing PZT loading increase from 20 to 60 wt% with graphite loading increase from 5 to 15 wt%.
The conductivity of the samples was observed to affect the measured dielectric properties under high compression ratios. The increase in relative permittivity was larger when the PZT additives were added to the mixture, as seen by comparing figures 5(b) and (c).
Figure 5(c) shows that as PZT loading increased to 40 wt%, relative permittivity increased almost linearly when the amount of graphite increased between 1 to 10 wt%. By increasing the amount of PZT the change at these graphite loading levels was more intense when compared with less PZT loading (20 wt%). The graphite now had a stronger effect on the dielectric properties of the foam while PZT loading was higher due to the increased combined effect of the PZT and graphite. The conductivity of the samples was observed to affect the measured dielectric properties under high compression ratios. The increase in relative permittivity was larger when the PZT additives were added to the mixture, as seen by comparing figures 5(b) and (c).
The increase in graphite loading between 5 and 15 wt% does not entirely explain the increase in the relative permittivity of the four-phase composites when the amount of PZT was kept constant between the samples. The graphite addition in the three-phase composites increased relative permittivity from 3 to 4 and from 4 to 6.3 when the amount of graphite increased from 5 to 10 wt% and from 10 to 15 wt%, respectively. However, in the four-phase composites the change in relative permittivity was larger at both loading levels. The electrical properties changed more in the four-phase composites than the results from the three-phase composite foams would suggest. The analysis of the results regarding the combined effects would be very difficult if the compression ratios and PZT and/or graphite loadings were varied simultaneously. Also important to note, the combined effects are very hard to observe at low graphite loadings, despite the PZT loading levels, due to variation between the fabricated foam samples.
3.6. Particle addition effects to structural and mechanical properties of foam
Optical imaging was done to the foam samples to investigate particle additions effects to investigate if the addition of PZT or graphite affects the foaming process, structural and/or mechanical properties of the foams. Also, mechanical properties such as Young's modulus and maximum strain before breaking were measured by using Linkam TST350 Tensile Stress Testing system with 200 N force transducer.
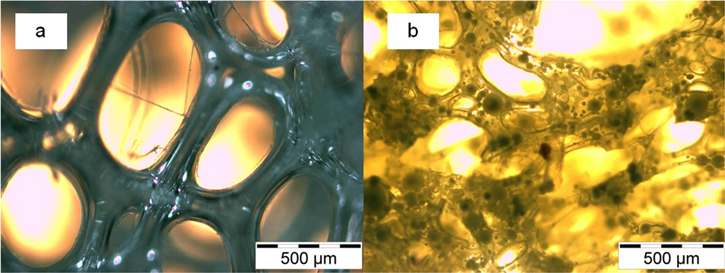
Figures 6(a) and (b) shows particle addition effects of PZT to structural properties of the polyurethane foam. As seen, the cell size is also highly heterogeneous with PUR foam figure 6(a) while in PUR + PZT 50 wt% foam, in figure 6(b), the PZT particles have been buried inside the cell walls. As the particles are added to the polyurethane matrix, the thickness of cell walls increases significantly. Thus, it was highly correlated to the loading level of PZT and/or C. Increase in loading level increased the thickness of walls with all compositions of the foams (tables 1 and 2).
Figure 6. Optical microscopy images of particle additions effects to structural properties: (a) PUR- and (b) PUR + PZT 50 wt% foams.
Download figure:
Standard image High-resolution image
It was also observed, that after the foaming process, the thickness of the walls increased as the foam solidifies. However, due to addition of the particles, the cell walls become more brittle which eventually induces fractures to the cell walls and irregular formation of the cells. Thus, heterogeneity of the cell size of PUR + PZT 50 wt% foam increases compared to the PUR foam. The cell walls are extremely fragile as PZT loading reaches level of 70–80 wt% because there is not enough polymer filling between the PZT particles. These thin structures may mechanically break causing polymer foam to lose its elasticity. Due to constricted area of observation with optical imaging and large variation of pore size, it was not possibly accurately define or estimate the pore size of the foams.
Table 3 shows measured mechanical properties e.g. Young's modulus and maximum strain before breaking for all foam compositions with PUR as reference foam. Young's modulus for PUR foam was 0.0717 × 10⁻³ GPa while maximum strain before breaking was approximately 144% of the original length of the foam sample. Addition of PZT particles increased Young's modulus approximately by 1280% when PZT loading increased from 20 to 80 wt%. Simultaneously, the maximum strain before breaking decreased rapidly as PZT loading approached 80 wt%. Total decrease in the maximum real strain before breaking was 88%. Increase in loading of graphite affected quite similarly to Young's modulus and the maximum strain before breaking. However, Young's modulus increased by 73% while the maximum real strain before breaking decreased only by 28%. Thus, addition of PZT particles increased Young's modulus significantly better than addition of graphite particles but then, decrease in the maximum real strain before breaking was greater with addition of PZT particles. For four phase foam composites, the addition of graphite increases Young's modulus in all cases compared to three phase PUR + PZT 40 wt% foam. The effect of addition of graphite was similar to three phase PUR + C foams. Therefore, increase in Young's modulus was only seen when graphite loading was at 15 wt% when comparing Young's modulus of four phase foams to each other. Better results from testing of Young's modulus and the maximum strain before breaking of the foams could be achieved by increasing size of the foam samples, using more optimal testing equipment and by taking the observed values as mean of at least five samples. In addition, the heterogeneity of foam samples, as seen in figure 6, produces variation to samples which affects interpretation of the results in table 3 and should be taken into account.
Table 3. Young's modulus and maximum strain before breaking.
| Composition of foam (wt%) | Young's modulus (10−3 GPa) | Maximum strain (%) | Maximum real strain | Thickness (mm) | Width (mm) | Length (mm) |
|---|---|---|---|---|---|---|
| PUR | 0.0717 | 144.38 | 0.7269 | 4.08 | 11 | 29 |
| PUR + C1 | 0.0903 | 163.77 | 0.8245 | 3.25 | 10 | 29 |
| PUR + C2 | 0.1023 | 168.01 | 0.8459 | 4.15 | 11 | 29 |
| PUR + C5 | 0.0941 | 138.90 | 0.6993 | 3.31 | 12 | 29 |
| PUR + C10 | 0.1025 | 109.86 | 0.5531 | 3.01 | 11 | 29 |
| PUR + C15 | 0.1562 | 117.81 | 0.5931 | 3.04 | 10 | 29 |
| PUR + PZT20 | 0.0921 | 130.00 | 0.6327 | 0.29 | 12 | 30 |
| PUR + PZT40 | 0.0610 | 94.93 | 0.4331 | 3.65 | 11 | 32 |
| PUR + PZT50 | 0.16 61 | 96.30 | 0.4848 | 3.31 | 10 | 29 |
| PUR + PZT60 | 0.1766 | 109.52 | 0.4845 | 4.11 | 9 | 33 |
| PUR + PZT70 | 0.2185 | 79.32 | 0.3993 | 2.70 | 9 | 29 |
| PUR + PZT80 | 1.2728 | 15.62 | 0.0765 | 3.43 | 6 | 29 |
| PUR + PZT40 + C1 | 0.1367 | 69.66 | 0.3737 | 3.70 | 12 | 27 |
| PUR + PZT40 + C2 | 0.0940 | 97.05 | 0.4886 | 3.39 | 11 | 29 |
| PUR + PZT40 + C5 | 0.1258 | 104.79 | 0.5276 | 4.04 | 12 | 29 |
| PUR + PZT40 + C10 | 0.0868 | 43.77 | 0.2458 | 3.60 | 10 | 26 |
| PUR + PZT40 + C15 | 0.1999 | 78.29 | 0.3921 | 3.05 | 9 | 29 |
4. Conclusions
The change in effective permittivity as a function of relative compression was studied with polyurethane (PUR)-based foams. These foams were pure PUR with air as a second-phase component, and three- and four-phase composites with PZT and/or graphite additions. The dielectric properties of the foam samples depended on the size and shape of the samples as well as the amount of ferroelectric and conductive additives used. The results suggest that the change in capacitance is highly correlated with the softness of the fabricated foam. The compressibility of the foams is a very important property when the materials are used in sensing applications, as the changes in their dielectric properties under compression increase when the flexibility of the PUR is preserved. It was indicated that a combination of PZT and graphite has combined effects which increase the dielectric properties even further than was expected. The combined effects could be observed only at 5–15 wt% graphite loading levels due to variation during the fabrication process, which varied the properties of the samples too much when graphite loading was between 1 and 2 wt%. High graphite loading of 15 wt% combined with 40 wt% PZT loading showed potential for capacitive and resistive sensing applications where the sensing principle could be changed by mechanically compressing the foam to a critical point where its capacitance increases rapidly due to a vast change in the conductivity of the sample. The particle addition effects to structural and mechanical properties of the foams were seen as increase in cell wall thickness, cell size heterogeneity, structural fragility, and Young's modulus as loading level of PZT and/or graphite increased in three- and four phase foams. However, maximum strain before breaking decreased rapidly as loading of PZT increased over 70 wt% while addition of graphite had lesser effect. For further work, different conductive particles such as silver could be studied instead of graphite, and the effects of particle size on the electrical and mechanical properties of the composite materials could be investigated.
Acknowledgments
This study was supported by the Piling of Printed Intelligence project funded by the Finnish Agency for Technology and Innovation (TEKES) and the Tactile project supported by the Faculty of Information and Electrical Engineering of the University of Oulu.