

Abstract
Solid-state cooling technologies are considered as possible alternatives for vapor compression cooling systems. The elastocaloric cooling (whose caloric effects are driven by uniaxial stress) technology, as an efficient and clean solid-state cooling technology, is receiving a great deal of attention very recently. Herein, a NiTi-based elastocaloric bulk material was reported. A large coefficient-of-performance of the material (COPmater) of 4.5 was obtained, which was even higher than that of other NiTi bulk materials. The temperature changes (ΔT) increased with increasing applied strain (ε), and reached 18 K upon loading and −11 K upon unloading when the ε value increased to 4%. The high temperature changes were attributed to the large stress-induced entropy changes (the maximum ΔSσ value was 37 J kg−1 K−1). The temperature changes decreased with loading–unloading tensile cycles, and stabilized at 6.5 K upon loading and −6 K upon unloading after tens of mechanical cycles. The Ni50.8Ti49.2 shape memory alloy showed great promise for application in solid-state refrigeration (or as heat pumps).
Export citation and abstract BibTeX RIS
1. Introduction
Traditional vapor compression cooling technologies are facing more and more pressure because of their high global warming potentials, such as the common hydrofluorocarbon. Efficient and environmentally friendly solid-state cooling technologies, such as magnetocaloric [1–3], electrocaloric [4, 5], barocaloric [6–8], and elastocaloric cooling [9, 10], were considered as possible alternatives for vapor compression cooling systems. The magnetocaloric cooling, one representative of solid-state cooling technologies, has attracted much attention during the past decades [11, 12]. However, it has not yet been implemented in large-scale applications because the large driving magnetic field (several Tesla) is very expensive. Recently, the elastocaloric effect comparable to the magnetocaloric effect has been reported in some shape memory alloys (SMAs) [13–15]. Compared to magnetocaloric cooling, elastocaloric cooling (whose caloric effects are driven by uniaxial stress) has attracted much more attention because of its eco-friendliness, high coefficient-of-performance (COP), and moderate cost [16–18]. The elastocaloric cooling technique was assessed as the most promising non-vapor compression mechanical refrigeration system for the future by the US Department of Energy [19], and this opened up new routes for solid-state refrigeration.
The elastocaloric effect can be regarded as the entropy change under isothermal conditions (ΔSiso) or temperature change under adiabatic conditions (ΔTadi) when a mechanical stress is applied or released in a given material [18]. The COP is another important parameter of elastocaloric cooling technology, which describes the cooling efficiency and is defined by the ratio of cooling power (Q) to input work (W). Practically, the COP on the material level (COPmater) measures the cooling efficiency from the intrinsic material properties, and is a material performance metric to compare different elastocaloric materials. A detailed derivation of COPmater for elastocaloric materials was obtained under the reverse Stirling cycle and the reverse Brayton cycle [20]. For the convenience of estimation, the COPmater (= Q/W) was calculated by assuming that the materials undergo the specific cooling cycle with ideal system configuration, fully recoverable unloading energy, and no auxiliary power consumption [14, 15, 21]; the cooling power (Q) was estimated from the stress-induced transformation entropy change ΔSσ [15], and the input work (W) was calculated by integrating the area enclosed by the stress–strain curve [14, 15].
The elastocaloric effect was reported decades ago. However, those studies did not focus on the elastocaloric refrigeration, but rather on the origin of those thermal effects [16, 22, 23]. In 1992, Nikitin et al [24] published the elastocaloric effect associated with the anti-ferromagnetism–ferromagnetism transformation of latent heat, and measured a negative temperature change of −5.2 K (and indirectly, using the Clausius–Clapeyron equation, estimated a change of 8.7 K) in FeRh alloy, which showed potential for elastocaloric cooling applications. In 2008, the giant elastocaloric effect associated with the martensitic transition was reported in the CuZnAl SMA [25]. Since then, the elastocaloric effect has been widely investigated in NiTi (Cu) [9, 14], CuZnAl [13, 26], NiFeGa(Co), and NiMn-based SMAs [6, 27–29].
The NiTi-based elastocaloric materials showed wonderful potential applications in refrigerators (or heat pumps) due to their large temperature changes (ΔT) [9, 14]. In 2012, Cui et al [14] reported the elastocaloric effect of poly-crystalline NiTi wires at room temperature (295 K). For the tension cycle, the measured temperature change (ΔT) was 25.5 K upon loading and −17 K upon unloading with a COPmater value of 3.7. For the compression cycle, a higher COPmater of 11.8 was obtained assuming the cooling system, and could effectively use the unloading energy to run the cycle [14]. Since then, the elastocaloric effect of this alloy was studied deeply [30, 31]. Tusek et al [30] reported that the loading–unloading training cycles stabilized the superelastic behavior of NiTi wires, which ensured the reproducible elastocaloric effect. The maximum temperature changes of 25 K upon loading and −21 K upon unloading (at 322 K) were obtained for trained NiTi alloys with an applied strain of 6% [30]. Considering the micro-cooling applications of the elastocaloric materials, Bechtold et al [9] studied the elastocaloric property of TiNiCu films. The ΔT values of 4.1 K upon loading and −6.1 K upon unloading were measured for TiNiCu films with an applied strain of less than 2%. These ΔT values remained constant for up to more than 1500 loading–unloading cycles, showing a high cyclic stability of the elastocaloric effect [9]. Upon increasing the strain rate (0.2 s−1), a much decreased ΔT value of −16 K upon unloading was reported in TiNi films, together with an increased strain of 5.3%. The fast heat exchange between TiNi films and the environment brought great demands on thermal insulation to minimize parasitic heat flows and losses [32].
In fact, bulk elastocaloric materials would be more suitable for large-scale industrial applications in solid-state refrigeration. In this paper, we studied the influence of the applied strain on the elastocaloric effect in the Ni50.8Ti49.2 SMA at room temperature and below (267–293 K), together with the cyclic stability of the elastocaloric effect. A large COPmater of 4.5 was obtained, which was even higher than previous results reported in NiTi bulk materials [14]. High ΔT values of 18 K upon loading and −11 K upon unloading were measured, which could be attributed to the large stress-induced entropy change ΔSσ (37 J kg−1 K−1 at 267 K). The temperature changes decreased with loading–unloading tensile cycles, and stabilized at 6.5 K upon loading and −6 K upon unloading after tens of mechanical cycles [33, 34].
2. Experimental methods
The Ni50.8Ti49.2 bulks (manufactured by Xi'an Saite Metal Materials Development, Inc.) were used as the starting materials. The diameter of the tensile testing samples was 3 mm. The phase transformation temperatures and transformation entropy changes of the samples were determined by differential scanning calorimetry (DSC) measurements (DSC 204 F1, Netsch) in the temperature range of 150–300 K with a heating and cooling rate of 10 K min−1. The heat capacity (Cp) measurements were performed with the modulated DSC technique using a standard sample of sapphire with a well-known Cp. The gauge length of the specimen between the two grips was100 mm. Uniaxial tensile tests were conducted on a testing machine (100KN, SUNS) in a temperature range of 267–293 K. The material testing system was equipped with a cryogenic furnace. The stress–strain curves at different temperatures were recorded at a low strain rate of 1 × 10⁻⁴ s−1 to ensure the isothermal condition. For elastocaloric measurement, the sample was loaded at a much higher strain rate of 5 × 10³ s−1 (the maximum loading/unloading rate of the testing machine in the strain control mode), and then held for several minutes to make sure the specimen temperature returned to the original value. Subsequently, the sample was unloaded at the same strain rate until the preload was reached (about 1 N). The end position was also maintained for several minutes to allow for temperature equalization. A quicker unloading rate of 500 mm min−1 (the maximum loading/unloading rate of the testing machine in the displacement control mode) was also tried to approximately approach the adiabatic condition. All measurements were carried out in air without any thermal insulation. The temperature of the furnace was kept constant during the whole tensile cycle, and the temperature of the sample was continuously monitored. The temperature change during the loading, holding, and unloading processes was monitored by a platinum resistance thermometer attached on the middle position of the sample. To improve thermal contact, the platinum resistance thermometer was attached using silver paint, and firmly kept in place by Teflon tape. The output of the platinum resistance thermometer was read by a Keithley-2000 multimeter at a frequency of 2 Hz. The strain was measured by an electronic extensometer (YYU-10/50, Central Iron and Steel Research Institute, at room temperature; and 3542-025M-050-LT, Epsilon, at cryogenic temperature).
3. Results
3.1. DSC analysis of the Ni50.8Ti49.2 SMA
Figure 1 shows the DSC curves of the Ni50.8Ti49.2 SMA. An exothermic peak corresponding to the martensitic transformation (MT) during cooling and an endothermic peak corresponding to the reverse MT during heating could be clearly observed. The MT started (Ms) at 222 K and finished (Mf) at 192 K, and the austenitic transformation started (As) at 242 K and finished (Af) at 273 K. The measured heat capacity Cp was 424 J kg−1 K−1.
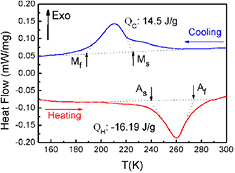
Figure 1. DSC curves of the Ni50.8Ti49.2 SMA.
Download figure:
Standard image High-resolution image3.2. Mechanical behavior of the Ni50.8Ti49.2 SMA at different strain levels
Figure 2 shows the stress–strain curves of the Ni50.8Ti49.2 SMA with different strain levels (0.5–4%) at 267 K. The tensile test was controlled by the strain mode with a low strain rate of 1 × 10⁻⁴ s−1 to satisfy the isothermal condition. The stress linearly increased with strain, corresponding to the elastic response of the austenite phase. Then, a relatively flat 'plateau' appeared in the stress–strain curves, which corresponded to the stress-induced MT, and was associated with the released latent heat. After the stress was released, the strain recovered, indicating the superelastic deformation. We also observed that the area of the stress hysteresis loops between the loading and unloading curves increased with the applied strain, showing that the fraction of the martensite phase increased with the applied strain. However, the residual strain was observed at higher strain levels and increased to about 0.5% when the applied strain increased to 4%, which could be attributed to the dislocations generated by the stress-induced MT and remnant martensite stabilized by dislocation strain field [35]. In order to measure the adiabatic temperature change, an increased strain rate of 5 × 10⁻³ s−1 was used in the tensile test (dashed curve shown in figure 2). It could be seen that the higher strain rate leads to increased stress hysteresis, which could be ascribed to the self-heating and self-cooling effects under the approximately adiabatic deformation condition [36]. Besides, the quick interface movement at the high strain rate limited the stress relaxation in the transformation fronts, and then enhanced the friction resistance against the interface movement [37]. This was also responsible for the increased stress hysteresis between loading and unloading curves. The larger hysteresis areas represented the more applied mechanical work assuming the work recovered during unloading [38].
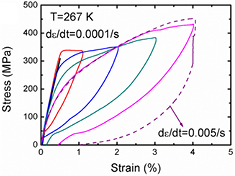
Figure 2. Stress–strain curves of Ni50.8Ti49.2 bulks at the approximately isothermal condition (with low strain rate of 1 × 10⁻⁴ s−1) with different strain levels of 0.5–4% at 267 K. The dashed line shows the stress–strain curve with a higher strain rate of 5 × 10⁻³ s−1.
Download figure:
Standard image High-resolution image3.3. The elastocaloric effect of the Ni50.8Ti49.2 SMA
As shown in figure 3(a), the measured ΔT values increased upon increasing the applied strain (ε) in the measured temperature range of 267–293 K, which could be attributed to the enhanced stress-induced MT. When the applied strain increased to 4% at 267 K, the ΔT values enhanced to 18 K upon loading due to the release of heat during the forward MT, and then reduced to −11 K upon unloading owing to the absorption of heat during reverse MT. In CuZnAl and NiFeGaCo alloys, the shape of the ΔT–T curve is a trapezium in a certain temperature range, showing the first-order MT elastocaloric effect [13, 15]. We observed platforms in the ΔT–T curves for different strains (1–4%), which was analogous to the trapezium in ΔT–T curves of CuZnAl and NiFeGaCo alloys. Therefore, the NiTi SMA was supposed to possess the first-order MT elastocaloric effect. Figure 3(b) shows the temperature changes of the Ni50.8Ti49.2 SMA under the applied strain of 1–5% at 267 K. The absolute value of ΔT increased with the applied strain, and then decreased when ε > 4%. The ΔT values showed the maximum value of 18 K upon loading and the minimum value of −11 K upon unloading at ε = 4%. Analogous behavior was also observed in the ΔT–strain curves at room temperature (figure 3(c)). Note that the ΔT values decreased with the applied strain, and then increased when ε > 5% upon unloading, which could be attributed to the increased residual martensite. As shown in figure 3(d), the strain recovered after the stress released, indicating the superelastic deformation. However, the residual strain increased with the applied strain and reached about 2.7% when ε = 7%, showing that increased remnant martensite was stabilized by dislocation. It is worth noting that the sample cracked during loading when the applied strain increased to 7%.
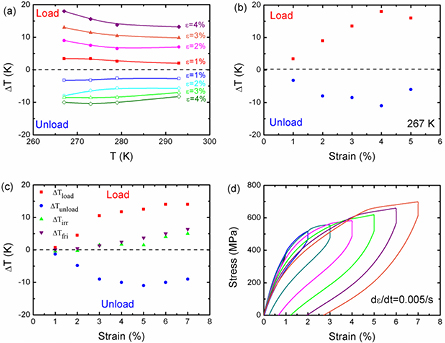
Figure 3. (a) The maximum ΔTmax values of the Ni50.8Ti49.2 SMA as a function of temperature with different strain levels of 1–4%. (b) The measured ΔT values of the Ni50.8Ti49.2 SMA as a function of the applied strain at 267 K. (c) The measured ΔT values of the Ni50.8Ti49.2 SMA as a function of the applied strain at room temperature. The green triangles and violet upside-down triangles are the elastocaloric irreversibility (ΔTirr) and estimated ΔTfri values, respectively. (d) Stress–strain curves with an unloading rate of 0.005 s−1 at room temperature.
Download figure:
Standard image High-resolution imageThe ΔT values upon loading were always higher than those upon unloading for each applied strain level in the measured temperature range, which indicated the elastocaloric irreversibility (ΔTirr = ΔTload − ΔTunload ≠ 0) between the forward and reverse MT. The friction dissipations were considered as the main sources of elastocaloric irreversibility, which always led to heating regardless of whether the MT was forward or reverse [32]. The elastocaloric irreversibilities derived from the friction dissipation (ΔTfri) could be estimated using the following equation based on the stress hysteresis area (Qhys) of the isothermal tests [30]:
Here, the density (ρ) is 6.63 g cm−3, and the specific heat (Cp) is measured as 424 J kg−1 K−1 for NiTi alloy. The irreversible entropy change (ΔSfri) is obtained from the stress hysteresis area of the stress–strain curves [30]. The calculated ΔTfri values are plotted in figure 3(c). They were consistent with the measured ΔTirr values, confirming that the friction dissipation contributed to the elastocaloric irreversibility.
The elastocaloric properties of NiTi alloys under different unloading rates at room temperature are shown in figure 4. The applied strain was 4%. For the two measured samples, the stress–strain curves showed little change, and the ΔT values decreased to −10 K ~ −8.5 K in about 35 s with an unloading rate of 5 × 10⁻³ s−1 (strain control mode). However, the ΔT values only decreased to −8.5 K ~ −8 K in 2.5 s–6 s when increasing the unloading rate of 200 mm min−1–500 mm min−1 (displacement control mode). The ΔT values showed no significant changes upon increasing the unloading rate. Therefore, the loading/unloading rate of 0.005 s−1 was a reasonable value in this work. In future work, a much quicker loading/unloading rate is needed to approach adiabatic conditions.
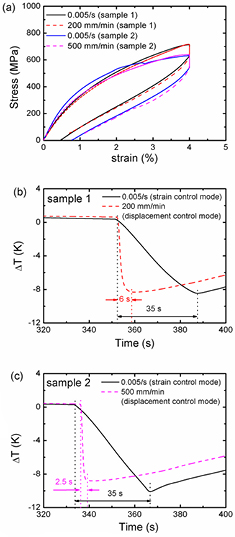
Figure 4. (a) Stress–strain curves with different unloading rates at room temperature. (b) The measured ΔT values with an unloading rate of 0.005 s−1 (strain control mode) and 200 mm min−1 (displacement control mode) for sample 1. (c) The measured ΔT values with an unloading rate of 0.005 s−1 (strain control mode) and 500 mm min−1 (displacement control mode) for sample 2.
Download figure:
Standard image High-resolution image3.4. Cyclic testing of elastocaloric effect
The elastocaloric measurements of the Ni50.8Ti49.2 SMA were recycled 100 times and suspended every ten cycles with a high strain rate of 5 × 10³ s−1. For each cycle, the sample was firstly loaded to the applied strain of 2%, followed by holding for about 5 min, and then unloaded to the preload (about 1 N) followed by further holding for about 5 min. The stress–strain curves of the sample are shown in figures 5(a)–(j). Analogous to the above stress–strain curves at the isothermal condition, the stress-induced MT took place during the first cycle (as suggested by the stress plateau at about 500 MPa). However, the residual strain of about 0.3% was observed after unloading, which could be attributed to a mass of dislocations generated by the stress-induced MT at a higher strain rate. Upon increasing the cycles, the residual strain, critical stress, and hysteresis area decreased. After 60 cycles, the stress-induced MT fully recovered. The dislocations and remnant martensite formed in the previous cycles produced internal stress during subsequent cycles, thereby leading to the decrease in critical stress. Furthermore, the initially formed dislocations and remnant martensite reduced the dissipation during the phase transformation, and suppressed the dislocation generation in subsequent cycles, which caused the full reversibility of the stress-induced MT [37].
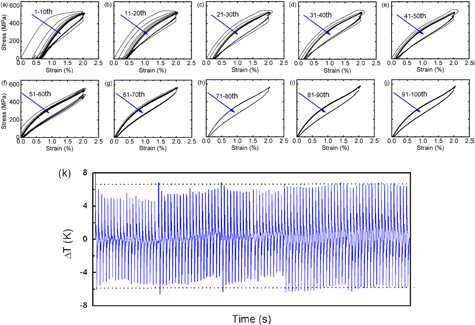
Figure 5. (a)–(j) Stress–strain curves of the 100 loading–unloading cycles. The tests were suspended every ten cycles with a high strain rate of 5 × 10³ s−1. (k) The measured ΔT as a function of time during the 100 loading–unloading cycles.
Download figure:
Standard image High-resolution imageThe temperature change increased to 8 K upon loading, and then decreased to −6 K upon unloading in the first cycle (as shown in figure 5(k)); this was consistent with the results presented in section 3.3. With increasing cycles, the absolute values of the temperature change gradually decreased. After 60 cycles, the ΔT values stabilized at about 6.5 K upon loading and −6 K upon unloading, showing that the elastocaloric effect of the Ni50.8Ti49.2 SMA reached a steady state after a certain number of mechanical cycles. Consistent with the above stress–strain curves, the decrease of temperature changes with increasing cycles was mainly attributed to the accumulation of dislocations. The initially formed dislocations and remnant martensite in turn suppressed the dislocation generation in the subsequent long-term cycles, which caused the stabilization of temperature changes.
4. Discussions
As mentioned above, the elastocaloric effect can be evaluated as the isothermal entropy change (ΔSiso) or adiabatic temperature change (ΔTadi). The stress-induced entropy change ΔSσ at the approximately isothermal condition (with a low strain rate of 1 × 10⁻⁴ s−1) was roughly regarded as the isothermal entropy change ΔSiso. According to the Clausius–Clapeyron equation, ΔSσ could be expressed as follows:

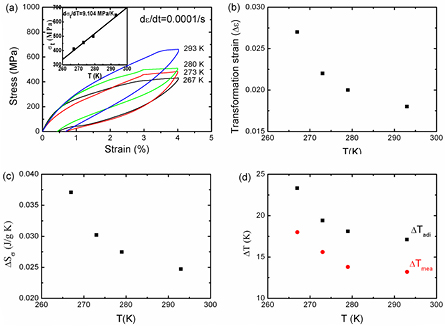
where ν0 is the specific volume of 1.508 × 10⁻⁴ m3 kg−1, Δε is the transformation strain, and σt is the critical stress for inducing MT at a given temperature. Based on the stress–strain curves of the Ni50.8Ti49.2 SMA at different temperatures (figure 6(a)), the critical transformation stress (σt) linearly increased with temperature with a slope of dσt/dT = 9.104 MPa K−1. The transformation strain (Δε) is shown in figure 6(b). The stress-induced entropy change (ΔSσ) was estimated, and is shown in figure 6(c). The ΔSσ values decreased with temperature, and showed a maximum value of 37 J kg−1 K−1.
Figure 6. (a) Stress–strain curves at different temperatures (267–293 K) with a low strain rate of 1 × 10⁻⁴ s−1. The inset shows the critical stress as a function of temperature. The slope of dσt/dT is 9.104 MPa K−1. (b) The transformation strain (Δε) as a function of temperature. (c) The stress-induced entropy change (ΔSσ) of the Ni50.8Ti49.2 SMA. (d) The estimated temperature change (ΔTadi) and measured temperature change (ΔTmea) of the Ni50.8Ti49.2 SMA.
Download figure:
Standard image High-resolution image
Furthermore, the adiabatic temperature change (ΔTadi) was estimated using the following relation [27, 39]:

Here, T is the absolute temperature in Kelvin, and Cp is the specific heat (424 J kg−1 K−1). Based on the obtained ΔSσ values, the ΔTadi values were estimated, and are shown in figure 6(d). Consistent with the ΔSσ values, the ΔTadi values decreased with temperature, and reached a maximum value of 23 K, which was higher than the measured temperature changes. Analogous results have been reported in a variety of elastocaloric materials [15, 29, 40]. The smaller measured ΔTmea values were commonly ascribed to incomplete MTs and insufficient adiabatic conditions. Considering the lower loading rate of 5 × 10⁻³ s−1, heat loss during testing (such as heat transfer to the grips and surrounding air) was inevitable. Larger temperature changes could be achieved by increasing the applied strain level or loading speed in future work.
Here, we calculated the COPmater values of the Ni50.8Ti49.2 SMA with the strain level of 4%. Based on the adiabatic stress–strain curves (dashed line shown in figure 2), we estimated the area enclosed by the loading and the horizontal axis (13.03 MPa): with the density (ρ) of 5935.6 kg m−3, the COPmater was 4.5 (COPmater = ΔSσTρ/W). This COPmater value was even higher than that of other NiTi bulks [14]. It is worth noting that a higher COPmater value of 11.8 was reported in Cui's work for the compression cycle. However, the actual temperature change (ΔT) was much lower than that of the tension cycle [14].
5. Conclusions
The elastocaloric effect of the Ni50.8Ti49.2 SMA was presented. A high COPmater value of 4.5 was obtained. The temperature changes (ΔT) increased with increasing applied strain (ε), and reached 18 K upon loading and −11 K upon unloading at ε = 4%. The high temperature changes were attributed to the large stress-induced entropy changes (the maximum ΔSσ value was 37 J kg−1 K−1). Elastocaloric irreversibility (ΔTirr = ΔTload − ΔTunload ≠ 0) was observed between the forward and reverse MTs at different temperatures. The friction dissipation was considered as the main source of the elastocaloric irreversibility, which always led to heating regardless of whether the MT was forward or reverse. Upon increasing the loading–unloading tensile cycles, the ΔT values slowly decreased, and stabilized at 6.5 K upon loading and −6 K upon unloading after tens of mechanical cycles. Compared with results obtained under other caloric effects, especially the magnetocaloric effect, the present NiTi alloy exhibited a large temperature change (ΔT) and stress-induced entropy change (ΔSσ), and a high COP. The NiTi SMA showed strong competitive ability for solid-state refrigeration (or application as heat pumps).
Acknowledgments
This work was supported by the Key Laboratory of Cryogenics, Technical Institute of Physics and Chemistry (TIPC), Chinese Academy of Sciences (CAS) (Grant No. CRYOQN201501), and the National Natural Science Foundation of China (Grant No. 51577185, 51377156, and 51408586).