


Abstract
In recent years, many efforts have been made to exploit full-field measurement optical techniques for modal identification. Three-dimensional digital image correlation using high-speed cameras has been extensively employed for this purpose. Modal identification algorithms are applied to process the frequency response functions (FRF), which relate the displacement response of the structure to the excitation force. However, one of the most common tests for modal analysis involves the base motion excitation of a structural element instead of force excitation. In this case, the relationship between response and excitation is typically based on displacements, which are known as transmissibility functions. In this study, a methodology for experimental modal analysis using high-speed 3D digital image correlation and base motion excitation tests is proposed. In particular, a cantilever beam was excited from its base with a random signal, using a clamped edge join. Full-field transmissibility functions were obtained through the beam and converted into FRF for proper identification, considering a single degree-of-freedom theoretical conversion. Subsequently, modal identification was performed using a circle-fit approach. The proposed methodology facilitates the management of the typically large amounts of data points involved in the DIC measurement during modal identification. Moreover, it was possible to determine the natural frequencies, damping ratios and full-field mode shapes without requiring any additional tests. Finally, the results were experimentally validated by comparing them with those obtained by employing traditional accelerometers, analytical models and finite element method analyses. The comparison was performed by using the quantitative indicator modal assurance criterion. The results showed a high level of correspondence, consolidating the proposed experimental methodology.
Export citation and abstract BibTeX RIS
1. Introduction
Experimental modal analysis is an essential part of the characterisation of the dynamic behaviour of structures [1]. Different transducers and different modal identification algorithms have commonly been developed and employed throughout the years, in the search for more realistic characterisation. Theoretical and numerical models have shown significant improvement by using experimental validation. Modal identification algorithms are designed to manage the frequency response functions (FRFs) and transfer functions, which relate the displacement response of the structure to the force excitation. As a result, natural frequencies, mode shapes and damping ratios are obtained.
In recent years, research has been focussed on exploring the capabilities of digital image correlation (DIC) combined with high-speed cameras (HS DIC) [2–7]. DIC is a consistent and powerful optical technique for obtaining full-field displacement measurements [8], and only requires one image for each deformation state to be analysed. This interest is due to the intrinsic limitations of traditional transducers, like accelerometers, which can be invasive when used on light-weight elements, modifying their natural frequencies. This phenomenon is widely known as the mass-loading effect [1]. Moreover, most of the transducers perform pointwise measurements, and hence only a limited number of points are measured in the whole structure. To overcome these disadvantages, HS DIC offers a non-invasive full-field displacement measurement and a considerable improvement in the performance of experimental modal analysis. On the other hand, DIC is considerably less sensitive than accelerometers and the equipment is also expensive. More detailed comparisons between accelerometers, laser vibrometry and DIC have been made [4, 7, 9].
Complete modal characterisation has already been performed using HS DIC. Different broadband excitation, such as that of impact [10] or random signal [9, 11], was applied to generate full-field FRFs. However, modal testing is not restricted to the evaluation of transfer functions between the force input excitation and response. In fact, some experimental scenarios involve tests in which it is not possible to register the excitation magnitude as a force. One of the most common tests evaluates the response of the structure when it is excited by base motion. The transfer function in this case relates the transmission of the base motion to the structure response motion. Thus, the transfer function is known as the transmissibility function. Despite the similarities between FRFs and transmissibility functions, straight modal identification on transmissibility functions must be avoided if, as is usual, FRF-based algorithms are considered [12].
In this way, base motion excitation was performed by Ha et al [13] to obtain the mode shapes of an artificial beetle's wing in forced normal mode (FNM) tests employing HS DIC. The natural frequencies had previously been identified in a swept-sine test using a laser vibrometer. No transmissibility function was determined from the DIC data. In later work, Ha et al [14] obtained the transmissibility functions of the wing using HS DIC. However, the mode shapes were measured in FNM tests rather than transmissibility functions. Furthermore, the damping ratios were calculated using the half power method from the smoothed transmissibility functions. Thus, no previous work on HS DIC and base motion excitation for a complete modal analysis is found in the literature.
In the present work, a complete experimental methodology for full-field modal analysis based on transmissibility functions is proposed, in this way avoiding FNM tests for mode shape characterisation. A set of tests on a calibrated cantilever beam [15] has been performed to validate this experimental methodology. The beam was excited using a broadband random signal when clamped to the shaker's armature. The natural frequencies, mode shapes and damping ratios were determined using EasyMod algorithms [16]. Despite the benefits of full-field displacement, managing the huge amount of data generated by DIC is a challenge to modal identification. A typical DIC measurement involves a huge number of points (of the order of  points according to the current state of technology) whereas traditional test instrumentation consist of tens or hundreds points at most. Multi-FRF identification methods, which evaluate the whole FRF data set simultaneously, may thus be unfeasible. Due to its simplicity and the lower computational costs, a single-FRF circle-fit approach [1] was applied, based on single degree of freedom (SDOF) assumptions. Considering the differences between the transmissibility functions and FRFs, this study is also a step forward regarding previous work. A theoretical transformation from transmissibility functions to FRFs was performed to increase the accuracy of modal identification, according to the circle-fit assumptions.
To validate the experimental methodology, the theoretical modal behaviour of the cantilever beam was compared with the modal parameters from the experimental modal analysis. The modal behaviour of a cantilever beam is well described by theory and it can be commonly found in the bibliography as one of the examples of continuous system vibration analysis [17]. From an experimental point of view, DIC transmissibility functions were compared with the transmissibility functions simultaneously obtained by accelerometer measurements. Considering the apparently relatively lower sensitivity of DIC, evaluation of the coherence functions is presented here as an interesting indicator of the measurement quality along with the identification of floor noise in the power spectral density (PSD). As temporal aliasing is an intrinsic limitation of DIC measurements [9, 18], accelerometer signals were also employed to detect the possible aliased frequencies in the DIC transmissibility functions. To conclude the validation, a comparison was also performed with finite element method (FEM) modal analysis. A correlation of the mode shapes between the methodologies was also performed using a modal assurance criterion (MAC) [19]. Thus, a quantitative indication of the mode shape agreement was provided.
2. Experimental procedure
2.1. Cantilever reference material
The analysed element was a stepped cantilever bar employed as a reference material (RM) in a previous validation analysis [15]. This design shows high conformity with the analytical approaches due to its stable and reproducible behaviour. Hence, it is conventionally employed for the calibration of the full-field optical techniques of displacement and strain measurements comparing the full-field measurement with the analytical results, both static and dynamic [20].
In this work, the RM was considered suitable for proper validation of the proposed experimental methodology by comparing the results with analytical and numerical solutions.
The RM dimensions are shown in figure 1. It is made of aluminium 2024-T3, the thinner part is 4 mm thick and 160 mm long, the thicker part is 20 mm thick and 80 mm long and the width is 40 mm throughout the bar. Thus, when the thicker part is clamped, the thinner part behaves as a cantilever beam.
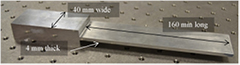
Figure 1. The cantilever reference material, RM, with dimensions.
Download figure:
Standard image High-resolution imageFor experimental modal analysis, the RM was clamped to the armature reproducing a perfectly rigid boundary condition. Therefore, vibration was induced in the thinner part of the RM by transmitting the motion of the shaker through the clamp. The symmetrical configuration made it possible to obtain typical cantilever mode shapes in an easy way. To determine the beam transmissibility functions, a broadband spectrum excitation was applied [1]. In this study, a random signal was chosen. This signal consists of a flat profile in the frequency domain from the 10–1000 Hz spectrum. Within this range, two bending modes appeared during the excitation previously mentioned.
2.2. DIC analysis
The full-field response of the beam was captured by a stereoscopic system. Two high-speed camera FastCam SA4 models produced by Photron with 50 mm f/1.4D focal length lenses (Nikon) were employed for recording the upper face of the cantilever, figure 2. The frame rate was set to 2000 fps, according to Nyquist's frequency criterion [21], and the resolution was adjusted to 1024 × 512 pixels obtaining 10 500 frames during each test, limited by the internal memory of the camera. Two different random spectrum tests were conducted in order to increase the number of frames and hence reduce the presence of noise when averaging the PSD according to Welch's method.

Figure 2. Optical set-up for experimental modal analysis.
Download figure:
Standard image High-resolution imageThe lens exposure time was set to 0.1 ms in order to achieve a sampling period ten times shorter than the highest excitation frequency period. To improve the lack of light due to the short exposure time, a 150 W lamp was adopted to guarantee a uniform light intensity over the specimen, as shown in figure 2.
An accelerometer was set over the clamping system, as shown in figure 2, to register the base motion excitation, and it was synchronised with the stereoscopic system. A DAQ system (NI USB-6251 DAQ) digitalised the accelerometer signal and synchronised it with the camera acquisition. All the devices were synchronised using the same sampling parameters and a perfect correlation was achieved between the response and the excitation measurements for the evaluation of the transmissibility functions. For a better understanding of the set-up, a complete measurement diagram is represented in figure 3.
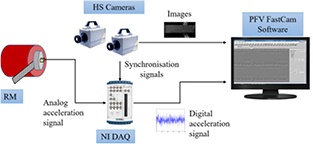
Figure 3. DIC experimental measuring diagram.
Download figure:
Standard image High-resolution imageThe DIC measurement required surface preparation: since the surface colour of the beam was homogeneous, a grey-scale random pattern had to be applied by spraying black paint over a white background. The images captured during the tests were processed using Vic-3D software (produced by Correlated Solutions Inc.) for 3D DIC analysis [8]. Before processing the displacements, Vic-3D was employed to determine the calibration parameters of the stereoscopic system of the camera. Considering the size of the specimen, a grid of 12 × 9 points with a spacing of 4 mm was chosen. As a result, a pixel deviation of just 0.015 was achieved, which implies excellent calibration.
The area of interest was divided into facets, each of which is a measurement point. The facet size must be chosen according to the speckle size, shown in figure 4(a). The speckle was applied to cover about 6 pixels as an average size [22]. The processing parameters had a facet size of 13 pixels and an overlap of 4 pixels. The grid shown in the area of interest (figure 4(b)) is a representation of the chosen facet size. Thus, DIC processing provided a matrix of 66 × 246 points, where every element of the matrix contained a vector of time domain displacement.

Figure 4. (a) The speckle pattern on the upper face of the beam; (b) the area of interest and the facet size visualisation.
Download figure:
Standard image High-resolution imageThe proposed methodology for frequency analysis consists of determining the transmissibility function at every data point provided by DIC displacement measurements with respect to the excitation accelerometer signal. In this sense, Welch's averaging method [23] was applied using a script developed in Matlab. Since the image acquisition rate for both cameras was 2000 frames per second, windows of 2000 frequency lines were defined to provide a frequency resolution of 1 Hz. Since there is discontinuity between the two random tests they were independently processed employing Welch's method. A Hanning window was adopted to avoid leakage, and an overlap of 75% was employed to increase the number of averages. As a result, two transmissibility function sets were obtained and the final transmissibility function was calculated at each point as the mean value of these data sets.
2.3. Circle-fit modal identification
In the studied case, the transmission of the base motion to the response experienced in the beam was analysed. Nevertheless, the circle-fit approach [1] was also employed for modal identification from the FRFs, based on the relationship between the displacement response and the force excitation. The circle-fit considers that just one mode influences the behaviour of the structure in the vicinity of the peak. In the same way, conversion is here proposed from transmissibility to its equivalent FRF, considering that in every peak the SDOF theoretical equations govern the dynamic behaviour. Thus, it can be found that [1]
where  represents the FRF,
  is the transmissibility function considering the relative response displacement from the base motion excitation,
  is the natural frequency of the system and
  is the frequency vector from the corresponding spectrum.
According to the adopted experimental set-up, this conversion is not straightforward. The transmissibility functions obtained by  represent the relationship between the absolute displacement response
  , using DIC, and the base motion acceleration
  , using the accelerometer, both in the frequency domain. The transmissibility in equation (1) is a non-dimensional relation between the response and excitation motions; thus, the base acceleration must be integrated twice to determine the base displacement
  . Additional transformations are required in order to obtain transmissibility functions in terms of the relative displacement response. These evaluations in the frequency domain are represented as follows:
Equation (3) represents the experimental relative transmissibility functions whose theoretical conversion can now be applied. In figure 5 the result of the transformation can be evaluated.

Figure 5. The experimental transmissibility function at the point of the free end of the beam: (a) considering the absolute response and base motion in terms of acceleration; (b) considering the relative response and base motion in terms of displacement.
Download figure:
Standard image High-resolution imageHence, after detecting the resonance peaks, the experimental transmissibility function transformation in the vicinity of the analysed resonance is composed of the calculation of the absolute displacement transmissibility function by integrating the base acceleration using equation (2), the relative displacement transmissibility functions applying equation (3) and finally, the FRF, equation (1). Since the natural frequency of the analysed resonance must be previously known in equation (1), for this evaluation, it is applied with a proposed natural frequency  , as shown in equation (4). Then, the circle-fit approach determines the actual natural frequency
  , from the resulting FRF,
  . Since the natural frequency is constant, it does not distort the actual FRF shape. Once the actual natural frequency is determined, a second circle-fit approach identification is necessary after correcting the FRF with the actual natural frequency, as shown in equation (5). The final result of the conversion is shown in figure 6, which shows the divergence of both kinds of transfer functions corresponding to the first two bending modes of the beam:

Figure 6. A comparison between the transmissibility function (T) and the FRF (H) at the point of the free end of the beam: (a) first mode; (b) second mode.
Download figure:
Standard image High-resolution imageNatural frequencies, mode shapes and structural damping loss factors  were identified by performing the circle fitting in every mode. The process was performed in the full-field using every measured point provided by DIC. Hence, the mode shapes were obtained by mapping these results. For the identification of a unique natural frequency and damping ratio, the mean from the mapping results was evaluated.
2.4. Experimental set-up for validation with accelerometer
An accelerometer (figure 7) employed for validation purposes was placed at 35 mm from the clamping grip so that the mass-loading effect was negligible. Its signal was processed together with the excitation accelerometer signal to obtain the transmissibility function at this point during the same random test. This study also allowed the identification of potential aliasing in the DIC measurement, so an alternative acquisition system was used. With a real time vibration analyser (Photon+ produced by Bruel and Kjaer), controlled by the commercial software RT Pro Photon, it was possible to perform this validation. The versatility of this system allowed for a wider spectrum—up to 3200 Hz—so that the potential aliased frequencies in the DIC measurements could be detected. In order to achieve the same frequency resolution as in the DIC transmissibility functions, 3200 frequency lines were established. Several windows were averaged employing a Hanning window with no overlapping because of the real time analysis.
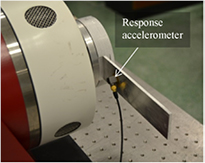
Figure 7. Additional accelerometer for response measurement to be compared with the 3D-DIC results.
Download figure:
Standard image High-resolution imageAdditionally, the analyser provided the excitation signal to the shaker. A representation of this set-up is shown in figure 8. Since the DIC and accelerometer measurements were performed simultaneously, a combination of figures 7 and 8 illustrates the global experimental set-up.

Figure 8. Accelerometer experimental measurement diagram.
Download figure:
Standard image High-resolution image3. Results and discussions
The methodology is evaluated here and the most significant results are also presented. In section 3.1, the DIC measurements during the random test were validated based on the accelerometer measurements. This validation includes the identification of the noise floor in the DIC measurement and its influence on the coherence function as well as a determination of the possible aliasing. In section 3.2, the results are shown from a modal analysis on the equivalent FRFs using circle fitting, and a comparison is made of the modal parameters with the FEM and theoretical results.
3.1. Experimental validation
The transmissibility results according to the proposed methodology show two resonance peaks. Figure 9(a) shows the absolute transmissibility functions versus the frequency. The results correspond to a point in the released tip of the beam, where the maximum response occurs.
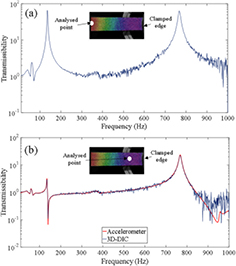
Figure 9. The absolute transmissibility function from 3D-DIC measured at (a) the point of the tip of the RM from the 3D-DIC, (b) the point where the accelerometer was located.
Download figure:
Standard image High-resolution imageFigure 9(b) shows the absolute transmissibility functions from the accelerometer placed on the beam compared with the DIC results at the same point. A high level of agreement is observed. However, the DIC transmissibility function is noisier than that of the accelerometer due to its lower sensitivity. This noise appears as a consequence of taking the measurement at a point with a low level of displacements, due to its location near the clamping grips. Furthermore, since a higher frequency involves lower displacement, conversely to acceleration, the signal-to-noise ratio also decreases at non-resonant high frequencies.
Aliasing, investigated on the basis of the excitation level, was negligible out of the excitation spectrum. In figure 10(a), the PSD of the excitation confirms this fact. Despite this, figure 10(b) shows that the accelerometer set on the RM detected a peak of resonance around 1500 Hz. The PSD of the same point measured by the DIC is truncated at 1000 Hz, which is the Nyquist frequency. This could thus indicate some aliasing in the DIC measurements. However, it is seen that the DIC is unable to follow the accelerometer PSD above 800 Hz, providing a flat profile. This indicates the level of the noise floor, marked as a red line, and implies that the DIC is unable to identify any components under this level. The displacement signal provided by the accelerometer out of the excitation spectrum is many orders of magnitude lower than this threshold. Thus, it is demonstrated that DIC measurements are free from the aliased frequencies in this test.
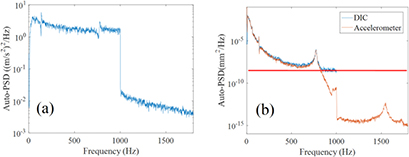
Figure 10. The PSDs of (a) the excitation and (b) the response obtained by DIC and the accelerometer.
Download figure:
Standard image High-resolution imageThe DIC coherence function at the tip (figure 11(a)) shows some interesting aspects as well. First, as was expected, the coherence tends quickly to zero, which means the presence of pure noise above 800 Hz, since it is below the floor noise. The coherence is also expected to be close to one at resonances where the level of noise is negligible due to the high level of response. In the same way, coherence should decrease in the range between both modes. As seen in figures 9 and 10, there is a significant presence of noise in this range, since the beam response is close to the noise floor. However, the first resonance value is defined by a low value of coherence. Figure 11(b) compares the coherence from DIC and the accelerometer; the accelerometer also shows this trend. This happened since the frequency resolution was not high enough to define a peak as sharp as the first one. An additional test was performed using the accelerometer set-up described in epigraph 2.4. In this case, the frequency resolution was increased to 0.25 Hz. In figure 12 it is seen that coherence has congruent values when the peak is better defined; only anti-resonance reduced the coherence.
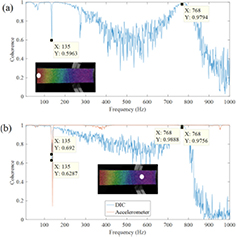
Figure 11. The coherence function at (a) the point of the tip of the RM, (b) the point where the accelerometer was located.
Download figure:
Standard image High-resolution image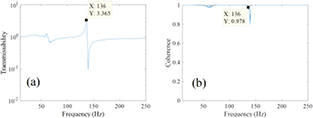
Figure 12. The transmissibility function (a) and coherence (b) provided by the accelerometer measurement in a higher frequency resolution test to analyse the influence of the resolution on coherence.
Download figure:
Standard image High-resolution image3.2. Modal identification
The next step was to employ the circle-fit approach for modal characterisation, including the previous conversion of transmissibility functions. Since this approach is an SDOF method of characterisation, one fitting per mode was performed. Therefore, for the first mode characterisation the interval from 132 Hz to 137 Hz was selected, whereas for the second mode the interval was from 760 Hz up to 777 Hz. Figures 13 and 14 show the Nyquist and Bode diagrams for both modes, respectively, at the point at the tip of the beam. As explained with the coherence function in figure 12, it was possible to improve the results with a higher frequency resolution, which implies either an increase in the number of images or a reduction of the analysed spectrum. Nevertheless, the aim of this study is focused on the methodology.

Figure 13. A Nyquist and Bode diagram of the circle-fitting of the first mode at the point of the tip of the beam.
Download figure:
Standard image High-resolution image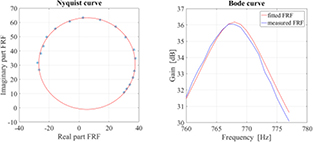
Figure 14. A Nyquist and Bode diagram of the circle-fitting of the second mode at the point of the tip of the beam.
Download figure:
Standard image High-resolution imageThe adopted experimental methodology employs every single point of the displacement map for its evaluation. It provides three matrices with the natural frequency, the amplitude of the mode shape and the structural damping ratio. A single value for the natural frequency and damping ratio for each mode is obtained by calculating the mean of the natural frequency and the damping ratio matrices. These results are presented in table 1, showing consistent uniformity in both the natural frequencies and damping ratios.
Table 1. Statistical indicators of the natural frequencies,  , and structural damping,
  , identified by the circle-fit approach in the 3D-DIC measurements.
| Mode |  |
 |
||
|---|---|---|---|---|
| Mean | Standard deviation | Mean | Standard deviation | |
| 1 | 135.38 | 0.08 | 1.69 | 0.08 |
| 2 | 767.78 | 0.74 | 1.45 | 0.04 |
The numerical modal analysis was performed using Abaqus software considering the experimental conditions; it consisted of 1600 S4R linear shell elements. The results of the natural frequencies of both bending modes obtained by performing FEM and theoretical analyses are presented in table 2. Comparing the results with the experimental ones, similar natural frequency values were obtained with a 5% error.
Table 2. The natural frequencies of the two first modes identified by FEM and the theoretical analyses.
| Mode | FEM | Theoretical |
|---|---|---|
| 1 | 131.03 | 129.34 |
| 2 | 817.81 | 810.41 |
Finally, the results of the mode shapes corresponding to each analysed resonance frequency are presented from the experimental, FEM and theoretical analyses. The normalised results are presented as three contour plots in figures 15 and 16. From a qualitative point of view, the mode shapes are very similar for the three evaluated methods, and they clearly show typical bending modes. The first mode has one node with zero displacement at zero length, where the beam is clamped. The second bending mode implies an additional mode, at approximately 120 mm as shown in figure 16. Both modes reproduce the maximum displacements at the released tip of the cantilever, i.e. at 160 mm in the plots. As is observed in figure 16, the second mode shape is slightly noisier. As previously seen in figure 10, the displacements in this mode are closer to the floor noise. Furthermore, there is one more zero-displacement node, increasing the area of low displacement.
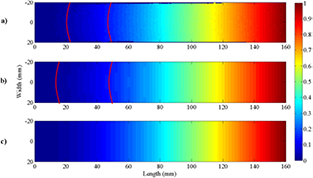
Figure 15. The mode shape of the first resonance: (a) the circle-fit approach from 3D-DIC; (b) FEM analysis; (c) theoretical analysis. The plate behaviour is highlighted by red lines.
Download figure:
Standard image High-resolution image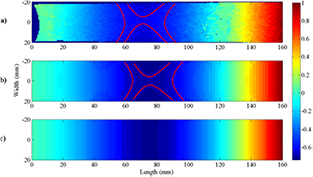
Figure 16. The mode shape of the second resonance: (a) the circle-fit approach from 3D-DIC; (b) FEM analysis; (c) theoretical analysis. The plate behaviour is highlighted by red lines.
Download figure:
Standard image High-resolution image
It is perceptible that only the numerical and the proposed full-field experimental procedures are able to appreciate the slight plate behaviour in the beam. As shown by the red lines in the figures, the contours have a certain curvature which involves deformation along the transverse direction. In the first mode (figure 15), it is observed in the interval from 20 mm to 60 mm, in the second mode (figure 16), this behaviour is detected clearly surrounding the middle of the beam due to its greater shape complexity. If only beam behaviour occurs, the contours should be parallel as the theoretical analysis shows (figures 15(c) and 16(c)).
Despite the agreement shown in the contour plots, for a more accurate comparison providing a quantitative indication, MAC was adopted to compare the experimental modal analysis with both the FEM and theoretical analysis. The application of MAC between FEM and the theoretical results makes no sense, since the objective of this work is the validation of the experimental methodology of the DIC by means of these two methods. The results shown in table 3 highlight that the correlation of the mode shapes is supported by values close to unity.
Table 3. The MAC matrix from a comparison between the FEM/theoretical analyses and 3D-DIC.
| Experimental modal analysis | |||
|---|---|---|---|
 |
 |
||
| FEM analysis |  |
1.0000 | — |
 |
— | 0.9836 | |
| Theoretical analysis |  |
0.9999 | — |
 |
— | 0.9841 | |
4. Conclusions
This work presents an experimental methodology for modal identification in base motion tests using HS 3D-DIC, founded on the interest of these kinds of experimental modal analyses and the features of DIC. The methodology takes into account the conversion of DIC transmissibility functions into equivalent FRFs based on SDOF assumptions for validating the use of modal identification algorithms. This has not been considered in previous work on DIC transmissibility functions. No additional technique or test for the identification of any modal parameters was employed. To address the challenge of managing the huge amount of data provided, the circle-fit method was proposed as the modal identification algorithm. This is particularly interesting for full-field modal identification since the method is less computationally demanding than multi-FRF methods and provides a high level of accuracy, although the SDOF method might not be suitable when the modes are very close.
The methodology performed the complete experimental modal characterisation of a cantilever beam. The full-field identification was consistent and congruent considering every single point, making it especially attractive for mode shape visualisation. An experimental validation of the DIC measurements was conducted by simultaneously employing an accelerometer. A comparison between the transmissibility functions from DIC and the accelerometer reveals a high level of correspondence. Analysis of the PSDs reveals DIC floor noise. Considering this threshold and the magnitude of the accelerometer PSD over the Nyquist frequency of the DIC test, it was concluded that no aliasing had occurred. This conclusion is crucial for validation of the results since no anti-aliasing filter can be applied to the DIC measurements.
The influence of floor noise was also revealed in the coherence functions. Regarding the current limitations of DIC regarding the sensitivity in comparison with other transducers, coherence is thus a powerful indicator for detecting poor components in the spectrum, especially when no information about the floor noise is known.
Furthermore, the experimental results were validated with analogous theoretical and numerical analyses. Both the natural frequencies and the mode shapes of the circle-fit approach were very similar to those from the theoretical and numerical methods. In particular, the MAC criterion was applied to the mode shape comparison. It is necessary to point out that this experimental methodology employs no filtering process to enhance the results. These facts have led to proof that the proposed experimental methodology is robust and consistent.
Acknowledgments
This work has been conducted with the financial support of the Universidad de Jaén through the programme 'Plan de Apoyo a la Investigación, al Desarrollo Tecnológico y a la Innovación de la Universidad de Jaén'. The authors are gratefully acknowledged.