

Abstract
The jump-to-contact (JC) phenomenon for (111)-oriented surfaces in aluminum at room temperature is studied via molecular dynamics simulations. The effect of crystallographic misorientation and interfacial distance on the JC behavior and distribution of the resultant defects at the interface is investigated. The effect of misorientation on the critical distance for JC is found to be negligible. However, when JC occurs, different distribution of defects is observed for various misorientation angles. The density of defects is shown to be a function of interfacial distance for low misorientation angles, but independent of it for misorientation angles of ∼30 ± 10°.
Export citation and abstract BibTeX RIS
1. Introduction
Formation of nano-contacts between two metallic substrates is an important aspect in investigating various processes, including: adhesion, friction, and indentation. It has been shown that when two clean substrates are positioned close enough, atoms on the opposing surfaces jump together [1, 2]. This phenomenon, called jump-to-contact (JC), also known as avalanche-in-adhesion, is an atomic scale instability, which occurs due to short-range attractive forces between atoms on the free surfaces of the two substrates [2–4]. Evidences for JC have been provided experimentally by utilizing techniques such as atomic force microscopy [3], scanning tunneling microscopy [5–7], and mechanically controllable break junctions [7, 8]. In these studies, JC has been detected through a jump in the force-displacement or conductance-displacement curves. Occurrence of JC has also been shown in multiple computational studies [3, 4, 9–11].
When JC occurs, bonds between atomic layers that are close to the contacting surfaces stretch, atoms fill the interfacial gap, and the two free surfaces make a contact [1, 2]. Therefore, two main consequences of JC occurrence are (i) decrease in the total energy of system due to the elimination of free surfaces (i.e., high energy 2D crystal defects), and (ii) generation of defects because of the atoms filling the interfacial gap. While the former has been properly studied [1, 2, 12], the latter consequence has not been thoroughly investigated. Since the difference in the energy of free surfaces is dictated by the crystallographic mismatch between substrates, misorientation is expected to impact the JC behavior and the resultant defects at the interface. This hypothesis has been also proposed by Lu et al [13], the so-called 'oriented-attachment' mechanism, based on their high resolution TEM analysis on the instantaneous cold-welding of nano-wires. In the present study, using molecular dynamics (MD) simulations, the effect of misorientation on the critical distance, below which JC between (111) planes in Al occurs, is investigated. In addition, atomic arrangement, after occurrence of JC, is inspected to analyze the distribution, density, and evolution of crystallographic defects at the bonded interface. Moreover, the effect of interfacial gap on the density of defects is investigated. Identifying the distribution and density of defects at the interface is of significant scientific importance as defects control diffusional mechanism and phase transformations that may occur following the contact/adhesion [14–16].
2. Computational methods
MD simulations are performed using the Large-scale atomic/molecular massively parallel simulator (LAMMPS) package [17] and embedded atom method (EAM) interatomic potential for aluminum [18]. Time integration is carried out while temperature and pressure are kept constant using the Nosé–Hoover thermostat [19] and barostat [20] with a time step of 2 fs. Axes x, y, and z of the simulation cell are along the ![$[1\bar{1}0],$](https://content.cld.iop.org/journals/0965-0393/26/5/055007/revision2/msmsaac427ieqn1.gif)
![$[11\bar{2}],$](https://content.cld.iop.org/journals/0965-0393/26/5/055007/revision2/msmsaac427ieqn2.gif) and
and ![$[111]$](https://content.cld.iop.org/journals/0965-0393/26/5/055007/revision2/msmsaac427ieqn3.gif) crystallographic directions of a fcc crystal, respectively. Periodic boundary conditions are enforced in the x and y directions.
crystallographic directions of a fcc crystal, respectively. Periodic boundary conditions are enforced in the x and y directions.
To prepare the initial atomic configurations for MD simulations, two in-registry aluminum substrates are initially created, each containing 12, (111) atomic layers parallel to the x–y plane. A misorientation of  between the two substrates, is implemented through rotating the upper and lower substrates by
  and
and  about the [111] direction, using the approach described in [21]. Due to the three-fold rotation symmetry of the fcc crystal about the [111] direction and its two-fold rotation symmetry about the [110] direction, only configurations with
  are distinct and necessary to be investigated. To maintain periodic boundary conditions in the x and y directions, the requirements below should be satisfied
where n, the periodicity in both x and y directions, is an integer. Therefore, the minimum length of the simulation cell in these directions is defined as:


where a is the lattice constant. To have approximately 3 × 10⁵ atoms in the simulation cell, all atomic configurations are replicated in the x and y directions. The bottom two layers of the lower substrate and the top two layers of the upper one are kept fixed throughout the simulations, and a constant number of Newtonian layers (i.e., 10 layers in each substrate) is chosen for all simulations. The simulation cell is allowed to expand/contract in the x and y directions to ensure zero pressure in these directions. Minimization of energy is performed at 0 K using the conjugate gradient method implemented in LAMMPS. Next, the system is thermalized at 300 K for 20 ps. Then, to investigate the effect of initial distance between contacting surfaces on the JC behavior, the two substrates are placed at varied interfacial distances and for each distance, simulation is performed at 300 K for 20 ps. It is shown that this time is enough for the JC to occur, and for the system to reach equilibrium.
To identify the occurrence of JC, similar to the approach introduced in [9], a deviation parameter, i.e.,  which represents the divergence from perfect interplanar spacing, is defined as follows:

where  is the interfacial distance as a function of time and misorientation angle, and
  is the interplanar spacing of (111) planes at 300 K prior to simulation. During the course of simulations, calculations of equation (5) is done by extracting the average of z-positions of all atoms in contacting layers. A value close to zero for D indicates that the gap between free surfaces is not distinguishable from the distance between any two adjacent atomic layers in the [111] direction of substrates, i.e., contact exists between the substrates.
3. Results and discussion
3.1. JC behavior
MD simulations are performed for misorientation angles in the range of  and initial interfacial distances in the range of 2.5 Å
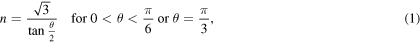
  6 Å. Evolution of D as a function of time for seven cases with θ = 0°, but different initial interfacial distances, is shown in figure 1(a). For the cases with initial interfacial distances of 5.8 Å and below, at some point, D drops to a value close to zero (i.e., occurrence of JC) and then oscillates around that value until reaching equilibrium. However, for greater initial interfacial distances, JC does not occur. It is important to note that the employed interatomic potential affects the value of critical distance for JC. For instance, the critical distance would be lower than 5.8 Å, if another EAM potential with lower cutoff, or the Lennard-Jones 12-6 potential were used. Here, our focus is on investigating the effect of misorientation on the changes in critical distance, for a given potential, rather than the absolute values of critical distance.
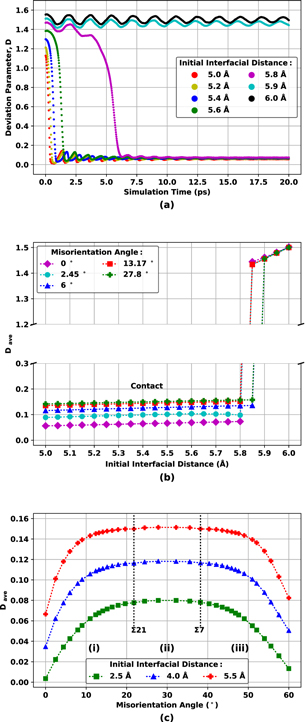
Figure 1. (a) Deviation parameter D versus simulation time for seven cases, all with θ = 0° but different initial interfacial distances, (b) Dave (average of D in the last 2 ps of simulation) versus initial interfacial distance, for five misorientation angles, and (c) Dave versus misorientation angle, for three different initial interfacial distances. (For interpretation of the references to color in this figure, the reader is referred to the web version of this article.)
Download figure:
Standard image High-resolution imageTo investigate how JC initiates and grows toward a complete contact, the 2D maps of local distances between two contacting surfaces are plotted. Figure 2 shows the 2D maps that are generated for two cases with different misorientations but the same initial interfacial distances. It is seen that independent of misorientation, JC starts locally and randomly, when the atoms in a small region of one surface come into a close proximity of the atoms on the opposing surface. Then after a relatively short time, contact forms across the whole interface. Although the process of initiation of local contacts seems to be independent of misorientation, a pattern for the final state of the interfacial distance is observed when misorientation exists between the two substrates (compare figures 2(f) and (F)). The pattern is found to be a function of misorientation angle, as will be discussed in the next section.
Figure 2. 2D maps of the interatomic distance (i.e., z-difference) between two contacting surfaces throughout the simulations. (a)–(f) and (A)–(F) correspond to the simulations with 0° and 2.45° misorientation angle, respectively. The initial interfacial distance for both (a)–(f) and (A)–(F) is 5.5 Å. Indices (a, A), (b, B), (c, C), (d, D), (e, E), and (f, F) correspond to the simulation times of 0 ps (initial state), 0.6 ps, 0.8 ps, 1 ps, 1.2 ps, and 20 ps (final state), respectively. 2D maps are generated by linearly interpolating the z-values for a grid of points on each surface, using the x–y–z positions of actual atoms, and then calculating the z-difference for each point on the x–y grid. (For interpretation of the references to color in this figure, the reader is referred to the web version of this article.)
Download figure:
Standard image High-resolution imageTo further study the effect of misorientation on JC occurrence, the changes in the average of D in the last 2 ps of simulation (i.e., Dave) as a function of initial interfacial distance is investigated. The results are shown in figure 1(b). The total of 34 angles are analyzed, but for the sake of clarity, only the results of five angles are included in the figure. No direct relationship between the critical distance for JC and crystallographic misorientation is observed; for all misorientation angles, a similar critical distance of 5.8 ± 0.05 Å (about 2.5 times the interplanar spacing of (111) planes) is detected. This observation suggests that the effect of crystallographic misorientation on the critical distance is negligible. However, for the cases in which JC occurs, increasing the misorientation angle leads to a raise in the value of D. Such behavior is better seen in figure 1(c), where Dave is plotted as a function of the misorientation angle for three initial interfacial distances of 2.5 Å (i.e., close to the interplanar spacing of (111) planes), 4.0 Å, and 5.5 Å (i.e., close to the critical distance for JC). As figure 1(c) shows, each curve follows a general trend of the increase in Dave as  deviates from 0° and reaches to a plateau near 30°. There is a similar, though not a symmetric, trend when
  decreases from 60° to 30°. Although the general trend is analogous to what has been reported for the energy of (111) twist boundaries [21–23], the curvature of the plots is a function of Dave, which represents the gap that should be compensated by defect formation. Two special coincident site lattice misorientation angles of 21.79° (Σ21) and 38.21° (Σ7) that have been reported in [24] for the energy of (111) twist boundaries, are also detectable on the curves, as shown in figure 1(c). Using these angles, the plots are divided into three regions (i, ii, and iii). In all three regions, as initial interfacial distance increases, Dave also increases, due to having a larger initial interfacial gap (see equation (5)). However, the extent of the increase in Dave depends on the extent of misorientation. The curvature difference in the first and third regions shows that the higher the misorientation angle, the larger the increase in Dave. On the other hand, such a dependency to the misorientation angle is not observed in region (ii). The absolute value of Dave is not of great importance, but the difference in the value is. The higher value of Dave means a larger distance between the contacting planes; this distance should be accommodated by elastic strain and formation of crystallographic defects at the interface.
The extent of elastic deformation depends on the separation distance between the two joining surfaces, i.e., h(t, θ) in equation (5). Since d is constant, h(t, θ) is directly proportional to D(t, θ). Consequently, the amount of elastic strain depends on the initial interfacial distance and misorientation angle. The maximum level of elastic strain is found to be ∼7%, which corresponds to the misorientation of 0° and initial interfacial distance of 5.8 Å, where have = 2.522 Å and d = 2.35 Å. Similar to Dave, have is defined as the average value of h(t, θ) in the last 2 ps of simulations. In addition to elastic strain, JC results in generation of crystallographic defects, distribution/density of which depends on the amount of have.
3.2. Crystallographic defects at the interface
Using the Dislocation Analysis modifier [25] of OVITO [26], the defects that are generated at the interface, by the end of the simulation, are visualized. Figure 3 shows the top-view images (i.e., along the z-axis of the simulation cell) of the two contacting surfaces, at the end of simulation, for three different combinations of misorientation angle and initial interfacial distance, all within region (i) of figure 1(c). Dislocations are shown, and atoms are colored based on their local crystal structure: fcc, HCP, and Disordered (atoms with no crystallographic characteristics). The structure of interface is comprised of triangular regions of stacking faults (i.e., atoms with HCP local structure), which are separated by disordered atoms from the perfect fcc atomic configuration (as shown in figures 3(a), (d) and (g)). These disordered atoms are the atoms located near partial dislocations with Burgers vectors of 1/6〈112〉. Comparison of atomic arrangement shown in figures 3(a) and (d) shows that the increase in initial interfacial distance when misorientation is constant, does not affect the general structure of the atomic configurations. In addition, at a constant initial interfacial distance, as the misorientation angle increases, the atomic arrangement changes, and the triangles become smaller, which leads to an increase in the number of disordered atoms (compare figures 3(a) and (g)). Therefore, it may be concluded that the general pattern of atomic arrangement is mainly affected by the misorientation. However, while the increase in initial interfacial distance does not change the pattern, it affects the density of the disordered atoms that surround the stacking fault regions. To better show this effect, only disordered atoms are shown in figures 3(b), (e) and (h). The higher number of disordered atoms in figure 3(e) compared to figure 3(b) supports this claim.
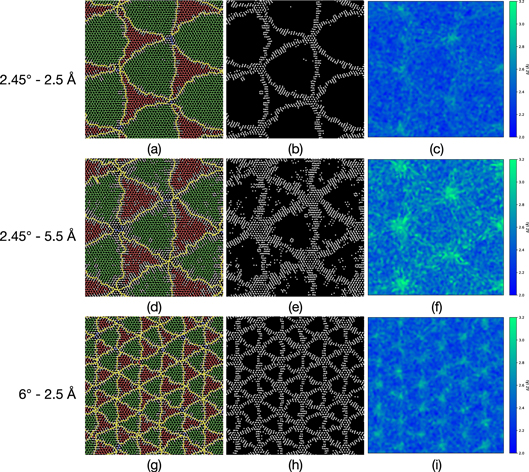
Figure 3. Top-view images showing the final structure of a 150 Å × 150 Å portion of interface (i.e., two contacting surfaces), in the simulations of the cases with misorientation angle and initial interfacial distance of (a)–(c) 2.45°, 2.5 Å, (d)–(f) 2.45°, 5.5 Å, and (g)–(i) 6°, 2.5 Å. (a), (d) and (g) show the atoms with fcc (green), HCP (red), and Disordered (white) local crystal structure as well as Shockley (yellow) and Perfect (blue) dislocations, on a black background. (b), (e) and (h) show the disordered atoms only. (c), (f) and (i) show the interatomic distance between the two contacting surfaces. (a), (b), (d), (e), (g) and (h) are obtained using OVITO [26]. (c), (f) and (i) are generated by linearly interpolating the z-values for a grid of points on each surface, using the x–y–z positions of actual atoms, and then calculating the z-difference for each point on the x–y grid. (For interpretation of the references to color in this figure, the reader is referred to the web version of this article.)
Download figure:
Standard image High-resolution imageIn addition to the 2D mapping of atomic configurations along the x–y directions, to study atomic arrangement along the z direction, the maps of interatomic distances between the two surfaces are shown in figures 3(c), (f) and (i). It is seen that the localized interatomic distance highly depends on the initial interfacial distance. The comparatively high distance in the areas of disordered atoms justifies the higher density of disordered atoms for the cases with high initial interfacial distance. On the whole, we can conclude that in region (i) of misorientation, by increase in either misorientation or initial interfacial distance, the percentage of disordered atoms increases. The shape of atomic arrangement is dictated by misorientation, but the density of the disordered atoms (thickness of triangles in figures 3(b), (e) and (h)) depends on the initial interfacial distance. The higher the distance, the higher the density (the thicker the edges). A similar behavior is expected in region (iii) of misorientation.
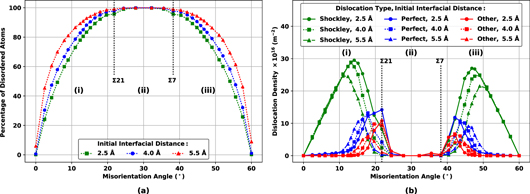
For a quantitative analysis of defects, the fraction of disordered atoms and the dislocation density as a function of misorientation angles for different initial interfacial distances are shown in figures 4(a) and (b), respectively. It is shown that as the misorientation angle deviates from 0° or 60°, the percentage of disordered atoms increases until it reaches a plateau in the middle region, where all the atoms at the interface are disordered atoms. Density of three categories of dislocations: Shockley partials, perfect dislocations, and other dislocations are quantified in figure 4(b). By deviation of misorientation angle from 0° or 60°, density of Shockley partials initially increases, reaching to a maximum, and then decreases. The increase in the density of Shockley partials means a reduction in the distance between them. As the distance reduces, partials interact and generate the perfect dislocations with Burgers vector of 1/2〈110〉. Therefore, the fall in the density of Shockley partials is accompanied by an increase in the density of perfect dislocations. In addition to Shockley partials and perfect dislocations, other dislocations are detected. These additional dislocations, identified as other dislocations in figure 4(b), are generated as the result of the interaction between Shockley partials and perfect dislocations. Comparing figures 4(a) and (b), it is seen that in region (ii), the percentage of disordered atoms is maximum (∼100%) and the density of dislocations is almost zero. Therefore, it may be concluded that in this region, the mismatch between two substrates is above the extent that can be accommodated by dislocations, and the interface transforms into a planar defect. On the other hand, in regions (i) and (iii), the interface consists of point defects and dislocations. As shown in figure 4(b), in these two regions, at misorientation angles near 0° or 60°, the density of Shockley partials is independent of the initial interfacial distance. However, as shown in figure 4(a), a higher fraction of disordered atoms is observed for greater initial interfacial distances. As partials start to interact and form perfect dislocations, the effect of interfacial distance on the percentage of disordered atoms diminishes, until the same maximum percentage of disordered atoms is achieved for all three cases, independent of their initial interfacial distance. Consequently, while in the first and third regions, initial interfacial distance has an effect on the distribution of defects at the interface, it does not have an effect on the distribution of defects in the middle region.
Figure 4. The results of OVITO's Dislocation Analysis modifier [25] showing (a) the percentage of disordered atoms and (b) the density of different types of dislocations, at the interface, as a function of misorientation angle, for different initial interfacial distances. (For interpretation of the references to color in this figure, the reader is referred to the web version of this article.)
Download figure:
Standard image High-resolution image
4. Conclusions
In summary, the effect of crystallographic misorientation and interfacial distance on the JC behavior of two aluminum substrates at room temperature is investigated. It is shown that for all misorientations studied, the critical interfacial distance below which JC occurs is 5.8 Å ± 0.05 Å. Although misorientation angle is not found to have an effect on the critical distance for JC, it controls the distribution and density of defects at the interface for the cases in which JC occurs. Three ranges of misorientation angles: (i) 0° < θ < 21.79°, (ii) 21.79° < θ < 38.21°, and (iii) 38.21° < θ < 60°, are identified based on the distribution of defects. In the first and third ranges, dislocations and point defects exist. It is shown that, in these two ranges, the density and arrangement of defects at the interface is not only a function of misorientation (and the resultant incommensurability of the structure) but is also a function of initial interfacial distance. In the middle range, the interface is a typical planar defect and the density of defects is independent of the initial interfacial distance.
Acknowledgments
This work was supported by the National Science Foundation (CMMI-1728652), and the School of Engineering at Santa Clara University (FY1617IG).