

Abstract
Fe3O4 nanorods coated with nitrogen-doped mesoporous carbon (ND-Fe3O4@mC) shells of defined thicknesses have been prepared via a new microwave-assisted approach. Microstructural characterization of these ND-Fe3O4@mC structures was performed using x-ray diffraction, x-ray photoelectron spectroscopy, transmission electron microscopy, and scanning electron microscopy. Following identification, the electrochemical performance of the catalysts was evaluated using linear sweep voltammetry with a rotating disc electrode system. The present investigation reveals enhanced oxygen reduction reaction catalytic activity and the carbon layer thickness influences oxygen diffusion to the active Fe3O4 nanorod core.
Export citation and abstract BibTeX RIS
1. Introduction
The development of high performance electrocatalysts for the oxygen reduction reaction (ORR) is an essential aspect of research aimed at establishing efficient fuel cells and metal–air batteries [1, 2]. Pt-based catalysts are very effective in promoting ORR, however, high cost and limited availability present challenges for their widespread practical application [3–6]. Much effort has been expended toward establishing affordable, alternative precious metal-free electrocatalysts [7]. In particular, because of their low cost, abundance, and environmental compatibility, non-precious transition metals [8–10], and metal oxides (e.g., spinels and perovskites) [11–14], as well as nitrogen doped (ND)-carbons [15, 16], have garnered attention. Recently, focus has turned to carbon-supported Fe3O4 nanocrystals; Fe3O4 possesses an inverse spinel (Fd3m) structure and a comparatively high electrical conductivity (200 Ω−1 cm−1 versus ∼10 Ω−1 cm−1 for MnO2) [17, 18]. The inverse spinel structure also provides redox active surface sites capable of O2 adsorption, which are crucial to the ORR process [17, 19]. Reports also indicate that Fe3O4 is resistant to chemical degradation in alkaline conditions [20]. Tuning the catalyst surfaces with heteroatom-doped carbon is an effective strategy for improving conductivity and electrocatalytic activity by lowering the ORR activation energy [10, 21–25]. In this context, one approach toward improving the ORR activity of transition metal oxide nanocrystals has been to coat them with mesoporous carbon containing pyrrolic and pyridinic nitrogen active sites [26–29]. Jiang et al fabricated B-doped and N-doped graphene incorporated in spherical Co3O4 nanoparticles as ORR catalysts. It is found, the catalyst exhibits high stability and activity when used as cathode catalysts in Zn–air batteries [30]. Detailed electrochemical analysis of these promising systems suggested a coupling effect between electrochemically active Co3O4 and heteroatom doped carbon that exhibits strong interactions with the adsorbed O2 species. Similarly, nanoscale Fe3O4 nanoparticles grown on porous CB have been employed as ORR catalysts in direct methanol fuel cell applications and exhibit better stability than baseline Pt–C catalysts [31].
Microwave irradiation heating is a clean, cost effective, and rapid method that provides homogeneous heating. As a result, microwave heating enhances reaction rates and product yield compared with conventional heating [32, 33]. In this work, we demonstrate a new straightforward and rapid microwave-based approach that generates well-defined α-Fe2O3 nanorods and the subsequent solution-phased coating of these nanorods with polydopamine (α-Fe2O3@PDA). Heating the polydopamine coated nanorods leads to a new hybrid catalyst consisting of Fe3O4 nanorods coated with nitrogen doped mesoporous carbon (ND-Fe3O4@mC). The resulting ND-Fe3O4@mC hybrid with various carbon shell thicknesses was also investigated as an ORR catalyst. The results suggest improved ORR electrochemical activity for the ND-Fe3O4 nanorods with shorter carbon coating time.
2. Experimental
2.1. Chemicals
Iron (III) chloride hexahydrate (99.9%) and sodium hydroxide (98.8%) were purchased from Fisher. Dopamine hydrochloride, pluronic F127 and tris-(hydroxymethyl) amino-methane were purchased from Sigma-Aldrich. Pt–C (40%), Nafion solution (5% w/w in water) and 1-propanol (99.99%) were purchased from Alfa Aesar. Carbon black (CB) (Vulcan XC-72) was purchased from CABOT. KOH was purchased from Fisher. All reagents were used as received unless otherwise specified. Pure O2 and Ar were obtained from Praxair.
2.2. Synthesis of α-Fe2O3 nanorods
Aqueous NaOH solution (9 ml; 6.0 M) was slowly added to aqueous FeCl3 · 6H2O (10 ml; 2.0 M) with stirring. Additional DI water (ca. 1 ml) was added to the solution and the orange mixture was stirred for 15 min at room temperature. Subsequently, the solution (6 ml) was transferred to a microwave reactor vial. The vial was sealed and transferred to a Biotage Initiator microwave synthesizer that was programmed to heat the sample at 150 °C for 60 min. Following the reaction, a crude product mixture appeared which was a red precipitate. The crude nanorods were isolated by centrifuging (10 000 rpm, 20 min) and purified through three redispersion/centrifugation cycles using DI water and ethanol. The final red product was isolated, dried in vacuo at room temperature, characterized and stored in air until needed.
2.3. Synthesis of ND-Fe3O4@mC
Coating α-Fe2O3 with nitrogen-doped carbon was achieved by combining purified α-Fe2O3 nanorods (50 mg) with triblock copolymer pluronic F127 (25 mg). Subsequently, 2-amino-2-hydroxymethyl-propane-1,3-diol (tris) (15 mg) was added and the mixture was dispersed/dissolved in DI water (12.5 ml). Dopamine hydrochloride (50 mg) was then added and the mixture was stirred at room temperature for 2, 4, and 12 h. The resulting polydopamine coated α-Fe2O3 nanorods (α-Fe2O3@PDA) were collected by centrifugation at 10 000 rpm for 0.5 h, washed using ethanol (3 × 25 ml), and dried in vacuo. The resulting dark gray powder was placed in a quartz boat, transferred to a standard Lindberg Blue tube furnace and heated to 400 °C (heating rate of 5 °C min−1) in a flowing Ar atmosphere where it remained for 3 h followed by cooling to room temperature. The samples are denoted as ND-Fe3O4@mC-2, ND-Fe3O4@mC-4 and ND-Fe3O4@mC-12, indicating different coating times of 2, 4, and 12 h, respectively.
2.4. Preparation of 'bare' Fe3O4 nanorods
20 mg of ND-Fe3O4@mC-2 was heated at 300 °C for 30 min under air atmosphere (heating rate of 10 °C min−1) to remove the carbon coating. The resulting material was characterized using high-resolution transmission electron microscopy (HR-TEM), x-ray diffraction (XRD), and thermogravimetric analysis (TGA).
2.5. Preparation of hollow carbon nanorods
10 mg of ND-Fe3O4@mC-2 was treated with 6 M HCl to dissolve the Fe3O4 core to obtain hollow carbon nanorods. The resultant material was characterized using HR-TEM.
2.6. Electrochemical measurements
Electrochemical properties of the nanomaterials were evaluated using a conventional three-electrode assembly with a Bio-logic potentiostat (SP-300) and a rotating disk electrode (RDE) (Pine Instruments Co, AFMSRCE). A Hg/HgO (1 M NaOH, 0.098 V versus NHE at 25 °C) reference electrode and a Pt coil counter electrode were used. The working electrode consisted of catalyst-modified glassy carbon (GC). An ink consisting of the catalyst and Vulcan XC-72 CB (catalyst/carbon: 1/1.5) in 0.7 ml isopropanol and 0.2 ml of Nafion (5% w/w in a water and 1-propanol dispersion, ≥0.92 meq g−1 exchange capacity) was prepared and ultrasonicated for 45 min. For comparison, commercial Pt–C catalyst (40 wt%, Alfa Aesar) was also prepared using the same method and the same loading. Prior to coating the catalyst ink onto the GC working electrode, the electrode surface was polished with 0.3 and 0.05 μm alumina slurries followed by sequentially washing with acetone, ethanol, and deionized (DI) water. Subsequently, 5 μl of the ink of choice was drop-coated on the surface of the RDE GC electrode (0.196 cm2 area), to reach a mass loading of 0.1 mg cm−2 (40 wt% catalyst + 60 wt% CB), and dried under lamp. Before cyclic voltammetry (CV) and RDE measurements, the electrolyte (0.1 M KOH) was saturated with high purity O2 or Ar as appropriate. Cyclic voltammograms were acquired at a scan rate of 10 mV s−1 from −0.7 to 0.4 V versus Hg/HgO. Linear sweep voltammograms (LSV) were acquired at a scan rate of 10 mV s−1 from −0.7 to 0.15 V versus Hg/HgO in an O2-saturated electrolyte at various rotation speeds (400–2500 rpm). The ORR current density was calculated based on the geometric surface area (0.196 cm2) of the catalyst film. The RDE technique was also used to obtain the intrinsic ORR activity of the catalysts by generating Koutecky–Levich (K–L) plots and using the following relationships:


where j, jl, and jk are the measured, diffusion-limited, and kinetic current densities, respectively, ω is the angular velocity of the electrode (ω = 2πN, N is the rotation speed), n is the number of electrons transferred during ORR, F is the Faraday constant (F = 96 485 C mol−1), Co is the bulk concentration of O2 (Co = 1.2 × 10⁻³ mol l−1), Do is the diffusion coefficient of O2 in the 0.1 M KOH electrolyte (Do = 1.9 × 10⁻⁵ cm2 s−1), ν is the kinematic viscosity of the electrolyte (ν = 0.01 cm2 s−1 in 0.1 M KOH) and k is the electron-transfer rate constant [24] Chronoampermetry was performed at a constant potential of −0.3 V versus Hg/HgO for 2000 s.
Catalyst stability was evaluated using repetitive CV cycling for 5000 cycles at a scan rate of 100 mV s−1 from −0.7 to 0.2 V versus Hg/HgO. In order to standardize the comparison, the ORR onset potential was set at the potential at which the cathodic current density reached 25 μA cm−2 at 1600 rpm for O2 saturated LSV curves. In an effort to minimize error caused by the resistance of the electrolyte i, corrections were made for all experiments using equation (4):

where i is the cell current and Ru is the uncompensated resistance (determined from electrochemical impedance spectroscopy measurements). Emeasured is the measured potential and Etrue is the iR-corrected potential. The uncompensated ohmic electrolyte resistance (∼75 Ω) was measured via high frequency ac-impedance in O2-saturated 0.1 M KOH.
2.7. Material characterization
TEM and energy dispersive x-ray spectroscopy (EDX) were performed using a JEOL 2010 transmission electron microscope equipped with a LaB6 thermionic emission filament operated at an accelerating voltage of 200 kV. TEM specimens were prepared by placing a drop of a dilute ethanol suspension of the material of interest onto a carbon-coated, 200 mesh Cu grid and drying at room temperature. High resolution-TEM images were acquired using a Hitachi-9500 TEM, operated at an accelerating voltage of 300 kV; images were processed using ImageJ software (Version 1.46r) [34]. Samples were prepared by drop casting dilute ethanol suspensions of the sample of choice onto holey carbon-coated copper grids (400 mesh).
X-ray photoelectron spectroscopy (XPS) analyzes were performed using a Kratos Axis Ultra instrument operating in energy spectrum mode at 210 W. Samples were prepared by drop coating a solution of prepared materials onto a Cu foil substrate to yield thin films. The base and operating chamber pressure were maintained at 10−7 Pa. A monochromatic Al Kα source (λ = 8.34 Å) was used to irradiate the samples and the spectra were obtained with an electron take-off angle of 90°. To minimize sample charging, a charge neutralizer filament was used when required. Survey spectra were collected using an elliptical spot with major and minor axis lengths of 2 and 1 mm, respectively, and 160 eV pass energy with a step of 0.33 eV. CasaXPS software (VAMAS) was used to interpret high-resolution spectra. All spectra were internally calibrated to the C 1s emission (284.8 eV). After calibration, a Shirley-type background was applied to remove most of the extrinsic loss structure. The FWHM for all the fitted peaks was maintained below 1.2 eV.
Nitrogen adsorption-desorption isotherms were measured at −196 °C with a Quantachrome Autosorb-1 adsorption analyzer. Prior to adsorption measurements, samples were degassed at 250 °C under vacuum for 2 h. The data were analyzed using Brunauer–Emmett–Teller (BET) theory [32]. The specific surface area was determined from the linear portion of the BET plot and the total pore volume was calculated from the amount adsorbed at a relative pressure of about P/Po = 0.995.
TGA was performed using a Mettler Toledo Star TGA/DSC system. The Fe3O4@mC samples were placed in a Pt pan and heated in a N2 atmosphere from 30°C to 800 °C at 10 °C min−1.
X-ray powder diffraction was performed using a Rigaku Geigerflex 2173 diffractometer equipped with a Co Kα radiation source (λ = 1.78 Å). Samples were mounted on a silicon plate inside an aluminum holder.
Raman spectra were collected using a Renishaw inVia Raman microscope. The excitation wavelength was 514 nm. Samples were prepared by mounting the sample of choice on Al foil.
3. Results and discussion
Nitrogen-doped carbon coated nanorods (i.e., ND-Fe3O4@mC) were prepared using a new convenient microwave assisted hydrothermal method (figure 1). Briefly, α-Fe2O3 precursor nanorods were prepared upon slow addition of an aqueous solution of NaOH solution to an aqueous FeCl3 · 6H2O solution with stirring. The resulting solution was heated in a microwave reactor to 150 °C for one hour.

Figure 1. Preparation of ND-Fe3O4@mC nanorods.
Download figure:
Standard image High-resolution imageThe resulting red precursor α-Fe2O3 nanorods were purified upon repeated washing with water/ethanol followed by drying in vacuo at room temperature. The purified α-Fe2O3 nanorods were coated with dopamine-derived nitrogen-doped mesoporous carbon using a modified procedure from the literature [15]. The resulting dark gray powder consisting of nanorods was collected by centrifugation, repeatedly washed with ethanol, dried at room temperature in vacuo, and subsequently heated to 400 °C for 3 h under Ar followed by cooling to room temperature. The final product obtained from the annealing process consisted of ND-Fe3O4@mC nanorods.
The structure and morphology of the α-Fe2O3 nanorods and ND-Fe3O4@mC-2 nanorods were investigated using TEM. The precursor α-Fe2O3 nanorods were 141 nm ± 44.8 nm long with diameters of 14 nm ± 3.4 nm (figure 2(A)). A representative HR-TEM image (figure 2(A) inset) shows continuous lattice fringes along the nanorod long axis. The observed d-spacing of 0.25 nm agrees with the spacing of the (110) planes of trigonal hexagonal α-Fe2O3 [33].
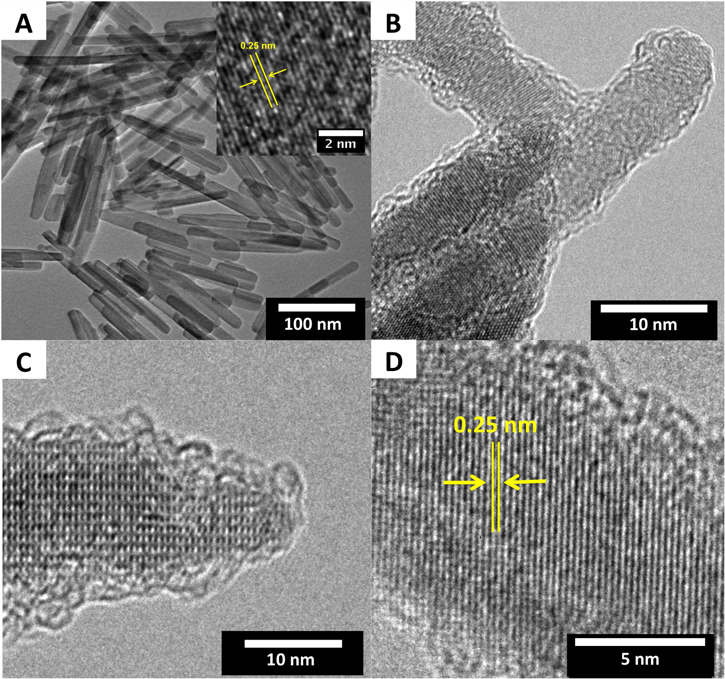
Figure 2. (A) Representative bright field TEM image of α-Fe2O3 nanorods (inset is HR-TEM image of the sample shown in tile (A). (B)–(D) Representative HR-TEM images of ND-Fe3O4@mC-2 nanorods.
Download figure:
Standard image High-resolution imageFollowing carbonization, the nanorod morphology is preserved (see figures 2(B) and (C)). A distinct amorphous carbon shell (thickness ∼1.5 nm ± 0.2 nm) formed on α-Fe2O3 nanorods that had been exposed to dopamine for 2 h (i.e., ND-Fe3O4@mC-2). The thickness of the carbon shell depends on the polydopamine coating time; increasing the time to 4 h (ND-Fe3O4@mC-4) and 12 h (ND-Fe3O4@mC-12), while keeping other parameters fixed, resulted in thicker coatings (figure S1). The carbon content for samples obtained from different polydopamine coating times was determined by TGA (figure S2). As expected, samples with the longest coating time (12 h) had the highest carbon content (38.3 wt%) and TEM analysis indicated a carbon layer thickness of 3.5 nm ± 0.5 nm. For the 2 h and 4 h coating time samples the carbon contents were 14.5 wt% and 20.8 wt%, with shell thicknesses of 1.5 nm ± 0.2 nm and 2.2 nm ± 0.5 nm, respectively. A representative HR-TEM image (figure 2(D)) shows regions with lattice fringes at different orientations indicating that the ND-Fe3O4@mC nanorods are polycrystalline. The lattice fringes have a d-spacing of 0.25 nm that corresponds to the (311) reflections for cubic Fe3O4 [34] (The transformation of the α-Fe2O3 precursor to cubic Fe3O4 was further confirmed using XRD (vide infra)).
Nitrogen sorption analysis was used to evaluate the porosity of the carbon shells for samples obtained with different coating times. The specific surface area, pore volume, and average pore diameter of the carbon shells are summarized in table S1. The corresponding isotherms (figures S3–S5) show a distinct hysteresis loop at high relative pressure, consistent with the materials being mesoporous [32]. Evaluation of ND-Fe3O4@mC-2 nanorods indicates that they possess porosity consisting of uniform mesopores with diameters ∼3.8 nm, a Brunauer–Emmett–Teller (BET) surface area of 121 m2 g−1, and a pore volume of 0.54 cm3 g−1.
Representative XRD patterns for ND-Fe3O4@mC-2 and α-Fe2O3 nanorods are shown in figure 3(A). The XRD pattern of the precursor nanorods can be indexed to α-Fe2O3 (JCPDS no. 89-8103) [35]. In contrast, the patterns obtained for ND-Fe3O4@mC-2, ND-Fe3O4@mC-4, and ND-Fe3O4@mC-12 nanorods are consistent with pure Fe3O4 (JCPDS no. 65-3107). Clearly the precursor α-Fe2O3 nanorods transform into the face-centered cubic, inverse spinel phase of magnetite upon thermal treatment [36]. The conspicuous absence of reflections arising from graphite in the XRD pattern confirms that the carbon layer is amorphous, which is consistent with the HR-TEM (vide supra) and Raman analysis (figure S6). The Raman spectra for all three samples show features at 1331 cm−1 and 1578 cm−1 that correspond to the D band and G band, respectively. The D band arises from the A1g breathing mode from sp3 carbon components, while the G peak corresponds to in-plane stretching of bonds involving sp2 carbon atoms [37].
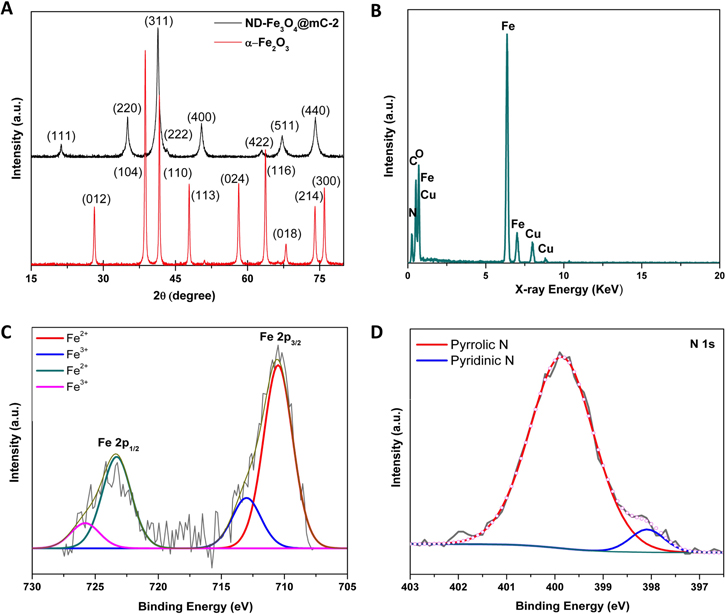
Figure 3. (A) Representative XRD patterns for ND-Fe3O4@mC-2 and α-Fe2O3 nanorods. (B) Representative EDX spectrum from ND-Fe3O4@mC-2 nanorods. (C), (D) High-resolution XP spectra from ND-Fe3O4@mC-2 nanorods for the (C) Fe 2p and (D) N 1s spectral regions.
Download figure:
Standard image High-resolution imageTo gain insight into the nanorod composition, samples were analyzed using EDX analysis and XPS. Representative EDX (figure 3(B)) and survey XPS spectra (figure S7) of ND-Fe3O4@mC-2 indicate the nanorods only contain N, C, O, and Fe at the sensitivity limit of these methods (the Cu signal arises from the sample support). The Fe 2p region of the high-resolution XPS spectrum provides the oxidation states of the Fe atoms in the nanorods (figure 3(C)). Peak deconvolution yields four components centered at 710.5 eV, 713.0 eV, 723.3 eV, and 725.8 eV; these components are confidently assigned to Fe3+ 2p3/2, Fe2+ 2p3/2, Fe2+ 2p1/2, and Fe3+ 2p1/2, respectively [38]. Of note, the XPS spectrum confirms the partial reduction of Fe3+ to Fe2+, due to thermal treatment, and is consistent with the formation of Fe3O4 [41]. The N 1s region of the high-resolution XPS spectrum for ND-Fe3O4@mC-2 (figure 3(D)) indicates there are two forms of nitrogen present—pyrrolic N (399.9 eV) and pyridinic N (398.1 eV) [39]. Both nitrogen sites are catalytically active in oxygen reduction [21]. In addition, the C 1s region of the high-resolution XPS spectrum shows three main components (figure S8) that are attributed to sp2 C–C (284.57 eV), C–O and C–N (285.45 eV), and C=N/C=O (288.2 eV ± 0.1 eV) [43].
To better understand the function of Fe3O4 nanorods and to clarify any synergistic ORR effects of combining a Fe3O4 core with a nitrogen doped carbon shell, 'bare' Fe3O4 nanorods and hollow carbon shells were prepared. Bare Fe3O4 nanorods were prepared by heating ND-Fe3O4@mC-2 at 300 °C for 30 min in air to remove the carbon coating. HR-TEM images (figures S9(A) and (B)) show no obvious carbon coating on the surface of the nanorods. The XRD pattern of the product obtained after heating in air (figure S9(C)) shows features associated with α-Fe2O3 and Fe3O4 consistent with some oxidation of the nanorods; however, Fe3O4 remains the dominant phase. As expected, TGA shows that the carbon content (figure S9(D)) for the bare Fe3O4 samples decreased substantially, i.e., 14.5 wt% for the ND-Fe3O4@mC-2 nanorods versus 1.5 wt% for the bare Fe3O4 nanorods.
ND-Fe3O4@mC-2 nanorods were also treated with 6 M HCl to dissolve the Fe3O4 core to obtain hollow carbon nanorod shells. HR-TEM images of samples obtained from the acid treatment (figure S10) reveal a collapsed structure. Still, the remaining carbon 'shell' is an excellent reference material for comparison with other carbon coated samples during electrochemical testing.
To evaluate the electrocatalytic activity of ND-Fe3O4@mC-2/CB, ND-Fe3O4@mC-4/CB, and ND-Fe3O4@mC-12/CB, CV curves were recorded in Ar- and O2-saturated 0.1 M KOH at a scan rate of 10 mV s−1. CV curves for the potential range of −0.7 – 0.4 V versus Hg/HgO are shown in figure 4(A). Featureless voltammograms were obtained for all the analyzes performed in Ar-saturated electrolyte. In contrast, an irreversible cathodic wave is present at ca. −0.26 V versus Hg/HgO in O2-saturated CV curves, which is consistent with ORR occurring for all the catalysts tested. The small peak appearing at ca. −0.5 V versus Hg/HgO for ND-Fe3O4@mC-2/CB corresponds to the reduction of ND-Fe3O4. This feature is not obvious for the other samples, presumably due to the thicker carbon shells. These observations are consistent with previous reports that carbon supports and/or coatings can hinder redox associated with degradation of Fe-based catalysts in alkaline conditions [44]. Closer examination of figure 4(A) reveals that ND-Fe3O4@mC-2/CB displays a more positive peak potential (−0.246 V versus Hg/HgO) and higher peak current density (−1.5 mA cm−2) than the catalysts with thicker carbon coatings (ND-Fe3O4@mC-4/CB and ND-Fe3O4@mC-12/CB). The exact origin of this behavior is not completely clear. However, shorter coating times (1–1.5 h) result in non-uniform carbon deposits, whereas thicker coatings obtained at longer coating times may block ion access to the active sites of Fe3O4 nanorods. The optimal coating time for Fe3O4 nanorods, for the conditions examined, is 2 h. To further evaluate the ORR catalytic activity of the Fe3O4 nanorods coated with nitrogen-doped mesoporous carbon (ND-Fe3O4@mC), LSV was performed using standard RDE methods. Figure 4(B) shows the voltammograms obtained for samples in O2-saturated, 0.1 M KOH at a scan rate and rotation speed of 10 mV s−1 and 1600 rpm, respectively. Consistent with the CV analysis (vide supra), ND-Fe3O4@mC-2/CB shows the most positive onset potential (i.e., 0.024 V versus Hg/HgO) and the highest diffusion-limited current density (il = −5.25 mA cm−2) (table 1). Tafel slope analysis of the three samples (i.e., ND-Fe3O4@mC-2/CB, ND-Fe3O4@mC-4/CB and ND-Fe3O4@mC-12/CB) was performed. Figure S11 shows that ND-Fe3O4@mC-2/CB has a slightly smaller Tafel slope compared with the other samples. This proves similar kinetic behavior of the samples (particularly in the low overpotential region). The Tafel slopes are also consistent with results reported for Fe3O4-based and Co3O4-based ORR catalysts [29, 45, 46].
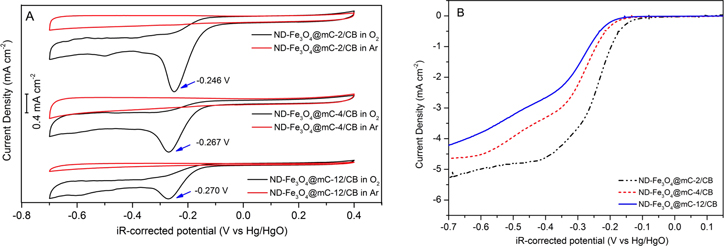
Figure 4. (A) CV curves for ND-Fe3O4@mC-2/CB, ND-Fe3O4@mC-4/CB, and ND-Fe3O4@mC-12/CB obtained at 10 mV s−1 in Ar- or O2-saturated, 0.1 M KOH. (B) LSV curves for ND-Fe3O4@mC-2/CB, ND-Fe3O4@mC-4/CB, and ND-Fe3O4@mC-12/CB obtained at 1600 rpm and 10 mV s−1.
Download figure:
Standard image High-resolution imageTable 1. Oxygen electrode catalyst activity.
| Catalyst | ORR onset potential (V versus Hg/HgO) | ORR il (mA cm−2) at −0.7 V | Average n |
|---|---|---|---|
| ND-Fe3O4@mC-2 | 0.024 | −5.25 | 3.72 |
| ND-Fe3O4@mC-4 | −0.027 | −4.63 | 3.59 |
| ND-Fe3O4@mC-12 | −0.121 | −4.19 | 3.36 |
| Bare Fe3O4 nanorods | −0.093 | −4.27 | 1.78 |
| ND-C nanoshells | −0.121 | −1.48 | 2.49 |
| 40 wt% Pt–C | 0.135 | −5.13 | 3.81 |
The kinetics of ND-Fe3O4@mC-2/CB catalyzed ORR were evaluated by comparing a series of (figure 5(A)) LSVs at 10 mV s−1 obtained at different electrode rotation rates. K–L plots for each sample are provided in figure 5(B) at various potentials. Applying the K–L equations (vide supra) [47], the average number of electrons transferred (n) at different potentials was determined to be close to four for ND-Fe3O4@mC-2/CB. Table S2 summarizes the electrochemical data for ND-Fe3O4@mC-2/CB and similar Fe oxide-based catalysts from the literature [28, 42, 44]. ND-Fe3O4@mC-2/CB has an onset potential (0.024 V versus Hg/HgO that is either more positive or comparable to the other catalysts, with the exception of Fe–Fe2O3/N-doped graphene (NGr) (0.075 V versus Hg/HgO) [21]. The limiting current density observed for ND-Fe3O4@mC-2 (5.25 mA cm−2) is very close to the limiting current density of the same catalyst (5.5 mA cm−2). It should be noted, however, that the mass loading was not reported for this ORR catalyst.
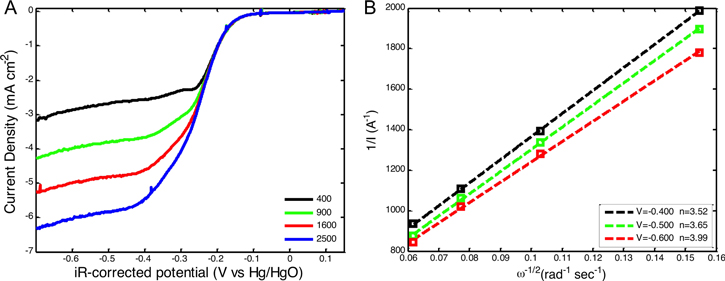
Figure 5. (A) LSV curves for ND-Fe3O4@mC-2/CB at electrode rotation speeds of 400, 900, 1600, and 2500 rpm for a scan rate of 10 mV s−1 in O2-saturated 0.1 M KOH. (B) Corresponding K–L plots at −0.4, −0.5 and −0.6 V for ND-Fe3O4@mC-2/CB.
Download figure:
Standard image High-resolution imageTo further investigate the ORR pathway and mechanism, the number of electron transferred was determined using K–L plots (figures 5 and S11). As expected, for metal-free and non-precious metal ORR electrocatalysts, ORR occurs mainly via a two-electron transfer process when ND-carbon shell catalysts are employed [48]. For ND-Fe3O4@mC/CB, the average number of electrons transferred during ORR (for the potential range of −0.4 to −0.7 V) increases with decreasing carbon coating time as presented in table 1.
To investigate the roles of the Fe3O4 and ND-C components for the ND-Fe3O4@mC-2 hybrid catalyst, bare Fe3O4 nanorods and ND-C shells were prepared (vide supra). LSV measurements were performed to evaluate the catalytic activity for bare Fe3O4 nanorods, ND-C shells, and 40 wt% Pt–C at different roation speeds; corresponding K–L plots were also obtained (figure S11). The LSV response for these three materials (with identical mass loading) was also compared with the LSV response for the Fe3O4@mC-2/CB hybrid (figure 6). The catalyzed electrochemical reduction of O2 on ND-Fe3O4@mC-2/CB occurs at a more positive onset potential (0.024 V) than that for the ND-C nanorods (−0.121 V) and the Fe3O4 nanorods (−0.093 V). The ORR onset potential is 111 mV more negative than the value for 40 wt% Pt–C, which is consistent with other studies [24, 26, 31]. It is worth noting that the more negative onset potential for ND-Fe3O4@mC-2/CB relative to 40 wt% Pt–C can be compensated when considering the abundance and lower cost of ND-Fe3O4@mC-2/CB.
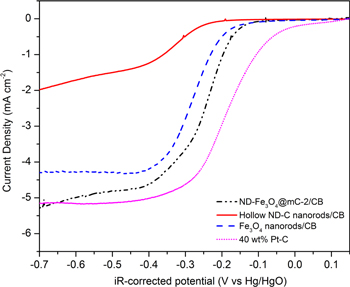
Figure 6. Representative LS voltammograms obtained for ND-Fe3O4@mC-2/CB, ND-carbon shells/CB, 'bare' Fe3O4 nanorods/CB, and 40 wt% Pt–C at 1600 rpm and 10 mV s−1 in O2-saturated, 0.1 M KOH.
Download figure:
Standard image High-resolution imageA comparison of the diffusion-limited current densities and the number of electrons transferred for ND-Fe3O4@mC-2/CB, Fe3O4 nanorods/CB, ND-C/CB, and Pt–C is provided in table 1. ND-Fe3O4@mC-2/CB exhibits a higher diffusion limiting current density (5.25 mA cm−2) than both the Fe3O4 nanorods/CB (4.27 mA cm−2) and ND-C/CB (1.48 mA cm−2). Furthermore, the diffusion limiting current for ND-Fe3O4@mC-2/CB is superior to that of 40 wt% Pt–C (5.13 mA cm−2). Table 1 also presents the number of electrons transferred during ORR based on K–L plots. There is a small variation in n, from 3.36 to 3.72, among ND-Fe3O4@mC-2/CB, ND-Fe3O4@mC-4/C,and ND-Fe3O4@mC-12/CB by varying the carbon shell thickness. The value of n follows the same trend as the limiting current density with n close to 4 for ND-Fe3O4@mC-2/CB.
The higher current density, more positive ORR onset potential and higher electron transfer number (∼4) observed for ND-Fe3O4@mC-2/CB relative to the separate materials is attributed to the combined influences of the Fe3O4 core and ND-carbon shell. ND-C provides protection of the Fe3O4 nanorods surface preserving the ORR active sites present on the surface of the nanorods. In addition, ND-C is a conductive surface modified with pyrrolic and pyridinic nitrogen, which explains the ORR synergistic effect of ND-C and Fe3O4 nanorods. Also, the larger pore radius of ND-Fe3O4@mC-2/CB (1.9 nm) compare to ND-Fe3O4@mC-4/CB and ND-Fe3O4@mC-12/CB based on the BET results may have a positive role by allowing more O2 access to the active sites of the nanorods.
To assess the short-term stability of ND-Fe3O4@mC-2/CB, the current-time chronoamperometric response was monitored in O2-saturated, 0.1 M KOH at a scan rate of 1600 rpm and −0.3 V versus Hg/HgO and compared with the response of the 40 wt% Pt–C catalyst (figure 7(A)). Continuous O2 reduction using ND-Fe3O4@mC-2/CB results in a 17% loss in the current density after 2000 s. Under identical conditions, the 40 wt% Pt–C catalyst showed a 20% decrease. Based upon these analyzes, the short term stability of ND-Fe3O4@mC-2/CB is slightly better than the 40 wt% Pt–C catalyst. To investigate the long-term performance of ND-Fe3O4@mC-2/CB, repetitive CV analysis was performed (−0.7 – 0.2 V versus Hg/HgO in O2-saturated, 0.1 M KOH) for 5000 cycles (25 h), A decrease in the ORR current density of ∼30% at the peak potential (−0.34 V) was noted after 500 cycles (figure 7(B)). However, the ORR current density and the onset potential do not change over the subsequent 4500 cycles, indicating excellent long-term ORR stability in the O2-saturated alkaline solution.

Figure 7. (A) Current–time (i–t) chronoamperometric responses for ND-Fe3O4@mC-2/CB and 40 wt% Pt–C at −0.3 V versus Hg/HgO at 1600 rpm. (B) CV curves for ND-Fe3O4@mC-2/CB cycled in O2-saturated, 0.1 M KOH at 100 mV s−1.
Download figure:
Standard image High-resolution image
It is generally accepted that the mechanisms and active sites associated with ORR behavior in Fe-oxide based catalysts is complex. We propose that the ORR activity of the ND-Fe3O4@mC system results from interplay between the properties of the Fe3O4 core and ND-C shell. While others have proposed that nitrogen centers on/in the nitrogen-doped carbon shell provide ORR active sites [44, 49], our evaluation of the ND-C shells suggests otherwise. The ND-C shells are active towards ORR due to the pyrrolic and pyridic nitrogen sites. Also, they to provide a conductive and high surface area hydrophilic catalytic surface [44, 50]. Evaluation of the bare Fe3O4 nanorods indicates they are the primary catalytically active component of the present system. After etching the Fe3O4 core, the current density dropped by 71.8%, which explains the important role of Fe3O4 nanorods in oxygen chemisorption and the reduction of the ORR activation energy [29].
The present study indicates that activity depends on the thickness of the ND-C coating. Thicker carbon layers (5 ± 0.5 nm and 2.2 ± 0.5 nm) diminish catalyst effectiveness consistent with ORR active sites on the Fe3O4 surface being blocked. Very thin carbon layers (<1.5 ± 0.2 nm) increase the chance of Fe3O4 nanoparticle agglomeration, are non-uniform, and have poor catalytic performance. For the present hybrid system, the optimal thickness is 1.5 nm obtained after 2 h; this is one of the thinnest layers reported.
4. Conclusions
A new microwave assisted method has been developed that provides well-defined α-Fe2O3 nanorods that are readily coated with controlled thicknesses of polydopamine via straightforward solution methods. Upon thermal treatment in flowing Ar, the polydopamine-coated nanorods are effectively converted to nitrogen doped mesoporous carbon-coated (ND-C) Fe3O4 nanorods. Throughout the entire process the morphology of the nanorods is preserved. The resulting hybrid materials show promise as catalysts for the ORR and provide insight into the synergistic impact of the Fe3O4/ND-C pairing and the importance of carbon shell thickness. Finally, the optimal system (ND-Fe3O4@mC-2–2 h of coating time) performed as well or better than commercial 40 wt% Pt–C catalysts with only 111 mV more negative ORR onset potential and superior limiting current density.
Acknowledgments
The authors recognize the Natural Sciences and Engineering Council of Canada (NSERC) and Alberta Innovates Technology Futures (AITF) for continued generous support. JV and LH recognize financial contributions from the ATUMS training program supported by NSERC CREATE and DFG IRTG (IRTG 2022) programs. Dr T Purkait and C Gonzalez are thanked for valuable discussions. K Cui (NRC-NINT) is acknowledged for assistance with HR-TEM measurements. D Caird and A Y Mahmoud are thanked for assistance with XRD and Raman measurements, respectively.