

Abstract
In recent years, the development of electronic skin and smart wearable body sensors has put forward high requirements for flexible pressure sensors with high sensitivity and large linear measuring range. However, it turns out to be difficult to increase both of them simultaneously. In this paper, a flexible capacitive pressure sensor based on a porous carbon conductive paste-polydimethylsiloxane composite is reported, the sensitivity and the linear measuring range of which were developed using multiple methods including adjusting the stiffness of the dielectric layer material, fabricating a microstructure and increasing the dielectric permittivity of the dielectric layer. The capacitive pressure sensor reported here has a relatively high sensitivity of 1.1 kPa−1 and a large linear measuring range of 10 kPa, making the product of the sensitivity and linear measuring range 11, which is higher than that of the most reported capacitive pressure sensors to our best knowledge. The sensor has a detection of limit of 4 Pa, response time of 60 ms and great stability. Some potential applications of the sensor were demonstrated, such as arterial pulse wave measuring and breath measuring, which shows it as a promising candidate for wearable biomedical devices. In addition, a pressure sensor array based on the material was also fabricated and it could identify objects in the shape of different letters clearly, which shows promising application in future electronic skins.
Export citation and abstract BibTeX RIS
1. Introduction
Pressure sensors with flexible and wearable characteristics have shown great potential applications in healthcare monitoring [1] and smart robotics [2]. In recent years, the flexible sensors for electronic skin and wearable electric devices have developed rapidly. A variety of flexible pressure sensors based on different principles have been explored including piezoelectric [3–6], piezoresistive [7–13] and capacitive effects [14–25]. Compared with other techniques, a capacitive sensor has many superiorities, such as lower power consumption and temperature drift, which makes it very suitable for wearable electronic devices and other consumer electronics which require low power consumption.
Sensitivity which is a key performance parameter of a pressure sensor has been greatly developed in recent works [14, 16, 18, 26–29]. For a capacitive pressure sensor, the capacitance of which is changed by the deformation of the sandwiched flexible dielectric layer, the sensitivity is normally dependent on the flexibility of the sandwiched soft dielectric layer. Two main methods to increase the flexibility are often used. One, to use material with a low Young's modulus, and the other was to modify the mechanical properties by using micro-structured dielectric materials [14]. Pyramid microstructure [14, 30–33], porous structure based on nano-fiber dielectric material [16] and dielectric elastomer film with micropores [34–36] have often been used to improve the sensitivity. However, the linear measuring range of sensor, which is also an important performance parameter of a sensor, was decreased in most of the work, causing sharp performance degradation for large pressure [37]. Increasing both sensitivity and linear measuring range of a capacitive pressure sensor simultaneously turns out to be difficult.
As we know, the capacitance is also proportional to the relative permittivity of the dielectric layer according the capacitance formula. Thus, the increase of relative permittivity during pressing can also contribute to the capacitance variation and then the sensitivity of a capacitive sensor without decreasing the linear measuring range, which means both sensitivity and linear measuring range could be developed with appropriate parameters. The dielectric layer with a porous structure can be considered as a composite of air and dielectric material. Because the air in the porosities can be squeezed out, the average relative permittivity of the dielectric layer can increase during pressing. However, as dielectric materials such as polyurethane, polydimethylsiloxane (PDMS) and Ecoflex, have a similar low ε (dielectric permittivity) compared with that of the air, the average ε of the composite of the air and the dielectric material increases very little during the pressing process. Thus, the change of the distance between two electrodes becomes the dominant factor with regard to capacitance changes upon loading. Thus, to solve this problem, the increase of the relative permittivity of the dielectric material is an effective method. To increase the relative permittivity of the dielectric material, nanoparticles such as carbon nanoparticles are often mixed into the dielectric material [29, 38]. However, the nanoparticles could increase the rigidity of the material and decrease the sensitivity of the sensor [38]. A further solution to decreasing the rigidity is required.
In this paper, all the three methods were used for increasing both the sensitivity and the linear measuring range of the capacitive pressure sensor. The effects of the three methods were analyzed theoretically and demonstrated experimentally. The dielectric layer of the capacitive pressure sensor was made of porous polydimethylsiloxane-carbon conductive paste (PDMS-CCP) composite which was soft and flexible. The dielectric permittivity was increased by the conductive carbon nanoparticles in CCP, while the composite was softened by the synthetic oil in the CCP. Porous structure was formed by dissolving sodium chloride (NaCl) microparticles mixed in the PDMS-CCP composite. The pressure sensor has various great properties including a relatively high sensitivity of 1.1 kPa−1 and a large linear measuring range of 10 kPa. The product of the sensitivity and linear measuring range is about 11 which is greater than those of the reported capacitive pressure sensor. The sensor possesses a low detection of limit (LOD) of 4 Pa and a response time below 60 ms. The sensor was able to remain stable for at least 11 000 pressure cycles of 0.4 kPa. Due to its unique properties, the flexible pressure sensor has a wide application. Applications of measuring breathing and pulse were demonstrated. In addition, a pressure sensor array based on the dielectric layer was fabricated and it can identify letters clearly.
2. Principle and manufacture
2.1. Principle of increasing the sensitivity
To obtain a flexible pressure sensor with high sensitivity and large linear measuring range, multiple methods have been used. Figure 1 shows the principle of increasing the sensitivity and linear measuring range of a sensor based on PDMS-CCP composite. The dielectric material was fabricated by mixing the PDMS and CCP (MG Chemicals; contains: 80.0% synthetic oil, 19.9% carbon nanoparticles and 0.1% amorphous fumed silica). The synthetic oil in the CCP is used to make the PDMS [7] softer, which can compensate the rigidity increment caused by mixed solid nanoparticles. In addition, the porous structure could largely decrease the compression modulus, which can increase the change in distance between two electrodes when the sensor is under pressure. The carbon nanoparticles can increase the permittivity of the dielectric material, and the porous structure and large permittivity can contribute to the permittivity change of the dielectric layer when pressure is applied. Thus, the sensitivity could be increased without decreasing the linear measuring range.
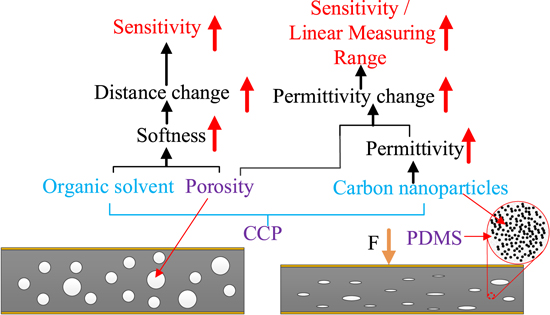
Figure 1. The principle of increasing the sensitivity of the sensor based on PDMS and carbon conductive paste (CCP) composite material.
Download figure:
Standard image High-resolution image2.2. Reagent and material
The PDMS used in this experiment was from Sigma-Aldrich (USA) Trading Co. Ltd. The carbon conductive paste was from MG Chemicals (Germany). NaCl, isopropanol and acetone were purchased from Sinopharm Chemical Reagent Co., Ltd (Beijing, China). The reagents were of analytical reagent grade and were used as received. The measurements were carried out at 25 ± 1 °C, unless stated otherwise.
2.3. Manufacturing process
The flexible pressure sensor was fabricated utilizing the molding and dissolving techniques. The manufacturing process is shown in figures 2(A)–(E). The preparation of porous dielectric layer is the key step. Firstly, PDMS, CCP and NaCl powder (as the sacrifice) were mixed thoroughly for 20 min by a blender at a speed of 500 rpm, and then poured into a 10 mm × 10 mm × 1 mm cuboid mold. The diameter of a carbon nanoparticle is 60 nm–100 nm while the diameter of a NaCl particle is about 100 μm–300 μm. After curing the sample on the hotplate (Thermo Fisher Scientific, USA) under 90 °C for 1 h, a PDMS-CCP composite with NaCl particles was obtained. Then the sample was immersed into water to dissolve the NaCl particles to get the final porous dielectric layer, followed by putting it into the vacuum drying oven to remove the remaining water. In order to accelerate the dissolution of the NaCl particle, we squeezed the sample repeatedly while it was in the water. Double-sided conductive copper tape with the thickness of 50 μm was finally pasted onto the both sides of the dielectric layer as electrodes. Figure 2(F) shows a photograph of the dielectric layer with the size of 10 mm × 10 mm × 1 mm.
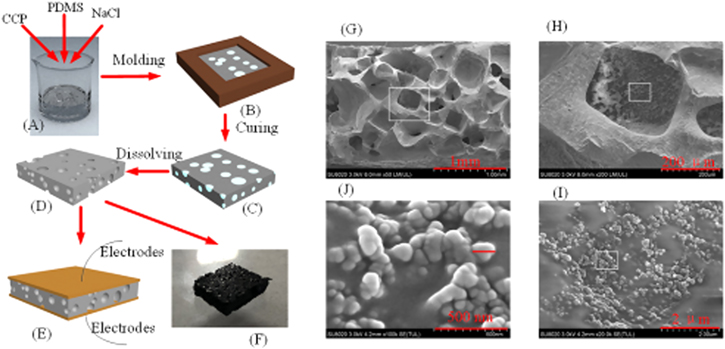
Figure 2. The manufacturing process of the sensor (A)–(E): (A) mixing PDMS, CCP and NaCl powder; (B) molding the dielectric layer; (C) curing the dielectric layer and removing it from the mold; (D) dissolving the NaCl particles; (E) adding the copper paste as the electrodes; (F) an image of the dielectric layer. (G)–(J) shows the (SEM) images of the cross section of the dielectric layer.
Download figure:
Standard image High-resolution imageScanning electron microscopy (SEM) images of the cutting cross section of the dielectric layer are shown in the figures 2(G)–(J). It can be seen that the irregularly-shaped micropores with the size of 100 μm–300 μm were formed by dissolving the NaCl microparticles (figures 2(G), (H)). The microstructure made the dielectric layer much softer than the solid PDMS and a movie of pressing the dielectric layer is available online supplementary materials (movie S1, stacks.iop.org/NANO/30/455501/mmedia). The carbon nanoparticles, which are conductive nanoparticles with the size of 60 nm–100 nm, are embedded in the PDMS (figures 2(I), (J)), which could increase the dielectric permittivity.
3. Result and discussion
3.1. Material properties
Pressure-strain properties were measured using a universal testing machine (Shimadzu, Japan). Figure 3(A) shows the pressure-strain curves of the PDMS, PDMS/synthetic oil (20%), porous PDMS (fabricated using the same process shown in section 2.3) and porous PDMS/CCP. The porosities of the porous PDMS and porous PDMS-CCP were the same. The porosity was estimated using the volume ratio of NaCl and composite and the volume of NaCl was calculated using mass divided by density (2.165 g cm−3). It shows that when an identical pressure was applied to the samples, the strain of the PDMS is the minimum while the strain of the porous PDMS-CCP is maximum. By comparing the curves of the PDMS and PDMS/synthetic oil, we can see that the synthetic oil can decrease the Young's modulus. Figure 3(B) shows the pressure-strain curves of dielectric materials with different concentrations of NaCl powder which means different porosities. It indicates that the modulus can be tuned by changing the porosity using different concentrations of NaCl particles. The reciprocal of Young's modulus has a positive relation with the sensitivity of the sensor and it was greatly increased when the porosity was increased (figure 3(D)). The relationship between the reciprocal of Young's modulus and porosity was also simulated using COMSOL. Figure 3(C) shows simulation results and figure 3(D) shows that the experimental results agree with the simulated results. Therefore, we can concluded that porous structure can decrease the modulus and then increase the sensitivity of the sensor, which is the most common strategy for sensitivity enhancement. However, this strategy can decrease the linear measuring range [16] making it tricky to increase the sensitivity without decreasing the linear measuring range. As described above, the capacitance is also proportional to the relative permittivity of the dielectric layer. Thus, the increase of relative permittivity during the pressing can also lead to the increase of the capacitance variation and then the sensitivity of a capacitive sensor without decreasing the linear measuring range. Therefore, increasing permittivity of the dielectric material could be adopted for increasing both the sensitivity and linear measuring range. We simulated the sensitivities of capacitive pressure sensors with the porosities of 33% and 66% when the dielectric material possesses different permittivities (2.75 for the permittivity of pure PDMS while 5.75 for PDMS-CCP). It indicates that the sensitivity was increased without decreasing the linear measuring range when the permittivity of the dielectric material was increased.
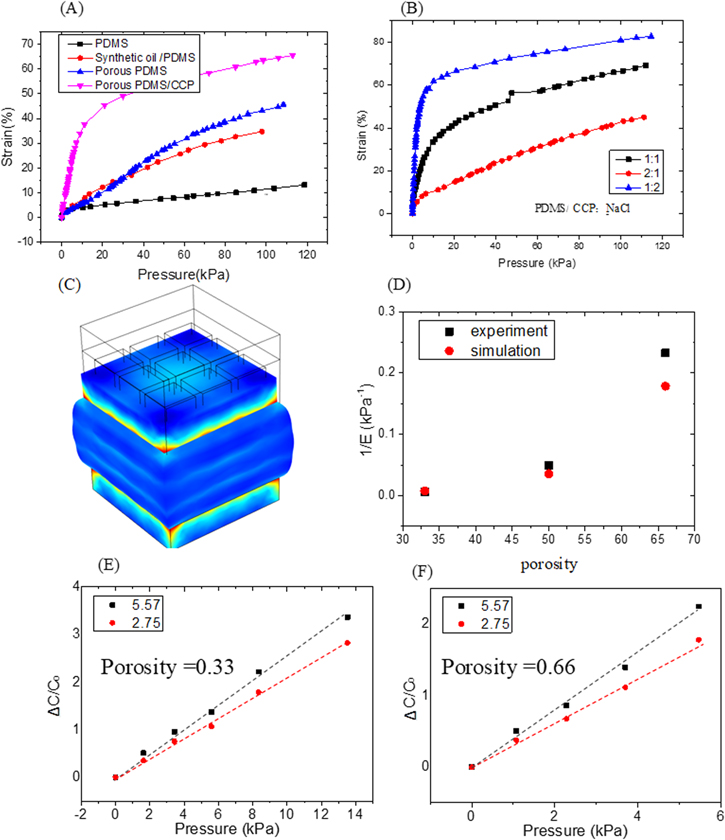
Figure 3. (A) Pressure-strain curves of the PDMS, porous PDMS and porous PDMS-CCP; (B) pressure-strain curves of dielectric materials with different concentrations of NaCl powder as sacrifice; (C) a simulation result of pressing on the porous dielectric layer; (D) simulated results and experimental results of the reciprocal of Young's modulus against porosity of the dielectric layer. (E) Simulated relative capacitance changes in response to pressure when the material possesses relative permittivity of 2.75 and 5.75 (porosity of 0.33). (F) Simulated relative capacitance changes in response to pressure when the material possesses relative permittivity of 2.75 and 5.75 (porosity of 0.66).
Download figure:
Standard image High-resolution imageTo increase the permittivity, conductive nanoparticles were often used, but they could increase the rigidity of the dielectric material [38] and decrease the sensitivity. Thus, we used CCP instead of the carbon nanoparticles. The comparison of the results of porous PDMS-CCP and porous PDMS in figure 3(A) indicates that the CCP (actually the synthetic oil in the CCP) can soften the dielectric layer greatly, because the synthetic oil acts as a plasticizer of the composite. When the synthetic oil is mixed into the PDMS, the small molecules of the plasticizer are inserted into the polymer molecular chains. The distance between the polymer molecules in the chains is increased and thus the attraction force between the chains is weakened which results in softening of the material (figure 4).
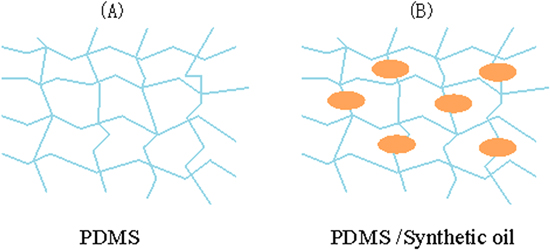
Figure 4. The principle of decreasing the Young's modulus by mixing the PDMS and synthetic oil.
Download figure:
Standard image High-resolution imageThe permittivity variation was studied when different concentrations of CCP were used and the results are shown in the figure 5 (the measuring and calculating methods are shown in the supplementary materials). With a CCP concentration below 0.31, the permittivity of the dielectric layer increases as the concentration of CCP increases, as shown in the green area of figure 5. When the concentration is above 0.33, the material becomes conductive (purple area in figure 5). The results can be explained as follows: inside the composite, micro capacitors are formed between the polymer and the conductive particles. Thus, the conductive particles act as the electrodes of the micro capacitors while the polymer acts as the dielectric layer. When the volume fraction of conductive particles increases, the number of micro capacitances increases or the distance between the electrodes is reduced. Therefore, the dielectric permittivity increases within a certain volume fraction of the conductive particles. However, when the concentration of the conductive particles continues increasing, the conductive particles may form conductive paths causing the composite to be conductive. 0.3 was used as the final concentration of CCP.
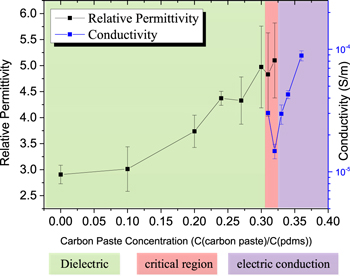
Figure 5. Relationship between the dielectric material character and the CCP concentration. When the concentration of CCP is below 0.31 (in the green area), the material tends to be a dielectric layer with ultralow conductivity and permittivity increment. Above 0.33, in the purple area, the conductivity increases sharply. Between 0.31 and 0.33 (in the red area), the material could be either dielectric or conductive.
Download figure:
Standard image High-resolution image3.2. Performance of the sensor
The performance of the capacitive pressure sensor was tested. The pressure was applied by placing a PDMS cube of certain weight onto the sensor, and the weight was measure by electronic analytical balance with precision of 0.01% (Lichen, China). The applied pressure can be calculated by the equation of P = Mg/A, where M is the mass of the PDMS cube, g is the gravitational acceleration (9.81) and A is the stressed area of the pressure sensor. Figure 6(A) shows the relative capacitive change of the pressure sensors measured by the digital Lock-in Amplifier (Zurich Instruments, Switzerland) when external pressure was applied.
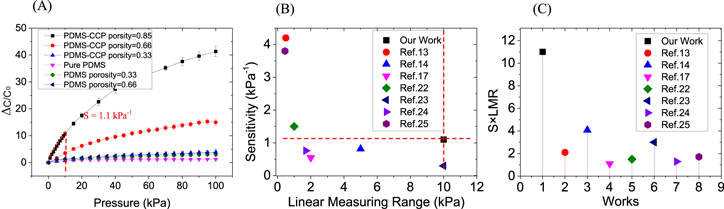
Figure 6. (A) Plot of the relative capacitance changes in response to external pressure. (B) and (C) Performance comparison with previous reports.
Download figure:
Standard image High-resolution imageThe sensitivity is defined as S = (ΔC/C0)/P, where ΔC is the variation of capacitance, C0 is the initial capacitance and P presents the applied pressure which equals F/A, where F is the force applied on the pressure sensor and A is the stressed area of the pressure sensor. We can see that PDMS-CCP with the porosity of 85% possesses the highest sensitivity. The sensitivity of this pressure sensor was 1.1 kPa−1 (0.4 kPa−1 for high pressure) and the linear measuring range was as large as 10 kPa. We compared the parameters with those of the last works (figures 6(B) and (C)), and the result shows that the sensor has a sensitivity of the same order of magnitude as the top ones and an outstanding linear measuring range. The product of the sensitivity and the linear measuring range (S × LMR), which is a parameter to define the combined performance of the sensitivity and the linear measuring range for a sensor, is 11 which is much higher than that of other works to the best of our knowledge.
Other performances were also tested and the result are shown in figure 7. A distinct signal response could be seen when a 0.04 g spitball was put on and taken off, which indicated that the LOD was below 4 Pa (figure 7(A)). The rising time of the sensor was 60 ms and the falling time was 120 ms (figure 7(B)). To examine the durability of capacitive sensors, the capacitance variation was measured over 11 000 loading–unloading cycles at a frequency of 2.7 Hz under pressure of 0.4 kPa. The result is shown in the figure 7(C) and it indicates excellent reproducibility and durability without obviously changing.

Figure 7. (A) The response of the pressure sensor when a 0.04 g spitball was put on and taken off. (B) The response time of the pressure sensor under an applied pressure of 0.4 kPa. (C) The cycling test of the pressure sensor over 11 000 loading–unloading cycles at a frequency of 2.7 Hz under pressure of 0.4 kPa.
Download figure:
Standard image High-resolution imageSince the sensor was supposed to be used for wearable applications, the effect of bending the fabricated device was also studied. The relative capacitive changes as the sensor was bend at angles from 0 to 90 degrees, as shown in the figure 8. We can see that the maximum relative capacitive change is 0.1 when the sensor was bent at the angle of 90 degree, which shows that the effect of bending is quite low.
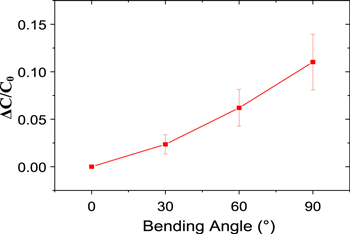
Figure 8. The relative capacitive changes as the sensor was bent at angles from 0 to 90 degrees.
Download figure:
Standard image High-resolution image3.3. Applications
Arterial pulse is an important process of traditional Chinese medicine. The waveform of arterial pulsation is considered as an indicator for diagnosis of several diseases, such as diabetes [39] and cardiovascular diseases. Figure 9 displays arterial pulses monitored for 11 s. The three peaks (Ps, Pi, and PD) can be identified, which is an indication of a possible future application in medical monitoring devices. According to the obtained signal, the heart beating rate is 80 per minutes. Obstructive sleep apnea syndrome (OSAS) directly relates to human respiration, which 20%–40% of elderly people suffer from [40]. The OSAS can be diagnosed by monitoring the respiration continuously, which flexible sensors are perfect for. Figure 10(A) shows the results of monitoring natural breathing and figure 10(B) shows the results of monitoring blowing from the mouth. It shows that the sensor can distinguish different kinds of breathing clearly and thus be used as miniaturized flexible respiration monitor.
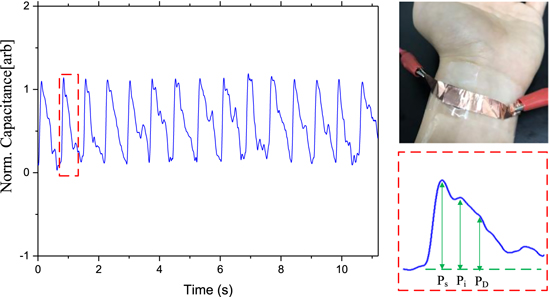
Figure 9. The arterial pulse wave on the wrist and the close-up view of one cycle showing three peaks: systolic (Ps), inflection (Pi), dicrotic (PD) peaks.
Download figure:
Standard image High-resolution image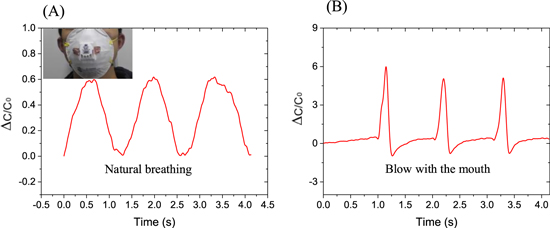
Figure 10. The different responses of the sensor when testing natural breathing and hard blowing from with mouth. The inset showing the photograph of the pressure sensor assembled on a mask for breathing testing.
Download figure:
Standard image High-resolution image3.4. Sensor array for shape measuring
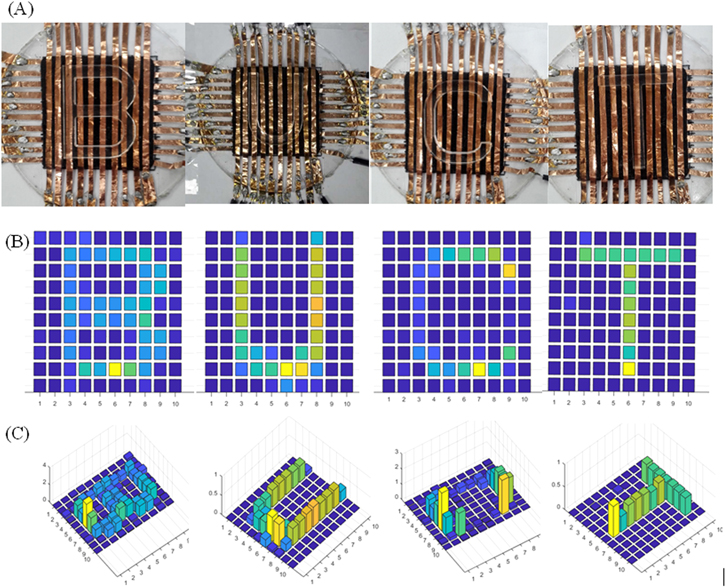
To further demonstrate the function of an e-skin, a 100 pixels (10 × 10) pressure sensor matrix array was also fabricated based on the dielectric layer to measure the pressure distribution. The pressure sensor array comprised of top electrodes, bottom electrodes and the dielectric layer. The size of each pixel was about size of 3 mm × 3 mm. Figure 11(A) shows the photographs of the sensor array. The testing circuit is shown in the figure S1. When 'B' 'U' 'C' 'T'-shaped PMMA pieces were placed on the sensor array (figure 11(A)), the color maps, which indicate the pressure distribution, are consistent with the shape of the letters 'B' 'U' 'C' 'T' (figure 11(A)). To demonstrate them more clearly, the results are also illustrated in 3D view (figure 11(C)). It can be seen that the sensor can sense the shape of an object just as a finger skin of human.
Figure 11. (A) The images of the array sensors and experiments of sensing the 'B' 'U' 'C' 'T'; (B) detecting results of the letters of 'B' 'U' 'C' 'T' ; (C) detecting results of the letters of 'B' 'U' 'C' 'T' in 3D view.
Download figure:
Standard image High-resolution image
4. Conclusion
In summary, we have demonstrated a capacitive pressure sensor with relatively high sensitivity and large linear measuring range, both of which are important parameters of a sensor. They were improved by combing three methods based on both the PDMS-CCP composite material and the porous structure. The reasons why PDMS-CCP composite material with porous structure can increase the sensitivity and linear measuring range from three aspects were described and verified experimentally. The performance of the sensor was tested and the sensitivity of the sensor is 1.1 kPa−1 which is the same order of magnitude as the previous reports, and the linear measuring range of the sensor is 10 kPa which is among the top ones. The product of the sensitivity and linear measuring range is 11 which is higher than other reports. The sensor also has a LOD as low as 4 Pa. Furthermore, some applications of the sensor were demonstrated. Arterial pulse waves and breathing can be monitored by the sensor continually, which indicates that the sensor can be used for wearable medical monitoring devices. Finally, array sensors based on the composite were shown to measure the shape of an object just like a finger can.
Acknowledgments
This research was funded by the research fund to the top scientific and technological innovation team from Beijing University of Chemical Technology (No. buctylkjcx06), the Central University Fund of China (buctrc201814) and the Fundamental Research Funds for the Central Universities (XK1802-4).