

Abstract
This paper presents an experimental study of the dynamic performance of a self-developed shear thickening fluid (STF) damper and its mechanical model was proposed by nonlinear fitting. First, STF samples with different mass fraction and dispersion medium were fabricated by nano fumed silica and polyethylene glycol, and its rheological properties were investigated by a rheometer. Second, a smart STF damper was developed and manufactured. Its dynamic properties were experimentally investigated by establishing a vibration test bench, and results indicated that the STF damper can output variable damping force by controlling the loading frequency, loading amplitude and fluid gap. Third, the Bouc–Wen model was proposed to address the dynamic properties of STF damper, and mechanical model analysis was carried out by comparing several fitting functions. It verified that the Bouc–Wen hysteresis model can be better used to describe the nonlinear stiffness, nonlinear damping and rate-dependence characteristics of the STF damper. All these investigations can offer an effective guidance for further theoretical and application study of the smart STF damper in energy dissipation fields.
Export citation and abstract BibTeX RIS
1. Introduction
Shear thickening fluid (STF) as a kind of smart material has drawn widely attention due to its strong nonlinear characteristics of the abrupt increase in viscosity with shear rate. In the past two decades, a mount of research on STF have been investigated, which mainly includes three aspects: shear thickening mechanism, rheological behavior, and its application study. The shear thickening mechanism is typically attributed to hydrodynamic clustering effects [1, 2].
Rheological behavior research has been conducted sufficiently under steady shear flow [3], oscillatory shear flow [4, 5] and squeeze flow [6] in the past. In addition, it also includes influence factor analysis, such as: particle size, suspension concentration, pH value, additive and surfactant, temperature, etc. Research in this area is also sufficient and the rheological performance of STF can be tuned through these factors. Among them, Olhero et al [7] demonstrated that the viscosity of suspensions increased with the addition of fine particles, and increasing the size ratio can enhance the shear thinning character, while decreasing it led to an accentuation of the shear thickening behavior. The increase in pH of the addition shifts the onset of shear thickening to higher shear stresses [8]. Huang et al [9] pointed out that the addition of a small amount of grapheme oxide into silica/PEG-based STFs can lead to remarkable increase of viscosity, enhance the materials' storage modulus and shift of the shear thickening onset towards lower shear rate. Temperature tests showed that a high temperature increased the critical shear rate and lowered the shear thickening ratio [10]. These investigations of influence factor analysis can offer a good guidance in preparation of STF with better rheological properties.
The other important aspect is the application of STF as a type of smart material with controllable damping characteristic. With the further study of STF, it is necessary to pay great attention to its impact resistance. STF is gradually used in the manufacture of protective devices and has been applied in the military field [11–15], which has considerable application value in individual protection [16, 17]. In recent years, the researchers all over the world continue to explore the STF as a new type of functional materials in the application of damping control device such as shock absorber [18–22].
The STF-based energy dissipation device features simple structure, passive power, adaptive. Some damping and control devices have been developed. Fischer et al [18] integrated STFs into composite sandwich structures with the aim of tuning part stiffness and damping capacity under dynamic deformation. Zhang et al [19] fabricated a prototype STF-filled damper and experimentally evaluated its dynamic performances and also developed an equivalent linear model through effective elastic stiffness and viscous damping. Zhou et al [21] also fabricated a novel prototype STF damper and proposed a nonlinear model composed of an equivalent linear stiffness and a power-law viscous damping term, it agreed well with the nonlinear performance of STF damper. Yeh et al [22] studied the dynamic performance of a STF viscous damper by performing a cyclic loading test. All the research and analytical model studies showed that STF-filled dampers are potentially useful in practical engineering applications.
The paper is presented in the following manner: the introduction is followed by detailed fabrication process, rheological properties and the main influence factor analysis of the STF samples in section 2. Section 3 outlines the structure design and working principle of the smart STF damper, and investigates its controllable damping performance by establishing a vibration test bench. Section 4 develops a theoretical model for describing the frequency-shift performance of the STF damper and gives a comparison between several models. Conclusions are drawn in section 5.
2. Fabrication process and rheological behaviors of STF
2.1. Fabrication process of STF
The STF suspensions in this study were based on fumed silica which has a primary particle size of 30 nm (from Aladdin Industrial Corporation, America), and its carrier fluid was PEG (H(OCH2CH2)nOH) with an average molecular weight of 200 g mol−1 (from Shanghai Hushi Laboratorial Equipment Corporation, China). In the preparation process, carrier fluid was added to fumed silica power many times in order to avoid agglomeration of particles. Magnetic stirring was used to mix the two components when the suspension is in low viscosity, however, mechanical stirring must be used instead of magnetic stirring when it is in high viscosity. A constant temperature water bath was necessary in order to accelerate dissolution in fabrication process. After stirring uniformly, suspensions were then placed in a vacuum chamber for several times to eliminate any bubbles.
In order to study the effect of concentration for dispersed phase, STF samples with mass fraction of 20% ∼ 27% w/w were prepared. Additionally, to investigate the effect of dispersion medium, the carrier fluids PEG 200 and PEG 400 were also adopted. Figure 1 shows some prepared STF samples. Eight samples were selected for experiment in this study, and its proportions are listed in table 1.
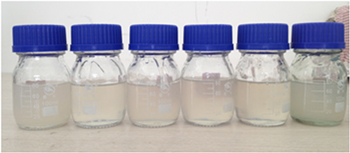
Figure 1. Partial prepared STF samples.
Download figure:
Standard image High-resolution imageTable 1. Raw materials and proportion of the STF samples.
| Sample number | Dispersed phase | Particle size/nm | Dispersion medium | Mass fraction |
|---|---|---|---|---|
| 1 | Silica dioxide | 30 | PEG200 | 20% |
| 2 | Silica dioxide | 30 | PEG400 | 20% |
| 3 | Silica dioxide | 30 | PEG200 | 23% |
| 4 | Silica dioxide | 30 | PEG400 | 23% |
| 5 | Silica dioxide | 30 | PEG200 + PEG400 | 23% |
| 6 | Silica dioxide | 30 + 15 | PEG200 | 23% |
| 7 | Silica dioxide | 30 | PEG200 | 25% |
| 8 | Silica dioxide | 30 | PEG200 | 27% |
It is worth mentioning that the sedimentation and stability of STF is a tricky problem in practical application. The STF used in this study was relatively stable since it was produced recently. In real application, it is recommended to obtain the best ratio through experiments to ensure the best density matching in fabrication process. In addition, surfactant or stabilizer can be added to make the solution more stable even after a long time.
2.2. Rheological behaviors of STF
In this subsection, rheological properties of the STF samples under both static and dynamic loading conditions were investigated by using a stress-control parallel-plate rheometer (TA instruments, America), as shown in figure 2. The diameter of parallel plate is 20 mm and the thickness is set as 1 mm.
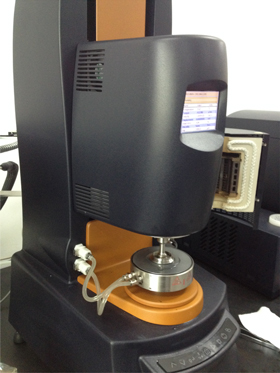
Figure 2. The TA stress-control rheometer.
Download figure:
Standard image High-resolution imageFor description of rheological characteristics, experimental results of viscosity curves and flow curves were shown in figure 3. Figures 3(a) and (b) shows the viscosity as a function of shear rate and the stress as a function of shear rate for STF samples, respectively. It can be seen that the STF exhibits shear thickening behavior, with its viscosity showing an abrupt jump when the shear rate is higher than a critical value. As illustrated in the flow curve in figure 3(b), the stress shows rapid growth with the increase in shear rate.
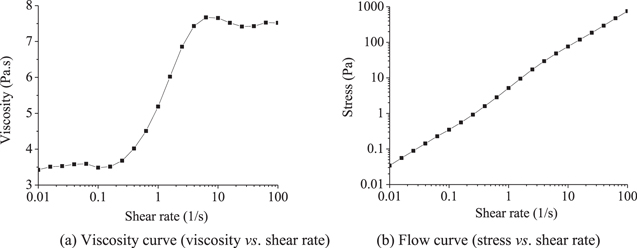
Figure 3. Rheological behavior of the prepared STF sample.
Download figure:
Standard image High-resolution imageMass fraction, that is the concentration of dispersed phase, is a main factor to determine the rheological behavior of STF. The STF samples 1, 3, 7 and 8 with the mass fraction of 20%, 23%, 25% and 27% w/w, respectively, were selected to investigate the effect of mass fraction on rheological behavior, which have the same dispersed phase and carrier fluid. As shown in figure 4(a), the shear thickening performance is not obvious when the mass fraction is 20%; however, it is obvious when the mass fraction reaches into 23%. In this case, the initial off-state viscosity (that means the initial viscosity of STF at zero shear rate field) and maximum viscosity increase obviously, the shear thickening effect is strengthen and the critical shear rate moves forward obviously with the increasing mass fraction, that means the shear thickening phenomenon appears at a smaller critical shear rate. When the mass fraction reaches 30%, the shear thickening appears at a narrow range, and then shear thinning phenomenon is presented. Thus, the optimum concentration is 23% ∼ 30% in the conditions of this study. The flow curves comparing different mass fraction were as illustrated in figure 4(b), it is found that the stress shows more rapidly growth with the increasing mass fraction. It also demonstrated that the viscosity and stress increase and the critical shear rate decreases with the increasing mass fraction of STF.
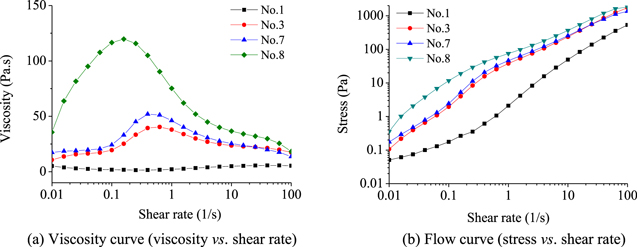
Figure 4. Rheological behavior of STF with different mass fraction.
Download figure:
Standard image High-resolution imageDispersion medium is another important influence factor for rheological behavior of STF. The samples 3, 4 and 5, which take the PEG200, PEG400 and PEG200 + PEG400 as dispersion medium, respectively, were selected for investigating the effect of dispersion medium on rheological behavior. From the rheological test, it shown that the maximum viscosity of the three samples is 40 Pa s, 134 Pa s and 42 Pa s, the maximum stress is 1737 Pa, 1617 Pa and 1690 Pa, respectively. It demonstrated that the viscosity and stress increase and the critical shear rate decreases with the increasing average molecular weight of dispersion medium. As illustrated in figure 5, the higher viscosity can be obtained and the critical shear rate moves forward by taking PEG400 as dispersion medium. However, the viscosity is not increased by taking the mixture of PEG 200 and PEG 400 as dispersion medium.
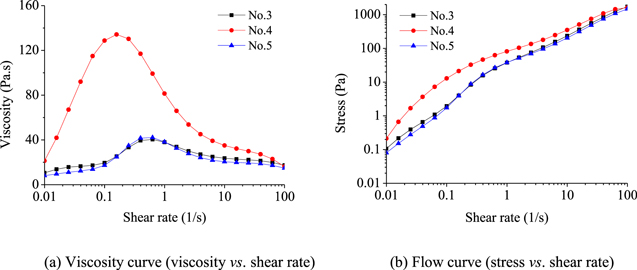
Figure 5. Rheological behavior of STF with different dispersion medium.
Download figure:
Standard image High-resolution imageIn figures 4 and 5, the viscosity of No.4 and No.8 STF suspensions is relative higher due to the higher mass fraction (the No.8 STF with 27% w/w) and the higher average molecular weight of dispersion medium (the No.4 STF with PEG400). When the mass fraction increased above a critical value, the peak viscosity drastically grew. This corresponds to a higher off-state viscosity and a minimum critical shear rate, which caused the apparent discontinuous shear thickening phenomenon present directly.
It's worth noting that the shear thinning phenomenon after shear thickening range may be an artifact which caused by sample loss due centrifugal forces. So it is necessary to ensure that the sample is not spit out of gap while measuring the STF formulations in the plate–plate rheometer.
The above rheological experiment results indicate that the prepared STF has an apparent shear thickening performance, and it has good application prospect in damping and energy dissipation fields. The energy dissipation capacity of these shear thickening materials was also proved by researches under dynamic testing [1, 23].
3. Preliminary design and dynamic performance of the STF damper
3.1. Structure design of the STF damper
The STF damper designed in this study is shown in figure 6, which is composed of piston guide rod 1, upper cover 2, upper inner cover 3, cylinder block 4, piston 5, O-shape sealing ring 6, Y-shape sealing ring 7, lower inner cover 8, lower cover 9 and locating pin 10. Two sealed chambers are formed between the piston and cylinder block, which are filled with damping material. The maximum stroke is ±10 mm, inner diameter of cylinder is 35 mm, diameter of the piston rod is 10 mm, three different pistons with diameter of 31 mm, 29 mm and 27 mm is designed, corresponding to the fluid gap of 2 mm, 3 mm and 4 mm, respectively.
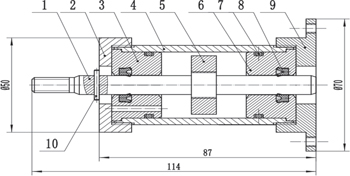
Figure 6. Structural design drawing of the STF damper.
Download figure:
Standard image High-resolution imageThe working principle of this energy dissipation device is that the damping force can be produced by the friction between cylinder wall and fluids, when the piston reciprocates in cylinder due to the pressure difference between the two sides of piston. During the work process of STF damper, partial energy of structure vibration is dissipated due to viscous property of STF, and then achieving the goal of reducing the structure vibration reaction. The shear rate is adjustable by designing the fluid gap and the velocity of piston, or by preparing STF with different rheological properties, thus its outputting damping force and energy dissipation capacity can be controlled.
3.2. Relationship of piston velocity and shear rate
The shear thickening interval of STF, that is the available range of shear rate for controllable damping, can be obtained by rheological testing. However, the piston velocity essentially determined the shear rate in STF damper, and it is essentially determined by the vibration frequency and displacement amplitude. So, it is necessary to find out the relationship between the motion velocity of piston and shear rate.
Assuming that the motion velocity of piston is v0, the flow velocity of fluid is  piston's radius is r, inside radius of damper cylinder is R, the gap between piston and cylinder wall is δ. Based on the continuity principle of fluid mechanics, it is known that the fluid flowing through damping channel, that is the gap between piston and cylinder wall δ, is equal to the volume of piston. While the flow of fluid flowing from one side to another side of piston in a distant time interval is as follow

And then, the flow velocity of fluid can be obtained

where A is the ring area enclosed by piston and cylinder wall, yields
According to the definition of shear rate, it is obtained
Thus, the relationship between piston motion velocity and shear rate is

According to equation (1), the corresponding shear rate can be calculated with a certain piston velocity and geometry parameters of the STF damper.
3.3. Dynamic performance of the STF damper
As a kind of energy dissipation device, viscous fluid damper is widely used in engineering. The STF damper designed in this study takes the STF as damping medium. By using the shear thickening effect, viscosity of the damping medium is changed by changing the applied shear rate field, thus the stiffness and damping of the damper are changed. Damping force of viscosity fluid damper is related to the structure size, such as the effective area of piston, the size and length of damping hole. In addition, it is also related to the working parameter, that is the loading amplitude and frequency, which is determined by the moving speed of piston. Thus, the controllable outputting damping force is realized by changing these parameters.
3.3.1. Performance test platform introduction
For damping performance study, an experimental setup based on a modal exciter was established for testing the vibration response, as shown in figures 7 and 8. In the input end, a modal exciter (JZK-20, the rated output is 200 N, the maximum vibration amplitude is ±10 mm) was used to applied sinusoidal excitation to the STF damper, which excited by a power amplifier (B&K 2720) and can offer excitation with different amplitude and frequency. An accelerometer (INV9821) was used to measure the accelerometer of the damper. A load cell (LC0501, the compression range is 5 kN,the tensile range is 1 kN) was placed between damper and exciter to measure the damping force produced by the STF damper. In the output end, signals generated from the two sensors were collected by a NI 4431 data acquisition module, and a charge amplifier (LC0601) was placed between the load cell and acquisition card.
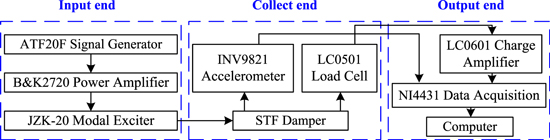
Figure 7. Scheme drawing of the STF damper testing system.
Download figure:
Standard image High-resolution image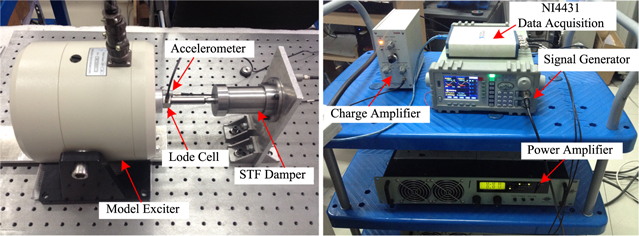
Figure 8. Experimental setup of vibration test-bed and test equipment.
Download figure:
Standard image High-resolution imageIn signal data processing, we utilized the methods of DC removal, mean value filter, band-pass filter in time domain. Moreover, accelerometer signals were transformed into velocity and displacement signal by using integral and quadratic integral processing. And then, hysteretic curves of damping force versus velocity and damping force versus displacement were obtained to analyze the damping performance of the STF damper. Thus, the experiment test bench can be used to study the vibration response and damping characteristics of system with different loading conditions.
3.3.2. Dynamic performance research
Dynamic performance of the STF damper was conducted based on the established performance test system. The two excitation types, that is the fixed frequency and sweep frequency, were used for experiment. The performance testing was conducted with different STF sample, loading frequency and fluid gap.
Taking the No.2, 3, 5, 7 STF samples for experimental testing, the shear thickening rate range and viscosity range were shown in figure 9. In which, the shear rate range with shear thickening behavior of No.2 STF sample is 0.2 ∼ 11 (1/s), and the viscosity change is about 20 Pa s in this interval, the maximum viscosity is about 25 Pa s. The shear rate range with shear thickening behavior of No.3, 5, 7 STF samples are all in 0.03 ∼ 0.6 (1/s), and the viscosity change is about 23 Pa s, 30 Pa s, 32 Pa s respectively. The maximum viscosity are about 40 Pa s, 42.5 Pa s, and 52.5 Pa s, respectively in the shear thickening interval. It is necessary to find the reliable shear thickening interval as the working interval of STF with controllable damping. The damping force is not only related to the material property and structure parameter of damper, but also related to the loading frequency and amplitude.
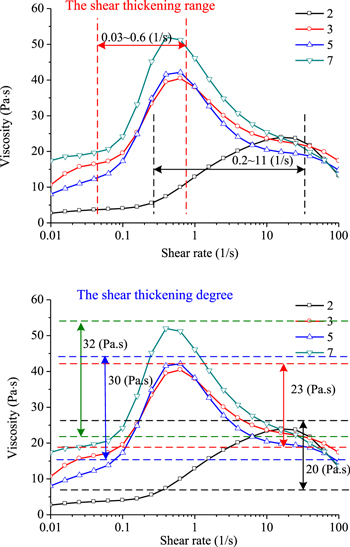
Figure 9. Shear rate and viscosity range of the STF testing samples.
Download figure:
Standard image High-resolution imageDue to that the visual working parameter is loading frequency but not the kinematic velocity of piston, it is necessary to solve the relationship between the loading frequency and shear rate according to the derived relationship between piston velocity and shear rate.
There are four sinusoidal vibration parameters, meaning acceleration a (m s–2), velocity v (m s–1), displacement d (m) and frequency f (Hz). The relationship between them can be written as the following formula (6) and (7)


Then, the relationship between the loading frequency, amplitude and shear rate can be obtained as follow

Thereby, the loading frequency acting on piston can be solved according to the shear rate range with shear thickening effect obtained from the rheological property testing. Thus, shear rate is controlled by controlling the loading frequency and amplitude, and then to realize the controllable viscosity and damping.
3.3.2.1. Dynamic performance test in fixed frequency excitation
The output damping force performance of the damper filled with No. 2 STF sample was tested. Signal generator was used to trigger sine signal, the frequency was set to 1 ∼ 10 Hz, the voltage amplitude was set to 2 Vpp, the voltage of amplifier was adjusted to 3 V, and hysteresis curves of force-displacement and force-velocity were obtained, as shown in figure 10. It can be seen that shear thickening effect is obvious when the frequency is below 5 Hz. With the increasing loading frequency, the area of hysteretic curves become large, and the output damping force was significantly increased from 5 N to about 14 N. While the output force changed little when the frequency above 5 Hz. Therefore, the shear thickening area of the damper was 1 ∼ 5 Hz, which can realize the adjustment of output damping force.
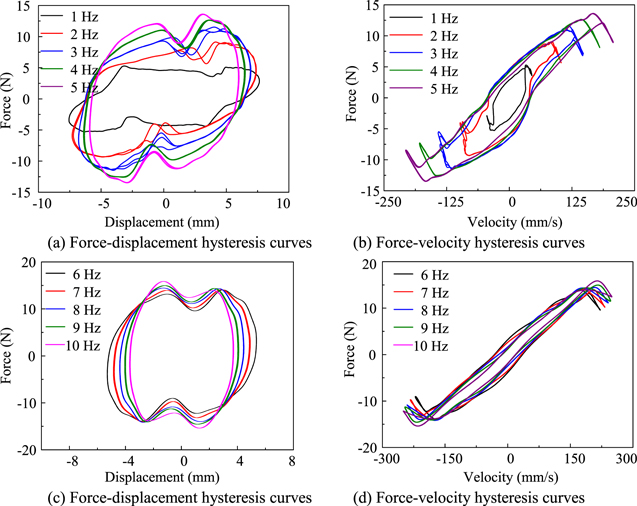
Figure 10. Dynamic performance of the STF damper at various loading conditions.
Download figure:
Standard image High-resolution image3.3.2.2. Dynamic performance test in sweep frequency excitation
In order to study the variation of the output damping force of STF damper with the change of loading frequency, sweep frequency excitation experiment was carried out. The scanning time and sampling rate was set to 80 s and 2 kHz, respectively. Frequency response curves of the No.3 and No.4 STF dampers with a 3 mm clearance were measured by sweep frequency excitation, respectively.
Setting the frequency range as 0 ∼ 30 Hz, sweep frequency excitation test was carried out of the No. 3 STF damper and result was shown in figure 11. As shown in this figure, the damping force is variable in the frequency range of 0 ∼ 6 Hz, and the variation range is from 5 N to about 10 N. When the excitation frequency is greater than 6 Hz, the damping force is kept constant at about 10 N. Therefore, the output force of the damper can be controlled within 0 ∼ 6 Hz and it remains constant at 10 N when the frequency is greater than 6 Hz.
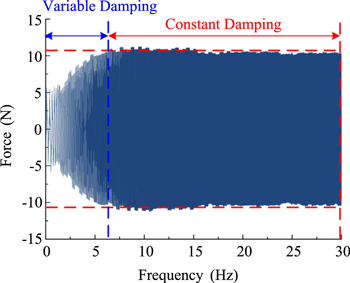
Figure 11. Dynamic performance of the No.3 STF damper in dynamic frequency scanning.
Download figure:
Standard image High-resolution imageIn the same way, dynamic sweep frequency excitation test was also carried out of the No. 4 STF damper with the same frequency range and the result was illustrated in figure 12. It can be seen that the output damping force is change from 10 N to about 25 N in the frequency range of 0 ∼ 6 Hz. Then, the damping force showed a decreasing trend when the frequency was above 6 Hz. Therefore, the output force of the No. 4 STF damper can be controlled within 0 ∼ 6 Hz and it ranges from 10 to 25 N.
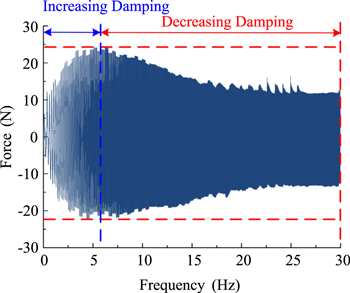
Figure 12. Dynamic performance of the No.4 STF damper in dynamic frequency scanning.
Download figure:
Standard image High-resolution imageFrom the above testing experiment, we can master the change trend, the change range of damping force and the working frequency range with controllable output force of the STF damper; it can offer guidance for selecting the working parameter in further vibration control.
3.3.2.3. Dynamic performance with different fluid gaps
In addition, fluid gap is also a key control parameter, which can change the whole value of output damping force. Thus, it is necessary to study the effect of fluid gap on dynamic performance of the STF damper. Taking the damper filled with No.2 STF sample to conduct the performance testing experiment with different fluid gaps(δ = 4 mm, 3 mm, 2 mm), the fixed frequency (f = 5 Hz) and sweep frequency were adopted, the obtained results can be seen in figures 13 and 14.
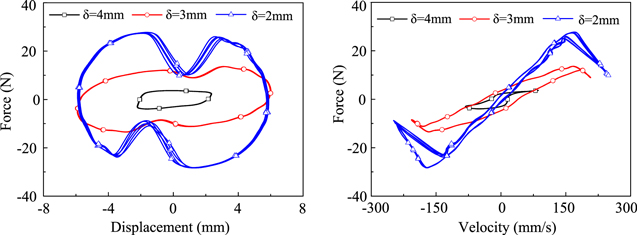
Figure 13. Hysteretic loops of the STF damper at various fluid gaps.
Download figure:
Standard image High-resolution image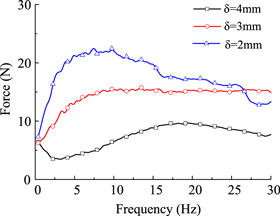
Figure 14. Frequency versus damping force of the STF damper at various fluid gaps.
Download figure:
Standard image High-resolution imageFrom figure 13 we can see that the maximum output damping force is 5 N, 15 N, 25 N with the fluid gaps δ = 4 mm, 3 mm, 2 mm, respectively, in same conditions. From the sweep test results (figure 14) we can see that the maximum output damping force is 10 N, 15 N, 23 N, and the critical frequency is 17 Hz, 9 Hz, 6 Hz when fluid gap is 4 mm, 3 mm, 2 mm, respectively. In other words, the output damping force increases and the critical frequency moves forward obviously with the decreasing fluid gap. Thus, we can control the whole output damping force and the available loading frequency range not only by controlling the loading frequency and amplitude but also by controlling fluid gap.
In figures 10 and 13, the force will fluctuate as the displacement is close to 0. We also found that the smaller the fluid gap, the more obvious the fluctuation; the smaller the excitation frequency within a certain range, the more obvious the fluctuation. The possible reason for this result may be that there is an impact on the initial moment of motion due to the high viscosity and the nonlinear characteristic of STF. Another possible reason is that there existing sliding friction force between the piston rod and seals, the force is larger and fluctuation occurs when the excitation frequency is lower, so the single obtained by the force sensor may be fluctuate.
4. Mechanical model analysis of the STF damper
The STF can be changed from fluidity into solidity at the effect of shear rate field; and damping force will also increase with the increasing shear rate at the shear thickening range. Applying this characteristic, the STF damper will be developed as a vibration control device with considerable application prospect.
To establish a precise mechanical model is one of the important factors for designing the control strategy with good effects when vibration control conducted by using the STF damper, it is also one of the key points for guaranteeing analogue output of the STF damper and simulated analysis with good reliability. Thus, it is necessary to establish the mathematic model of STF damper based on experiment results. According to the experiment data for performance testing, the nonlinear fitting study and comparison analysis were conducted by using the LM algorithm, and the equivalent linear model, the equivalent nonlinear model and the Bouc–Wen model were adopted as fitting function respectively in order to obtain the approximate mechanical model for descripting dynamic performance of the STF damper in this subsection.
4.1. Fitting function models
4.1.1. The equivalent linear model
Zhang et al [19] take the force-deformation performance of the STF damper expressed as equivalent elastic stiffness and equivalent viscous damping, an equivalent linear model was deduced, which expression as follow

The equivalent linear elastic stiffness coefficient

The equivalent viscous damping coefficient

In which,  is the energy dissipate of every lode cycle, A is the displacement amplitude.
4.1.2. The equivalent nonlinear model
Zhou et al [21] take the force-deformation performance of the STF damper expressed as equivalent linear elastic stiffness and equivalent power-law viscous damping, an equivalent nonlinear model was deduced, which is expressed as follow

The equivalent linear elastic stiffness coefficient

The equivalent viscous damping coefficient

The power-law exponent is

This equivalent nonlinear model changes the linear viscous damping item into power-law nonlinear damping item base on the equivalent linear model.
4.1.3. The Bouc–Wen model
A widely used differential mathematic model is introduced by Bouc [24] in 1967 for simulating the nonlinear hysteresis system; and it was improved by Wen et al [25] in 1976, and can express various nonlinear hysteresis systems. Its expression is

In which, z is the nonlinear hysteresis force, determined by characteristic of vibration material and the outside excitation;  represents the relative velocity; α, β, γ, n are the hysteresis constants, α, β, γ affect the shape and size of hysteresis curve,
  affects the smooth of the hysteresis curve.
Bouc–Wen model is easy to deal with in number, which both contains the nonlinear damping and the nonlinear stiffness. It is widely used in engineering practice and has a good effect for describing all kinds smooth hysteresis curves and also reflect the dynamic performance of the smart material damper as a kind of hysteresis model with smooth curve [26].
4.2. Fitting results
The nonlinear fitting study based on the same two group experimental data was conducted by taking the equivalent linear model, the equivalent nonlinear model and the Bouc–Wen model as fitting function, respectively. The initial value and result of fitting parameters are all list in tables 2–4.
Table 2. Fitting parameters using the equivalent linear model.
| Fitting data | Parameters | k | c |
|---|---|---|---|
| Initial value | 1 | 0.5 | |
| 5 Hz | Fitting result | −509.9174 | −65.2739 |
| 10 Hz | Fitting result | −237.7091 | −66.2139 |
Table 3. Fitting parameters using the equivalent nonlinear model.
| Fitting data | Parameter | k | c | n |
|---|---|---|---|---|
| Initial value | 1 | 0.5 | 2 | |
| 5 Hz | Fitting results | 509.9174 | −24.6563 | 94.1833 |
| 10 Hz | Fitting results | 4.5706 | −1.3821 | 0.9418 |
Table 4. Fitting parameters using the Bouc–Wen model.
| Fitting data | Parameter |

|

|

|
n |
|---|---|---|---|---|---|
| Initial value | 1 | 0.5 | 0.5 | 1 | |
| 5 Hz | Fitting results | −4707.6 | 2307.2 | −10 909 | −0.215 |
| 10 Hz | Fitting results | −300.12 | −534.76 | 728.51 | −2.97 |
The fitting results using three different models were as illustrated in figures 15–17. From the figure 15, we can see that the equivalent linear model has definite physical meaning and can describe the linear characteristic, while it cannot give an accurate description of the nonlinear characteristic of the STF damper caused by the shear thickening effect. Obviously, figure 16 indicates that the equivalent nonlinear model can describe the nonlinear damping characteristic, but it cannot present the nonlinear stiffness property of the damper. Compared with the first two models, the Bouc–Wen hysteretic model can be better used for describing the nonlinear stiffness, nonlinear damping and rate-dependence characteristics of the smart material damper. Thus, it was proposed for describing the dynamic performance of the STF damper in this study and the effect was verified by nonlinear fitting.
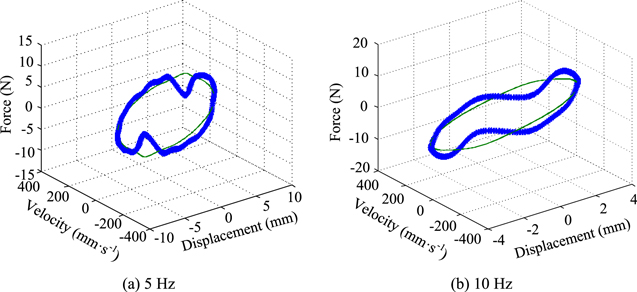
Figure 15. Fitting curves using the equivalent linear model.
Download figure:
Standard image High-resolution image
Figure 16. Fitting curves using the equivalent nonlinear model.
Download figure:
Standard image High-resolution image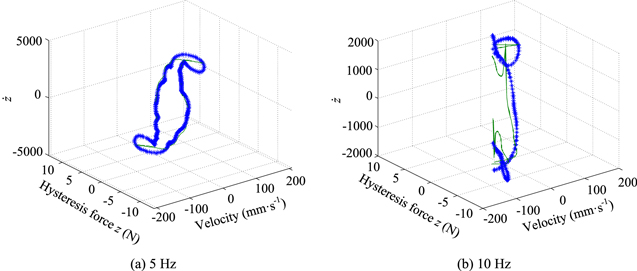
Figure 17. Fitting curves using the Bouc–Wen model.
Download figure:
Standard image High-resolution image
4.3. Discussion
The Bouc–Wen hysteretic model is usually used for simulation study of all kinds of nonlinear hysteresis system, and can accurately reflect the energy dissipation and nonlinear property of smart materials damper. In this work, the mathematical model analysis of the new-type damper was studied by using the LM algorithm and taking the equivalent linear model, the equivalent nonlinear model and the Bouc–Wen model as fitting function, respectively. Comprehensive comparison showed that the Bouc–Wen model and equivalent nonlinear model can describe the nonlinear performance of the damper. Moreover, the rate-dependence of Bouc–Wen hysteretic model is more suitable for simulating the changing force-displacement/velocity performance with changing frequency of the damper. Thus, the Bouc–Wen model is suggested to address the nonlinear damping, nonlinear stiffness and rate-dependence characteristics of the STF damper.
5. Conclusion
In this research, STF samples with different mass fraction and dispersion medium were fabricated by using nano fumed silica and different average molecular weight of polyethylene glycol; its rheological behavior and influence analysis were investigated by a rheometer. The prepared STF has apparent shear thickening performance. The viscosity and stress increase and the critical shear rate decreases with the increasing mass fraction and average molecular weight of dispersion medium.
A smart STF damper was designed and manufactured; its dynamic performance was analyzed by setting up a vibration test system based on a modal exciter. From the testing experiment, vibration response and output damping force varies with different loading frequency, loading amplitude and fluid gap. It indicated that this damper can output variable damping force at different conditions. It has good controllable damping performance and considerable application value. The changing trend and controlling principle is that the damping force increases and the critical frequency moves forward with the increasing load frequency and decreasing fluid gap at a certain frequency range.
The Bouc–Wen model was proposed to address the dynamic properties of STF damper. It is verified by conducting the nonlinear fitting study using the LM algorithm. Results showed that the Bouc–Wen hysteretic model is more suitable for describing the nonlinear damping, nonlinear stiffness and rate-dependence characteristics of the STF damper.
All the work indicate that the smart STF damper can realize controllable output damping force by changing the loading frequency, loading amplitude and fluid gap, and it has a good application prospect in energy dissipation and vibration control fields.
Acknowledgments
This work supported by Research Program under the National Natural Science Foundation of China (Grant No. 51475085).