


Abstract
Recent experiments indicated that both layered Bi2O2Se and Bi2O2Te are promising thermoelectric materials with low thermal conductivities. However, theoretical study on the thermoelectric properties, especially the phonon transport properties, is rare. In order to understand the thermoelectric transport mechanism, we here investigate the electron and phonon transport properties by using the first-principles calculations combined with the Boltzmann transport theory. Our results indicate that both Bi2O2Se and Bi2O2Te are semiconductors with indirect energy gaps of 0.87 eV and 0.21 eV within spin–orbit coupling, respectively. Large Seebeck coefficient and power factor are found in the p-type than the n-type for both compounds. Low lattice thermal conductivities at room temperature are obtained, 1.14 W m−1 K−1 for Bi2O2Se and 0.58 W m−1 K−1 for Bi2O2Te, which are close to the experimental values. It is found that the low-frequency optical phonon branches with higher group velocity and longer lifetime also make a main contribution to the lattice thermal conductivity. Interestingly, the lattice thermal conductivity exhibits obvious anisotropy especially for Bi2O2Te. These results are helpful for the understanding and optimization of thermoelectric performance of layered Bi2O2Se and Bi2O2Te.
Export citation and abstract BibTeX RIS

Original content from this work may be used under the terms of the Creative Commons Attribution 3.0 licence. Any further distribution of this work must maintain attribution to the author(s) and the title of the work, journal citation and DOI.
1. Introduction
Thermoelectric materials, which possess of the characteristic to transform waste heat into electric power, have been extensively studied for new sustainable energy technology [1–3]. The efficiency of thermoelectric conversion is governed by the figure of merit ZT = S2σT/κ, where S, σ, T and κ are the Seebeck coefficient, electrical conductivity, absolute temperature and thermal conductivity, respectively. The thermal conductivity κ includes electronic κe and phonon (or lattice) κι parts. As for high ZT materials, they typically have a high power factor (PF = S2σ) and a low κ. Nevertheless, this does not mean we can limitlessly increase the power factor and reduce the thermal conductivity, because these parameters are always coupled with each other. Therefore, different strategies have been taken to improve the ZT value, including doping [4, 5], band engineering [6, 7] and low dimensional structure [8, 9], etc.
As we all know, the Bi-based thermoelectric materials firstly reported were the layered Bi2Se3 and Bi2Te3, which have been widely studied in both experiments and theories [10–12]. The measured thermal conductivities are low, 3.1 W m−1 K−1 for Bi2Se3 [13] and 2.0 W m−1 K−1 for Bi2Te3 [14]. By the solid state reaction of Bi2Se3 with Bi2O3 and Bi2Te3 with Bi2O3, the ordered ternary layered bismuth oxide crystalline compounds of Bi2O2Se and Bi2O2Te have been synthesized experimentally [15–17], and they exhibit a tetragonal structure with I4/mmm space group and make up of Se/Te atomic layers sandwiched between Bi2O2 layers with weak electrostatic interactions. Ruleova et al [17] experimentally observed that Bi2O2Se has a low thermal conductivity with 1.1 W m−1 K−1 at room temperature and 0.7–0.75 Wm−1K−1 at T = 800 K. However, the ZT value is only about 0.2 at 800 K due to the low electrical conductivity. Fu et al [18] have performed experimental and theoretical studies on the electronic and transport properties of Bi2O2Se. It was found that the Se vacancies (VSe) and the Se–Bi antisites (SeBi) are crucial donors for electron carriers in Bi2O2Se. To improve the thermoelectric performance, some strategies have been implemented. For instance, the large ZT value 1.42 of p-type doping Bi2O2Se under tensile strain at 800 K was predicted by Guo et al, but they adopted the experimental thermal conductivity for ZT prediction and did not consider the change with strain [19]. The Cl doping can significantly improve the electrical conductivity and the ZT can reach 0.23 at T = 823 K for Bi2O2Se [20]. The recently measured Bi2O2Te is also a n-type semiconductor with a band gap of 0.23 eV and a low thermal conductivity of 0.91 W m−1 K−1 at room temperature [21]. Based on this experimental thermal conductivity, Tran et al theoretically predicted that the ZT value of Bi2O2Te is 1.27 at about 600 K for the p-type doping [22]. As far as we know, however, there is no theoretical study on the phonon transport properties for Bi2O2X. What's more, the previous theoretical reports on electron transport properties almost did not consider the effect of spin–orbit coupling (SOC), which may not be neglected due to the heavy elements Bi and Te in Bi2O2X.
For layered Bi2O2X, what is the origin of the low lattice thermal conductivity? How about the anisotropy of the lattice thermal conductivity? How about the p-type thermoelectric performance compared to the n-type? How about the effect of SOC on the thermoelectric performance? With these questions, in this work, we use the first-principles calculations combined with the Boltzmann transport theory to investigate the electron and phonon transport properties. It is found that the p-type thermoelectric performance is better than the n-type, and thus the thermoelectric performance can be enhanced by reasonable p-type doping. The obtained lattice thermal conductivities, 1.14 W m−1 K−1 for Bi2O2Se and 0.58 W m−1 K−1 for Bi2O2Te at 300 K, are close to the experimental values, and the main contribution is also from the low-frequency optical phonon branches in addition to the acoustic phonon branches. The lattice thermal conductivities exhibit obvious anisotropy especially for Bi2O2Te. We also find that the SOC has a considerable effect on the thermoelectric performance, and the optimized ZT values decrease from 0.74 to 0.53 for Bi2O2Se, and 0.87 to 0.62 for Bi2O2Te within SOC.
2. Computational methods
The structural optimization of Bi2O2X (X = Se, Te) are performed within the framework of density function theory using the projector-augmented-wave [23] pseudopotential and the Perdew–Burke–Ernzerhof [24] exchange correlation functional as implemented in the VASP [25]. The energy cutoff for the plane-wave expansion is set to 550 eV, and a Monkhorst–Pack k-mesh of 13 × 13 × 13 is used in the Brillouin zone. The energy convergence threshold is 10–6 eV and the force 10–5 eV Å−1 in the structural optimization. In order to overcome the underestimation of energy gap from the generalized gradient approximation (GGA), we use the recently developed GGA plus Tran–Blaha modified Becke–Johnson (TB-mBJ-GGA) potential [26] to calculate the electronic structure and transport properties, and the SOC is also considered. A 33 × 33 × 13 Monkhorse–Pack k point grid is used for the calculations of the electronic transport properties by utilizing the Boltzmann transport theory and the relaxation time approximation as implemented in the BoltzTraP code [27], from which we can obtain the S and σ/τ. The electrical thermal conductivity is calculated by the Wiedemann–Franz law: κe = LσT, where L = 2.4 × 10⁻⁸ W ΩΚ−2 is the Lorenz number [28].
The lattice thermal conductivity is calculated based on the phonon Boltzmann transport equation as implemented in the ShengBTE [29]. We use a 4 × 4 × 4 supercell to calculate the second and third-order force constants. The second-order force constants are calculated by the Phonopy package [30], and the third-order force constants are obtained by the thirdorder.py script in the ShengBTE [29]. A cutoff of 0.57 nm for the calculation of anharmonic force constants is employed. Finally, a 19 × 19 × 11 q-mesh is selected to sample the corresponding phonon wave-vector mesh in the ShengBTE calculations. The present computational methods of electron and phonon transport properties have been successfully used in bulk and two-dimensional thermoelectric materials [7, 31, 32].
3. Results and discussion
3.1. Electronic structure and electronic transport
Both Bi2O2Se and Bi2O2Te belong to the tetragonal structure with I4/mmm space group (figure 1(a)). Our optimized equilibrium lattice constants shown in table 1 are consistent with the experimental values [17, 21] and other theoretical values [33]. Based on the equilibrium structures, we firstly calculate the band structure of Bi2O2X, as shown in figures 1(b) and (c). It is clear that both Bi2O2Se and Bi2O2Te are semiconductors with indirect energy gaps of 0.87 eV and 0.21 eV, respectively, which are in agreement with the previous experimental and theoretical values [21, 33] (see table 1). Furthermore, we calculate the total and atomic partial density of states (DOS) near the Fermi level. It can be extracted from figure 2 that the conduction bands around the Fermi level are mostly contributed by Bi 6p states, and the valence bands originate from the hybridized states of Se (Te) p states and O 2p states. At the same time, the valence bands exhibit much higher DOS than the conduction bands, and thus one can expect that the Seebeck coefficient of p-type is much larger than that of n-type by reasonable doping.

Figure 1. The crystal structure of bulk Bi2O2X (X = Se, Te) (a) and the calculated electronic band structures of Bi2O2Se (b) and Bi2O2Te (c).
Download figure:
Standard image High-resolution imageTable 1. The calculated equilibrium lattice constants and band gaps for Bi2O2X (X = Se, Te). The obtainable experimental [17, 21] and theoretical [33] values are also listed.
| a (Å) | c (Å) | Eg (eV) | |
|---|---|---|---|
| Bi2O2Se | 3.92 | 12.41 | 0.87 |
| 3.89[17] | 12.20[17] | — | |
| 3.90[33] | 12.39[33] | 0.89[33] | |
| Bi2O2Te | 4.02 | 12.90 | 0.21 |
| 3.98[21] | 12.77[21] | 0.23[21] | |
| 4.01[33] | 12.90[33] | 0.16[33] |

Figure 2. The calculated total and atomic partial density of states for Bi2O2Se (a) and Bi2O2Te (b).
Download figure:
Standard image High-resolution imageNext, we calculate the electronic transport properties by the semiclassical Boltzman transport theory. With so-called constant relaxation time approximation, the Seebeck coefficient S is independent of the relaxation time τ, while the electrical conductivity σ is dependent on τ. In the present work, by fitting the calculated Seebeck coefficient and electrical conductivity with the experimental results for Bi2O2X at 300 and 500 K [17, 21], we obtain the carrier concentration n and the relaxation time τ. For Bi2O2Se, n is 2.85 × 10⁻¹⁸ cm−3 at 300 K and 2.34 × 10⁻¹⁸ cm−3 at 500 K, and τ is 1.35 × 10⁻¹⁵ s at 300 K and 1.91 × 10⁻¹⁵ s at 500 K. For Bi2O2Te, n is 1.06 × 10⁻¹⁸ cm−3 at 300 K and 6.15 × 10⁻¹⁸ cm−3 at 500 K, and τ is 2.51 × 10⁻¹⁵ s at 300 K and 3.43 × 10⁻¹⁵ s at 500 K. The obtained carrier concentrations are in agreement with the experimental values ∼10–18 cm−3 [21, 34], and their changes with temperature are slight [34]. The fitted τ values at 300 K are close to the previous theoretical results of 1.2 × 10⁻¹⁵ s for Bi2O2Se [35] and 4.4 × 10⁻¹⁵ s for Bi2O2Te [22]. Figures 3(a) and (b) show the calculated S and σ as a function of carrier concentration at 300 K. It is noticed that the Seebeck coefficient of p-type doping is larger than the n-type doping, and this characteristic is consistent with the DOS that the valence bands exhibit much higher DOS than the conduction bands. Both p-type Seebeck coefficients of Bi2O2Se and Bi2O2Te can reach about 450 μV K−1 at an appropriate carrier concentration. We note that the previous theoretical S of −93 μV K−1 at the n-type carrier concentration of 1.5 × 1019 cm−3 and 400 μV K−1 at the p-type carrier concentration of 2.0 × 1019 cm−3 [35] are close to our present results of −85 μV K−1 and 370 μV K−1, respectively (see figure 3(a)).

Figure 3. The calculated Seebeck coefficient S (a), electrical conductivity σ (b) and electrical thermal conductivity Ke (c) as a function of carrier concentration at 300 K for Bi2O2X (X = Se, Te). Note that the fitted relaxation times are 1.35 × 10⁻¹⁵ s at 300 K for Bi2O2Se and 2.5 × 10⁻¹⁵ s at 300 K for Bi2O2Te.
Download figure:
Standard image High-resolution imageFigure 3(b) indicates that, compared with Bi2O2Se, the electrical conductivity of Bi2O2Te is higher due to the small band gap. The electrical conductivity rapidly increases as the increasing carrier concentration, while the change is reverse for the Seebeck coefficient, and thus it is natural to obtain the maximum power factor by fitting a balanced value of the carrier concentration between the Seebeck coefficient and the electrical conductivity. Indeed, It can be clearly seen from figure 4 that Bi2O2Se shows the best power factor of 1.39 mW mK−2 at a concentration of 1.05 × 1021 cm−3 for p-type doping at 500 K, while the maximum power factor of Bi2O2Te is about 1.13 mW mK−2 with the concentration of 3.08 × 1020 cm−3 for p-type doping at 500 K. As for Bi2O2Te, the power factor of n-type doping increases with the increase of temperature, which is consistent with the experimental results [21]. The calculated electrical thermal conductivity κe is shown in figure 3(c). One can see that the p-type value is clearly lower than the n-type value at the same carrier concentration. Overall, all these results indicate that the thermoelectric performance of the p-type doping is more favorable than the n-type doping. The electronic transport performance can be enhanced by reasonable p-type doping.

Figure 4. The calculated power factor as a function of carrier concentration at different temperatures of 300 and 500 K for Bi2O2Se (a) and Bi2O2Te (b). Note that the fitted relaxation times are 1.35 × 10⁻¹⁵ s at 300 K and 1.91 × 10⁻¹⁵ s at 500 K for Bi2O2Se, and 2.5 × 10⁻¹⁵ s at 300 K and 3.43 × 10⁻¹⁵ s at 500 K for Bi2O2Te.
Download figure:
Standard image High-resolution image3.2. Phonon transport and figure of merit
The calculated phonon spectra of Bi2O2X are plotted along high-symmetry paths in figure 5(a). As the primitive cells of Bi2O2X (X = Se, Te) have five atoms, fifteen phonon branches can be observed. There are significant frequency gaps between the high-frequency and low-frequency modes of optical branches, and they are about 3.03 THz and 3.12 THz for Bi2O2Se and Bi2O2Te, respectively. Meanwhile, we find some special features from the phonon spectra. One point of interest is the fact that compared with acoustic branches and low-frequency optical branches, the high-frequency optical branches show distinct dispersion, indicating their higher group velocity. What's more, acoustic branches and some optical branches show different dispersions along the cross-plane (Γ–Z) and in-plane (Γ–X) directions, which suggests a strong phonon anisotropy as discussed in detail below. It can also be seen that all the phonon branches moves toward lower frequency for Bi2O2Te compared to Bi2O2Se, which implies the phonon spectra become more localized, namely the coupling strength between low-frequency optical branches and acoustic branches is enhanced. We also present in figure 5(b) the calculated total and partial phonon DOS. The optical modes with high frequency of Bi2O2X are dominated by O atoms, while the acoustic branches and low-frequency optical branches are mainly governed by Bi and Se (Te) atoms. Such distributions are mainly responsible for the large mass difference between O and Bi (Se, Te) atoms, because the frequencies of lighter (heavier) atoms are higher (lower).

Figure 5. The calculated phonon dispersion (a) and phonon total and partial density of states (b) for Bi2O2X (X = Se, Te).
Download figure:
Standard image High-resolution imageThe calculated phonon group velocity with respect to frequency is shown in figure 6. It can be seen that the optical phonon branches also show remarkable dispersion, which points to higher group velocities of these optical modes, and their contributions to lattice thermal conductivity cannot be ignored. In addition, as for Bi2O2Se, the group velocities of transverse acoustic (TA) branches and longitudinal acoustic (LA) branch along Γ–X are about 1.54 km s−1, 1.34 km s−1 and 4.02 km s−1, respectively, while the group velocities of TA and LA along Γ–Z are about 1.22 km s−1, 2.32 km s−1 and 4.2 km s−1. As for high-frequency optical branches, the maximum group velocity along Γ–X reaches 7.51 km s−1, whereas it is only 0.57 km s−1 along Γ–Z. Likewise, the group velocities along Γ–X and Γ–Z for Bi2O2Te also show large difference. Thus, the group velocities along in-plane are much different from those along cross-plane direction, which will lead to a strong anisotropy of lattice thermal conductivity. In addition, compared with Bi2O2Se, Bi2O2Te possessing of heavier atomic mass has smaller group velocities.

Figure 6. The calculated phonon group velocity as a function of frequency for acoustic (red) and optical (black) modes at 300 K of Bi2O2Se (a) and Bi2O2Te (b).
Download figure:
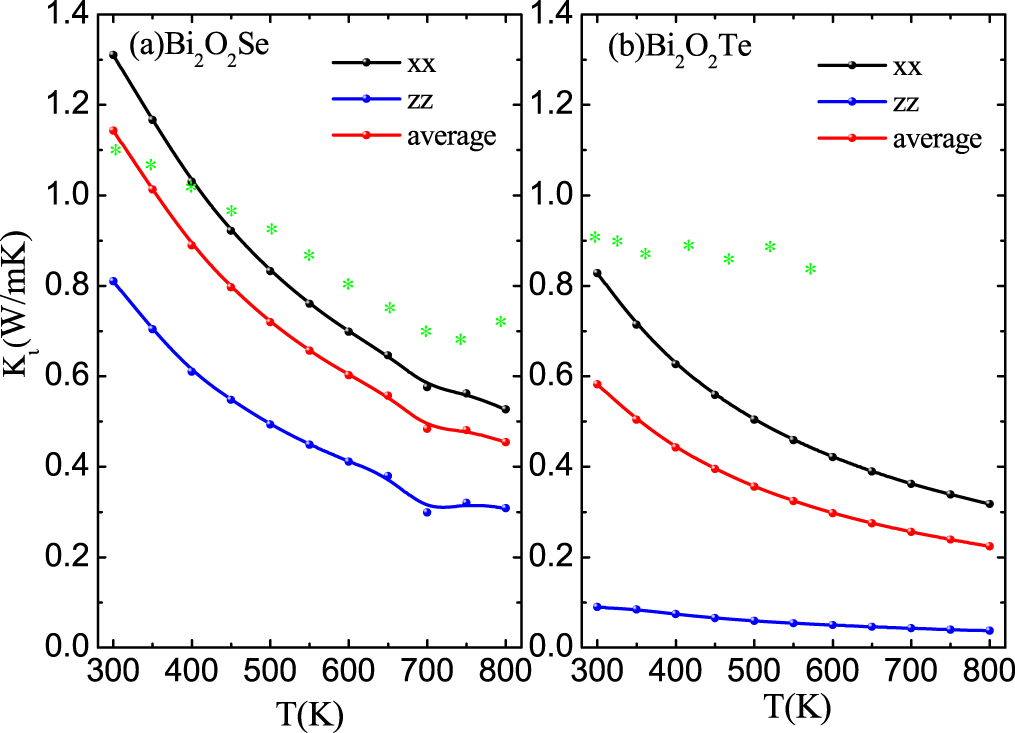
Standard image High-resolution imageThe calculated lattice thermal conductivity of Bi2O2X as a function of temperature is shown in figure 7. Both Bi2O2Se and Bi2O2Te exhibit fairly low lattice thermal conductivities. The room temperature lattice thermal conductivities are 1.14 W m−1 K−1 for Bi2O2Se and 0.58 W m−1 K−1 for Bi2O2Te, which are lower than those of 1.6 W m−1 K−1 for PbTe [36] and 0.97 W m−1 K−1 for SnSe [37], respectively. They are also close to the experimental values of 1.1 W m−1K−1 for Bi2O2Se [17] and 0.91 W m−1 K−1 for Bi2O2Te [21]. When the temperature is raised to 800 K, the lattice thermal conductivities are merely 0.45 W m−1 K−1 and 0.22 W m−1 K−1 for Bi2O2Se and Bi2O2Te, respectively. The lattice thermal conductivity of Bi2O2Te is lower than that of Bi2O2Se due to the lower group velocity induced by heavier Te atom in Bi2O2Te than Se atom in Bi2O2Se. Interestingly, both lattice thermal conductivities exhibit strong anisotropy. For example, the in-plane and cross-plane room temperature lattice thermal conductivities are 1.31 and 0.82 W m−1 K−1 for Bi2O2Se, and 0.83 and 0.09 Wm−1K−1 for Bi2O2Te. The origin of the anisotropic lattice thermal conductivity can be explained from two aspects. On the one hand, as mentioned above, the acoustic branches and some optical branches show different dispersions along the cross-plane (Γ–Z) and in-plane (Γ–X) directions, which results in different group velocities along the cross-plane and in-plane directions. On the other hand, the atomic interactions along the cross-plane (weak electrostatic interactions) and in-plane directions (strong covalent bonding interactions) are different [38]. The weak electrostatic interactions along the cross-plane direction limit the phonon transport and yield low κl.

Figure 7. The calculated lattice thermal conductivity from 300 to 800 K for Bi2O2X (X = Se, Te) Note that the green * represents the experimental thermal conductivities at 300 and 500 K [17, 21].
Download figure:
Standard image High-resolution imageTo further reveal the thermal transport mechanism, we show in figure 8 the calculated total relaxation time for all phonon modes as a function of frequency. Here, the phonon relaxation time τλ can be obtained from the phonon linewidth 2Γλ(ωλ) of the phonon mode λ:

The Γλ(ω) takes a form analogous to the Fermi golden rule:

where fλ is the phonon equilibrium occupancy, and  is the strength of interaction among the three phonons, λ, λ', and λ'', involved in the scattering. Please see [39] about the more detailed description of these calculations. From figure 8, one can see that the average relaxation times are 1.3 ps for Bi2O2Se and 2.1 ps for Bi2O2Te for the acoustic branches and low-frequency optical branches (below 6 THz), and 0.41 ps for Bi2O2Se and 0.23 ps for Bi2O2Te for the high-frequency optical branches (above 6 THz), these values have the same magnitude to that of PbTe [40] which has a very dispersive transverse optical branch. Therefore, like PbTe, such low relaxation times in Bi2O2X are mainly attributed to the large phonon scattering. Importantly, the low-frequency optical phonon modes, as coupled with acoustic modes, possess comparable relaxation times with acoustic phonon modes, in contrast the high-frequency optical modes exhibit lower relaxation times. This means that the low-frequency optical phonons also make a dominate contribution to the lattice thermal conductivity.

Figure 8. The calculated phonon relaxation times for acoustic (red) and optical (black) modes at 300 K for Bi2O2Se (a) and Bi2O2Te (b).
Download figure:
Standard image High-resolution imageWe have also calculated the cumulative thermal conductivity as a function of phonon maximum mean-free path (MFP) to study the size dependence of κι. From figure 9, one can see that the total accumulation keeps increasing as MFPs increases, until reaching the plateau after MFPs increase to 64 nm and 38 nm for Bi2O2Se and Bi2O2Te, respectively. The maximum MFPs in Bi2O2Se and Bi2O2Te are much shorter than that of PbTe (about 300 nm) [40]. Furthermore, phonons with MFPs contributed about 80% of the total κι are 17 nm for Bi2O2Se and 8.9 nm for Bi2O2Te. This means that the nanostructures with the length of 17 and 8.9 nm would reduce κl by 20% for both Bi2O2X. That is to say, to consequentially reduce lattice thermal conductivity of Bi2O2Se and Bi2O2Te, the size of nanostructures should below 17 nm and 8.9 nm, respectively.

Figure 9. The normalized integration of lattice thermal conductivity with respect to phonon mean free path at 300 K for Bi2O2Se (a) and Bi2O2Te (b).
Download figure:
Standard image High-resolution imageBased on above results of electronic and phonon transport coefficients, we can obtain the ZT value of Bi2O2X, as shown in figure 10. The calculated ZT values are close to the available experimental ones, e.g. the calculated ZT values for n-type Bi2O2Se are 0.006 at 300 K with the carrier concentration 2.85 × 1018 cm−3, and 0.042 at 500 K with the carrier concentration 2.34 × 1018 cm−3, which are in agreement with the experiment values of 0.007 and 0.034, respectively [17]. Figure 10 also indicates that the p-type doping is superior to the n-type doping, and the maximum of ZT value increases with increasing temperature. At 500 K, the p-type optimal ZT values can reach 0.53 and 0.62 for Bi2O2Se and Bi2O2Te, respectively. Therefore, the p-type doping is more favorable for the improvement of thermoelectric performance of Bi2O2X.

Figure 10. The calculated figure of merit (ZT) at 300 and 500 K for both n-type and p-type Bi2O2Se (a) and Bi2O2Te (b). Note that the green and red * represent the experimental ZT values at 300 and 500 K [17, 21].
Download figure:
Standard image High-resolution image
3.3. The comparison of thermoelectric properties with and without SOC
Above results are all based on the SOC. Now we discuss the difference of thermoelectric performance with and without SOC. We firstly present in figure S1 (see the supplementary materials available online at stacks.iop.org/NJP/20/123014/mmedia) the calculated electronic band structure of Bi2O2X using the TB-mBJ potential with and without SOC. One can see that both conduction band and valence band within SOC obviously move to low energy compared to those without SOC. The SOC reduces the energy gap, from 1.15 eV to 0.87 eV for Bi2O2Se, and 0.36 eV to 0.21 eV for Bi2O2Te. Without SOC, the energy gap of 1.15 eV is close to the previous theoretical value of 1.28 eV for Bi2O2Se [18]. For the conduction band, the shift toward low energy is obvious. For the valence band, we compare the energy difference between the first and the second valence band valleys for Bi2O2Se as shown in figure S1. The energy difference Δ2 at the X point within SOC is larger than Δ1 without SOC for Bi2O2Se. There is a big energy gap Δ3 at the Z point for Bi2O2Te due to the SOC. Therefore, the effect of SOC on the electronic band structure of Bi2O2X is obvious, and in turn, the thermoelectric performance will also be affected by the SOC.
We further calculate and compare the S, σ, S2σ and ZT with and without SOC. Figure S2 (see the supplementary materials) indicates that the SOC has an obvious influence on the p-type S of Bi2O2X (X = Se, Te) at 300 K for low doping concentration. When the temperature is raised to 500 K, both p-type and n-type S decrease at the low doping concentration due to the effect of SOC on the electronic structure. The calculated electrical conductivity σ in figure S3 (see the supplementary materials) shows that the values within SOC are smaller than those without SOC at the same carrier concentration. We further give in figure S4 (see the supplementary materials) the calculated power factor S2σ with and without SOC. It can be seen that the difference is small at 300 K but obvious at 500 K, especially for the p-type doping the S2σ decreases greatly. Finally, we present in figure S5 (see the supplementary materials) the calculated ZT values with and without SOC as a function of carrier concentration. The SOC has a considerable effect on the ZT values for both p-type Bi2O2Se and Bi2O2Te at 500 K, and the optimized ZT values decrease from 0.74 to 0.53 for Bi2O2Se, and from 0.87 to 0.62 for Bi2O2Te within SOC.
4. Conclusion
In summary, by utilizing the first-principle calculations and Boltzmann transport equation, we investigate the electronic structure and thermoelectric properties of layered Bi2O2X. Both Bi2O2Se and Bi2O2Te are semiconductors with moderate indirect gaps of 0.87 eV and 0.21 eV within SOC, respectively. The Seebeck coefficient and power factor in the p-type are higher than those in the n-type. Ultra-low phonon thermal conductivities of 1.14 Wm−1 K−1 for Bi2O2Se and 0.58 Wm−1 K−1 for Bi2O2Te at 300 K are found, which are in agreement with the experimental values. The low-frequency optical phonons also make a dominate contribution to the lattice thermal conductivity. The lattice thermal conductivity shows strong anisotropy between the in-plane and the cross-plane. The optimal ZT values of p-type doping at 500 K reach 0.53 and 0.62 for Bi2O2Se and Bi2O2Te, respectively, due to the lower phonon thermal conductivity and the higher power factor. We also find that the effect of SOC on the thermoelectric performance is not negligible, and the SOC decreases the thermoelectric performance. The present work, especially the theoretical study on phonon transport properties for the first time, is helpful for the understanding and the optimization of thermoelectric properties of layered Bi2O2X.
Acknowledgments
This work was supported by the National Natural Science Foundation of China under Grant Nos. 11474113, 11804040 and 11504117.