

Abstract
In this communication, detailed studies of the structural, microstructural, dielectric, and electrical properties of polycrystalline materials, (Bi0.5Ba0.25Sr0.25) (Ti0.5Fe0.5)O3 and (Bi0.5Ba0.25Sr0.25) (Ti0.25Mn0.25Fe0.5)O3, synthesized by using a high–temperature solid-state-reaction method, have been reported. X-ray structural and scanning electron micrograph studies exhibit phase pure tetragonal system and surface morphology (size and distribution of grains and grain boundaries) of the samples respectively. Analysis of the temperature and frequency dependence of dielectric and electrical (impedance, modulus, and conductivity) data reveals the ferroelectric relaxor behavior, relaxation mechanism, and semiconductor (negative temperature coefficient of resistance) properties of the bulk BFBST and Mn modified BFBST electro-ceramics. The relaxation time and activation energy (Ea) were calculated from the above data. The characteristics of Mn modified BFBST have been compared to that of it's parent (BFBST) compound. The different inherent conduction mechanisms, such as Ohmic, hopping, space charge limited (SCLC) have been analyzed. The bulk- and interface-limited conduction processes were evidently found in the materials by the Poole–Frenkel (PF) and Schottky (SEmen modified BFBST have been compared to that of its parent (BFBST) compound) emission fitting of the J ∼ E characteristic data. The leakage data of BFBST-Mn (Mn modified Mn) quantified the average energy gap (Eg) in the range of 0.83–0. 87 eV for different applied voltages and in a wide range of temperature (25 °C–300 °C). With the increase in voltage, Eg decreases. This work suggests that Mn-substitution (Mn4+) at B (Ti4+) site keeping the stoichiometry undisturbed enhances structural, dielectric response (higher dielectric constant) and reduce the leakage behavior especially at low temperature and high-frequency range.
Export citation and abstract BibTeX RIS
1. Introduction
Nowadays, some materials with multiple ferroic-properties have become the main focus of attention due to they're wide applications, such as multi-state storage devices, dynamic random access memories (DRAM), sensors, actuators, transducers, spintronic and magneto-electric devices.The mutually exclusive nature of magnetism (refers to the spin orders of unpaired d-shell electrons) and ferroelectricity (coming from the empty d-shell) is often recognized as d0 ∼ dn-problem.The fascinating trend to combine the mutually conflicting order parameters (charge and spin) of ferroelectricity and anti/ferromagnetism in a single phase has been utilized to develop multiferroic materials of the different structural family including perovskite of ABO3 type. The ferroelectricity in one of the perovskite ferrites BiFeO3 (BFO) has occurred due to the off-center displacement of Bi3+ (A-site cations) as a result of the orientation of the 6s2 lone pair. This leads to the non-centrosymmetric rhombohedral structure [1]. Despite having magnetic phase transition temperature TN at 310 °C, ferroelectric phase transition temperature (TC ) at 850 °C [2] and the multiferroic coupling, few inherent internal problems (i.e., leakage current, structural stability, the occurrence of impurity phase) limit the material to be used for devices. Due to the highly volatile nature of Bi and variable oxidation states of Fe (Fe2+ and Fe3+), phase pure BFO is difficult to prepare. The unavoidable formation of impurity phases leads to produce oxygen vacancies, high leakage current, and weak ferroelectricity in the material. In order to solve the above problems (to improve ferroelectric and magnetic properties), countless research work has been carried out by focusing mainly on suitable substitutions at the A (Bi) and/or B-sites (Fe) of BFO [3, 4]. Eventually, the A-site substitution of Ca, Sr, and Ba in BFO were found to suppress the leakage current the most [5]. The Sr2+ and Ba2+ substitutions in the BFO lattice have enhanced the saturation polarization [6, 7]. On the other hand, ferroelectricity in another perovskite BaTiO3 (BT) appears due to the relatively average displacement of Ti4+ along the c-axis from its properties's point of the centrosymmetric. The addition of BT in BFO has enhanced its physical properties and stabilized the phase [8, 9]. Again, due to a high dielectric constant, less fatigue, and large breakdown strength, the addition of Sr modified BT (i.e., (Ba0.5Sr0.5)TiO3: BST) in BFO can be more effective to enhance its properties for some applications such as dynamic random access memories and microwave devices for telecommunication. Because of some special characteristics, namely high chemical stability, tenability, permittivity, and low loss, BST has more applicability in electronic devices [10]. Among many of the BFO-based systems, the lead-free BiFeO3-BaTiO3 (BF-BT) can be prepared with good ferroelectric properties with high TC. The structural change occurs in the order of the rhombohedral (x < 33%), pseudocubic (33% < x < 92%), and tetragonal (when x > 92%) symmetry in (1−x) BF-x BT. The morphotropic phase boundary (MPB) as well as a better dielectric response of the material has motivated the researchers to work on it [11]. According to Itoh et al [12], Mn doping greatly improved the resistivity of the BF-BT sample. The studies of (1−x) BF-x BT disclosed the frequency dispersion, relaxor type behavior, diffused phase transition, and a strong presence of magneto-electric (ME) coupling in the BF-BT system [13–15]. Balčiūnas et al [16] reported the anomalous dielectric behavior of BF-BT with three-phase transitions. Frequency dependence of double relaxation was crucially observed in this study. Sharma et al [1] found improved dielectric parameters (εr and tan δ) of (1−x) BFO-x BST with an increase in BST content (x). The presence of magneto-electric coupling, enhanced ferroelectric properties, and change in dielectric dispersion on an increasing BST content in the BF-BST system are found useful for lead-free energy-storage applications [17]. The room temperature ferroelectricity and ferromagnetism of (1−x) BST + xBiFeO3 (x = 0.01, 0.03, 0.05 and 0.07) have been reported by Zhang et al [18]. In this work, for 0.4 < x < 0.9, (1−x) BFO-x BST is reported to have centrosymmetric cubic phase. Ozaki et al [19] have proposed the coexisting state of distorted (polar) rhombohedral structure in the non-distorted (non-polar) cubic phase of (1−x) BiFeO3-xBaTiO3 for 0.33 < x < 0.50. However, due to the presence of two different perovskite systems, the resulting phase of the system and the appearance of ferroelectricity (with non-centrosymmetric configuration) are still to be examined. The dielectric constant needs to be increased further to maintain the scenario of searching for new materials that can alternate the traditional one. Based on the literature, it is found that the moderate dielectric constant, low tangent loss, large tenability, and good thermal stability are required for practical applications. The occurrence of chemical and compositional fluctuation/disorder in the material at the nano-scale shows the relaxor-type of ferroelectric characteristics useful for wide applications [20]. Because of the multivalence states of Manganese (Mn2+, Mn3+, and Mn4+), the substitution of Mn2+ for Fe3+ and Mn3+ for Ti4+ creates oxygen vacancies as well as lattice defects [21]. Therefore, on the addition of Mn at the Fe/Ti-site of BFO-BST-MT(Ba0.6Sr0.4TiO3-MgTiO3), a remarkable change in dielectric permittivity, tangent loss, and position of Curie Temperature (TC) and Neel temperature (TN) has been observed [10, 22]. The dielectric constant tenability was increased in the Mn substituted BST [23]. The detailed literature survey shows that not much work on the Mn modified BFO-BST of a composition 0.5BFO-0.5BST has been reported so far. With an assumption that every material (simple or complex) has it's own significance and characteristics, we have carried out a detailed study of the dielectric, relaxor, and electrical (impedance, modulus and conductivity and ferroelectric) characteristics of Mn modified 0.5BF-0.5BST for the better understanding of the leakage behavior related to various conductive appearances of the charge carriers. Thus, our main objective is to increase the dielectric constant, lower the leakage current, and to explore the anomalous dielectric behavior as well as the relaxor- type ferroelectric property of the material. As a small concentration of Mn ion creates fewer oxygen vacancies their is a chance to reduce the leakage ffect of the host materials by doping Mn. Again, Mn4+ has a comparable ionic radius as of Ti4+. In order to reduce the limitation of the base compounds (BFO and BST), with an idea that different valence elements give rise to noncentrosymmetric as well as distortion in the material will promote ferroelectricity, we have done the modification. The proposed work of Mn modified BFO-BST (i.e., BFBST-Mn) may trace the path for applications for capacitors, tunable dielectrics as well as multifunctional energy storage devices [24, 25].
2. Experimental
The polycrystalline samples of (Bi0.5Ba0.25Sr0.25)(Ti0.5Fe0.5)O3 (hereafter BFBST-0) and Bi0.5Ba0.25Sr0.25)(Ti0.25Mn0.25Fe0.5)O3 (referred as BFBST-Mn) with Mn substituted in the place of (half of) Ti4+ ions were synthesized by using standard ceramic technology (i.e., mechanical mixing in the air for 2 h and wet grinding with methanol for 3 h). Again in the formula, Bi, Fe, Ba, Sr, Ti, and O (oxygen) elements contribute 0.5, 0.5, 0.25, 0.25, 0.5, and 3 atomic proportions to a single perovskite maintaining the charge neutrality which is checked by oxidation states and charge proportion of each element. The valence of three oxygen atoms is −6. So the total cationic valence should be +6 so that the overall ABO3 compound will be neutral. The valence of the A-site atom is +3 which leads the B-site to have +3 (valence) like BiFeO3. Similarly, for +2 valence of the A-site element, like BaTiO3 the B-site can have only +4 valences. Likewise, the whole distribution of valence will make the materials neutral. The material should have a neutral charge (=cationic charge + anionic charge). In the present case, Mn4+ has been substituted at Ti4+. The high-purity precursors in oxide and carbonate forms; barium carbonate BaCO3 (M/S CDH (P) Ltd), titanium dioxide TiOu2 (M/S EMPLURA), bismuth oxide Bi2O3, iron oxide Fe2O3, strontium carbonate SrCO3 (extra pure precipitated by ammonia), and manganese dioxide MnO2 (M/S Loba Chemie Co Pvt Ltd, India). The chemical composition and stoichiometry with the ionic proportions of both the compounds are expressed as:
- (1)Parent BFBST (pure undoped)

- (2)Mn modified BFBST

The powders of the proposed stoichiometry were processed through dry and wet grinding modes; the mixtures were heated/ calcined at 1000 °C to get rid of impurities and volatile substances like CO2 keeping the heating rate fixed (i.e., 3°/minute). The phase analysis of the prepared powder samples was done by using x-ray diffraction (XRD) (RIGAKU ULTIMA IV, Japan) data recorded with CuKα radiation (wavelength = 1. 5405 Å) in a wide 2θ range of 20°–80° and scanning rate of 2°/min). The Rietveld structural analysis with MAUD software has confirmed the formation of a single tetragonal phase of the compounds. These powders were pressed into pellets of a diameter of 12 mm and thickness of 1–2 mm by applying the pressure of 3 × 10⁶ Pascal. Than the pellets were sintered at 1050 °C for proper densification and development of microscopic grain and grain boundaries. The surface morphology of the gold-coated pellet samples was recorded using the scanning electron microscope (SEM) of the ZEISS instrument performed at 10 kX. The compact pellets were silver-coated on the parallel surfaces for the electrical measurements. Electronic equipment having a circuit with an inductor (L), capacitor (C), and resister (R) in it (i.e., LCR meter (N4L PSM-1735)) was used for the electrical measurement in a wide range of frequency (10 kHz to 1 MHz) and temperature (25 °C–500 °C). The ferroelectric (P ∼ E) hysteresis loops and leakage characteristics with respect to different voltages were obtained from PE-loop tracer of M/S Marine India and high resistance meter (KEITHLEY 6517A/B Electrometer) respectively.
3. Results and analysis
3.1. Structural and micro-structural studies
To know crystal structure and phase purity of BFBST-0 and BFBST-Mn samples room temperature, XRD data/profile were analyzed through the Rietveld refinement method using 'MAUD' software. Figure 1 shows the refinement of the XRD pattern of both the above compounds (BFBST-0 and BFBST-Mn). The observed (black circles) and calculated (continuous red line) lines have the least difference (bottom blue line) between them. The green small sticks represent the position of the peaks which are Bragg diffracted from the surface of the samples. Both the samples exhibit the non-centrosymmetric single tetragonal (perovskite) ( space group P4mm) structure. The refined parameters show the correctness of structure and the position of the fundamental elements in the BFBST system. The peaks of the pattern were indexed and they're Miller indices (hkl) are shown in figure 1. The refinement parameters (i.e., lattice parameters, lattice volume, Wycuff sites, occupancy of the elements, and the thermal parameters (Uiso)) are given in table 1. The Wycoff positions of Bi3+/Ba2+/Sr2+ (A-site), Fe3+/Ti4+/Mn4+/ OI 2 (B-site) and OII 2- (O- site) ions occupying 1 (a) at (0, 0, z), 1 (b) at (1/2, 1/2, z) and 2 (c) at (1/2, 0, z) position respectively [26, 27] were taken as the standard references for the refinement.
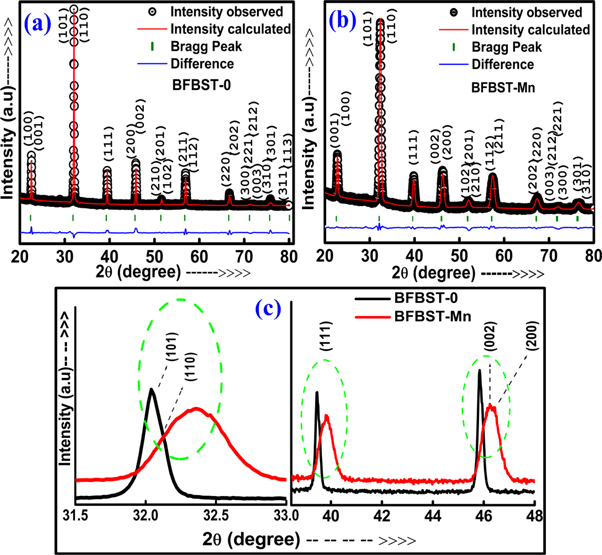
Figure 1 . Observed (black circles), calculated (continuous red line), and they're difference (bottom blue line) sketches for BFBST-0 and BFBST-Mn after the Rietveld refinement of RT-XRD data and (c) a comparison between the diffracted peaks of the two samples.
Download figure:
Standard image High-resolution imageTable 1. Reitveld refined parameters of BFBST-0 and BFBST-Mn samples.
| Lattice Parameters for Tetragonal (P4mm) of BFBST-Mn | Cell Vol. | Density(gm cm−3) | Fitted R-factors | CHI ^2 | |||||
|---|---|---|---|---|---|---|---|---|---|
| a = b (Å) | c (Å) | α = β = γ | V(Å3) | ρ | ωRp | Rp | (χ2) | ||
| 3.9355 | 3.9471 | 900.00 | 61.131 | 7.300 | 0.0490 | 0.0381 | 1.675 | ||
| σ = 4 × 10⁻⁴ | σ = 6 × 10⁻⁴ | 0.000 | 0.003 | ||||||
| A-site ions | B-site ions | X-site ions | |||||||
| Refined Parameters | Bi | Ba | Sr | Ti | Mn | Fe | O(1) | O(2) | |
| Site Occupancy | 0.500 | 0.2499 | 0.2499 | 0.2490 | 0.25 | 0.4968 | 1.5733 | 0.6362 | |
| Fractional Coordinate | X | 0 | 0 | 0 | 0.5 | 0.5 | 0.5 | 0.5 | 0.5 |
| Y | 0 | 0 | 0 | 0.5 | 0.5 | 0.5 | 0.5 | 0 | |
| Z | 0.982 | 0.982 | 0.982 | 0.5274 | 0.5274 | 0.5274 | 0.9837 | 0.398 | |
| Multiplicity | 1 | 1 | 1 | 1 | 1 | 1 | 1 | 2 | |
| Uiso | 0.026 | 0.092 | 0.096 | 0.025 | 0.025 | 0.0328 | 0.033 | 0.014 | |
| Lattice Parameters for Tetragonal (P4mm) of BFBST-0 (undoped) | CellVol. | Density (gm cm−3) | Fitted R-factors | CHI ^2 | |||||
| a = b (Å) | c (Å) | α = β = γ | V(Å3) | ρ | ωRp | Rp | (χ2) | ||
| 3.995 | 3.988 | 900.00 | 63.650 | 6.80 | 0.0710 | 0.0545 | 1.942 | ||
| σ = 1 × 10⁻⁴ | σ = 2 × 10⁻⁴ | 0.000 | |||||||
| A-site ions | B-site ions | X-site ions | |||||||
| Refined Parameters | Bi | Ba | Sr | Ti | Fe | O(1) | O(2) | ||
| Site Occupancy | 0.4980 | 0.2494 | 0.2496 | 0.4993 | 0.5038 | 1.3672 | 0.8295 | ||
| Fractional Coordinate | X | 0 | 0 | 0 | 0.5 | 0.5 | 0.5 | 0.5 | |
| Y | 0 | 0 | 0 | 0.5 | 0.5 | 0.5 | 0 | ||
| Z | 0.280 | 0.280 | 0.280 | 0.80 | 0.80 | 1.30 | 1.80 | ||
| Multiplicity | 1 | 1 | 1 | 1 | 1 | 1 | 2 | ||
| Uiso | 0.098 85 | 0.0225 | 0.0250 | 0.0251 | 0.0246 | 0.0012 | 0.0206 | ||
The CIF file of ref. no. 01-089-1428 was taken as the preferred model which the observed pattern supposed to be fitted with. The small value of ωRp, Rp, less σ and χ2 values signify the reliability of the fitting. The lattice parameters (a = b and c) of BFBST-0 and BFBST-Mn are found to be reliable and comparable to those of reported values [17]. The structure of both BFNST-0 and BFNST-Mn resembles that of BaTiO3 with a tetragonal (P4mm) unitcell [27] where the elements having respective atomic contributions are displaced in the z-direction and the cell gets elongated along the c-axis. The displacement has been quantified and the values are given in table 1. The XRD of the studied materials confirms the successful substitution of each element in definite proportion despite having different valences. The site occupancy values of each element in table 1 very much match with the atomic proportions taken earlier as precursor initially. Basically, impurities are the best example of the nonstoichiometry of a sample because impurities form due to deficiency of any element or volatilization of few element proportions during the calcination or heating process. In the absence of impurity/single tetragonal phase, occupancy of each atom from rietveld refinement of the compounds shows consistency. But with the undisturbed stoichiometry, the Mn substitution may produce distortion in a material, disturbing the internal energy of the system. Hence it can be put into words that 50% BST and 50% BF formed a good single-phase solid solution and Mn substitution did not disturb the structure.
The cationic radius (for coordination number (Cn) 6) of Mn4+ (0.530 Å) is smaller as compared to that of Ti4+ (0.605 Å) [28] which leads to a decreasing value of the bond length and the inter-planner spacing (d). Hence, Bragg diffraction angle (θ) increases with a decrease in d due to the inverse proportional relation: dsin θ = Const. Hence, a higher angle shifting of BFBST-Mn can be seen in figure 1(c) as compared to that of BFBST-0. A reduced value of the lattice parameters and lattice volume is obtained for Mn substitution at the Ti/B-site, whereas BFBST-0 exhibits comparatively sharper peaks then of BFBST-Mn. In table 1, the site occupancy of each element proves the stoichiometry of that element in BFBST systems. As Mn4+ (0.530 Å) has nearly equal to the ionic radius of Ti4+ (0.605Å), it does not effect the bond length and bond angle with the surrounding ions remarkably which keeps the structure undisturbed. Again Mn4+ controls the possibility of defect-appearance in the material. After the substitution, the tetragonal structure remains with no impurities present in the sample. The collective values of occupancy of A-, B- and O-site ions are nearly equal to 1, 1, and 3 respectively for both the BFBST compounds. The chemical stability of BFBST samples has a strong correlation with Goldsmith's tolerance factor (tG
) which identifies the deviation from the ideal cubic perovskite structure [29, 30]. The degree of distortion resulting from the mismatch in the ionic radius and bond length of A and/ B-site ions can be estimated by  for BFBST-0 and for BFBST-Mn accordingly. rBi3+ (=1.03 Å), rBa2+ (=1.61 Å) and rSr2+ (=1.44 Å), rFe3+ (=0.645 Å), rTi4+ (=0.605 Å), rMn4+ (=0.536 Å) and rO2− (=1.40 Å) are the ionic radii of the respective ions [28].The calculated
  is found to be 0.950 and 0.943 for pure (BFBST-0) and Mn modified BFBST (BFBST-Mn). Hence rA/rB exceeds 1 slightly and it indicates a slight difference in the size of the A- and B-site atoms [31]. This ultimately shows the distorted system with lower symmetry as compared to that of the cubic phase.
Figure 2 shows the SEM images of both the fracture surface of (a) BFBST-0 and (b) BFBST-Mn. This reflects the morphology of the samples at 10 kX (magnification). BFBST-0 seems to be more porous then BFBST-Mn. They're are homogeneously distributed few bigger grains with some smaller ones. The grains are found to be uniformly packed with less porosity. The manually calculated grain size is found to be 2.5 and 3.5 μm for BFBST-0 and BFBST-Mn, whereas the calculated average grain size through 'ImageJ' software is found to be 2.73 μm and 3.5 μm for BFBST-0 and BFBST-Mn respectively. The inter-granular distance (distance between two consecutive grains) is found to be 1.96 μm for pure and 1.91 μm for Mn modified sample. Thus BFBST-0 is seemed to be more porous then BFBST-Mn as seen in figure 2. The grains behave like conducting regions, whereas grain boundaries create the potential barrier for the charge carriers to flow. The smaller the grain size of BFBST-0 ultimately results in more grain boundaries, and hence more resistance to the charge carriers. Similarly, coarser the grain size of BFBST-Mn gives rise to lesser grain boundaries as well as less resistance. Therefore, the SEM images reveal less resistance of BFBST-Mn as compared to that of BFBST-0 which is reflected in figure 6(d).

Figure 2. SEM images of BFBST-0 (a) and (b) BFBST-Mn at 10 kX (magnification).
Download figure:
Standard image High-resolution image3.2. Dielectric properties:
The electric field being a function of time gives rise to complex dielectric constant, impedance, and modulus values when it is allowed to pass through a parallel plate capacitor. The complex variable carries both the stored and dissipated forms of energy of the dielectric medium. The complex dielectric permittivity with real ( ) and imaginary (
 ) part of it can be expressed mathematically as [32] the function of the frequency of the modified form of Debye relaxation called Havriliak—Negami relaxation model [17] as follows.

where 


 and are angular frequency, relaxation time, the low frequency static dielectric constant, high-frequency dielectric constant respectively. The frequency dependence of dielectric constant and dielectric loss can be seen in figures 3(a)–(c). With the increase of frequency, both the real and imaginary parts of permittivity decrease. This is the consequence of the frequency dependence of different types of polarization (starting from electronic polarization to the high-frequency space charge affect including ionic polarization and orientation of dipoles) involved. The frequency dependence of dielectric phenomena can be understood by the relation [32]:
  where
where  B (pre-exponential factor), and n (fractional exponent) are functions of temperature (T). For
  and/
and/
 behaves like independent of frequency which reflects the low and high-frequency plateau region. Again, the lower dielectric constant at the high-frequency region relates to the Maxwell-Wagner and Koop's phenomenological model. According to which the dielectric structure of polycrystalline materials consists of low resistive grains separated by less conducting grain boundaries figure 3(e) shows the frequency variation of the dielectric parameters of BFBST-0 and BFBST-Mn. With the increase in frequency resistivity and loss tangent are decreased. The low frequency, high resistive region corresponds to the grain boundary and the high frequency and low resistive regions reflect the bulk grain affect of both the samples [33]. Figures 3(a), (b), and (d) represent the temperature evolution of dielectric constant (
 ) and tanδ of BFBST-Mn and BFBST-0 at different frequencies. Figure 3(c) shows a comparison between the two samples at 10 kHz. BFBST-Mn has a higher dielectric constant and loss as compared to that of BFBST-0. Interestingly, the results of Mn doping profoundly depend on the obtained microstructure, additive content [34], host material, sintering temperature as well as concentration of Mn. For example, MnO2 was found to reduce current leakage and dielectric loss of BST [35], whereas the increase of Mn concentration increases loss, leakage current and but decreases the bandgap of BFO [36]. At a very low frequency (<10 kHz), the loss tangent of Mn modified BFO goes above 250 [37]. Other material, like Gd2NiMnO6 (another Pb-free relaxor) shows even higher tangent loss with Mn modification [38] at very low frequency (i.e. 1 kHz). Different oxidation states of Mn ions lead to oxygen vacancies in the BaTiO3, which probably contribute to the DC conduction process [39]. In figure 3(c), the comparison is done at 10 kHz. The tangent loss of BFBST-0 is less as compared to that of BFBST-Mn. The Mn substitution (in the present case) leads to the higher oxygen vacancy which results in higher loss as compared to that of the un-doped one. More briefly, MnO2 ( the precursor/ starting material-oxide) is one of the most interesting pathways due to it's multivalence states (Mn2+, Mn3+, and Mn4+) of Mn ions amongst many other metal oxides. The substitution of Mn2+ for Fe3+ and Mn3+ for Ti4+ creates oxygen vacancy. Mn3+ substituting Ti4+ ions lead to the creation of lattice defects. Mn ions increase the oxygen vacancy affecting the Fe3+ and Fe2+ ion conversion as: Mn2+ + Fe3+ → Mn3+ + Fe2. This shows the coexistence of Mn3+ and Mn2+ which is similar to Mn-doped BFO [40]. And in BFO based materials less concentration of Mn ion leads to less oxygen vacancy whereas oxygen vacancy becomes large for the higher Mn content A less concentration Mn ion creates less oxygen vacancy whereas the content of Fe2+ decreases with an increase in MnO2 (as a primary precursor). The increasing oxygen vacancy may play a vital role in the leakage of the BFO based system [41]. But in the present case, the substitution of Mn4+ at the Ti4+- site not only compensates the conversion of Ti4+ to Ti3+ but also affects the oxygen vacancy. And in BFO based materials to maintain the charge balance at the Fe-site,
  The addition of Mn4+ at Ti4+ site may give rise to the ultimate equation:
  and
and  Hence the less concentration of Mn ion leads to less oxygen vacancy whereas oxygen vacancy becomes large for higher Mn content as,
  and
and  A less concentration of Mn ion creates less oxygen vacancy whereas high Mn content increases loss. However Mn4+ substitution at the Ti4+ hinders the defect arising due to conversion of multi-valence states of Fe and Ti to some extent. The oxygen vacancy increases with a higher doping concentration of Mn- ion which may be the reason behind the high tangent loss. However, the loss tangent (tan δ) is very low at <100 °C, and in the high-frequency region basically proving a very high-quality factor (Q = ν × 1/tan (δ) of both the samples [42].

Figure 3. Temperature varying (a) εr and (b) tanδ of BFBST-Mn at a different frequency, (c) A comparison of dielectric parameters of BFBST-0 and BFBST-Mn at 10 kHz, (d) T ∼ εr of BFBST-0 and (e) frequency evolution of the dielectric parameters at different temperatures.
Download figure:
Standard image High-resolution imageSeveral studies [43, 44] may support the dielectric anomalous behavior of our study. The low-frequency first anomaly at about 160° may be due to Maxwell–Wagner type polarization [45], whereas the other two dielectric peaks (P-I and P-II) are related to the relaxation process. As the BiFeO3 parent material has two dielectric peaks at about 350 °C (TC) and at about 800 °C (TC), and again TC decreases with increasing BT (BaTiO3) concentration [2]. The anomalous behavior and phase transition temperature of the samples with more then one peak have been confirmed from the report of Zhu et al [24] and Sharma et al [1]. The dielectric curves tend to approach each other above the maximum temperature (Tm ), with an increase in frequency Tm shifts to a higher temperature, which is a typical characteristic of relaxor type ferroelectrics (RFE) which resembles the literature [1]. P-II is related to the diffused type of ferroelectric phase transition to paraelectric (cubic) phase, whereas P-I may not be a structural phase transition, but may relate to TN of host BFO. In figures 3(a) and (d), the resistivity increases with an increase in temperature up to the maximum, than decreases, which is the general trend of Curie Weiss law for a normal ferroelectric material where at Tm = TC = Curie temperature, a phase transition occurs from ferroelectric to paraelectric region. A similar trend can be observed for tanδ in figure 3(b). But, the dielectric permittivity deviates from the ideal behavior due to the addition of BST to BF (BiFeO3) [46]. But, in the case of RFE, the temperature evolution of dielectric permittivity exhibits frequency-dependent broad maxima. Hence, this behavior follows the modified Curie Weiss law [47]:

where  (diffusion coefficient lying in between 1 and 2) and C' are constants, Ta
= apparent transition temperature (extrapolated temperature calculated from the dielectric peak). As the T ∼
(diffusion coefficient lying in between 1 and 2) and C' are constants, Ta
= apparent transition temperature (extrapolated temperature calculated from the dielectric peak). As the T ∼  peaks have different diffusivity or the peaks are diffused type (the maxima is seemed to be wider) as well as relaxor type (dispersive in nature) at different frequencies. In this case, the value of apparent TC
or Tm
is generally obtained by the extrapolated data from the plot between 1/
peaks have different diffusivity or the peaks are diffused type (the maxima is seemed to be wider) as well as relaxor type (dispersive in nature) at different frequencies. In this case, the value of apparent TC
or Tm
is generally obtained by the extrapolated data from the plot between 1/ versus T (as shown in figures 4(a) and (b)). Figures 4(a) and (b) show the Ta
calculation from the extrapolation of temperature versus the inverse of dielectric permittivity data of BFBST-0 and BFBST-Mn at 10 kHz respectively.
versus T (as shown in figures 4(a) and (b)). Figures 4(a) and (b) show the Ta
calculation from the extrapolation of temperature versus the inverse of dielectric permittivity data of BFBST-0 and BFBST-Mn at 10 kHz respectively.  for ideal ferroelectric phase transition and
  for a complete diffusive phase transition. As can be seen in the figure, the dielectric parameter and polarizations of ferroelectrics are strongly frequency-dependent. In the low-frequency range (kHz–MHz); we reasonably get a high dielectric constant because of the major contribution of dipoles. Though we have taken data in the above range, we have selected dielectric data of the studied compounds and other calculations at 10 kHz for comparison. The temperature of maximum permittivity shifts towards lower values towards the low-frequency side which can be practically observed in figures 3(a) and (d). These attributes showed the slowing down of the relaxation process and hence can be analyzed through the Vogel-Fulcher (VF) law [48]. In figures 4(c) and (d) show the
  value of BFBST-0 and BFBST-Mn for P-I and PII respectively.
  is found to be 1.94 and 1.65 for BFBST-0 and
  = 1.889 and 1.4 for BFBST-Mn at P-I and P-II respectively. Comparing the values, P-I is more diffusive then P-II and the diffusivity got reduced due to Mn replacement in BFBST. The relaxor-type of the peak is believed to occur due to the disorder or frustration, charge inhomogeneity induced from the compositional variation in most of the perovskite. The appearance of polar nano regions (PNRs) and the short-range polar nano-clusters (present within) on a local scale is responsible to break the translational symmetry to prevent the long-range dipole order. The system tends to freeze into a glass-like state on cooling to the critical temperature [47]. TB
is the Burn's temperature where PNRs start appearing. The range within TB
and Tm
is responsible for the deviation from the ideal Curie-Weiss law. The non-Arrhenius behavior of the temperature dependence of the relaxation process can be analyzed from the Vogel-Fulcher (VF)—relation [47]:
= 1.889 and 1.4 for BFBST-Mn at P-I and P-II respectively. Comparing the values, P-I is more diffusive then P-II and the diffusivity got reduced due to Mn replacement in BFBST. The relaxor-type of the peak is believed to occur due to the disorder or frustration, charge inhomogeneity induced from the compositional variation in most of the perovskite. The appearance of polar nano regions (PNRs) and the short-range polar nano-clusters (present within) on a local scale is responsible to break the translational symmetry to prevent the long-range dipole order. The system tends to freeze into a glass-like state on cooling to the critical temperature [47]. TB
is the Burn's temperature where PNRs start appearing. The range within TB
and Tm
is responsible for the deviation from the ideal Curie-Weiss law. The non-Arrhenius behavior of the temperature dependence of the relaxation process can be analyzed from the Vogel-Fulcher (VF)—relation [47]:

where Ea
is the activation energy of the charge transporters, f0 = frequency of relaxation. Figures 5(a) and (b) show the VF-plots (i.e., lnf ∼ 1/T and lnf ∼ 1/T-TVF) of BFBST-Mn for P-I respectively. The activation energy of the BFBST-Mn is found to be in the range of 0.476-0.5 eV at different temperatures. This signifies the energy required to activate the charge carriers for strong temperature-dependent behavior. Ea plays a very important role and is responsible for all the reactions occurring/ being accelerated in the material [49]. The fitting parameters of the VF-plot are as follows: TVF
= 699 K ∼ 426 °C, f0 = 7.8 × 10⁻⁶ Hz,  is 2.0 × 10⁻⁶ s. And Ea
= 1.48 eV.
is 2.0 × 10⁻⁶ s. And Ea
= 1.48 eV.

Figure 4. (a), (b) Calculation of Tm by extrapolation of the plot between 1/ and temperature of both the samples at 10 kHz, (c), (d) calculation of
  value from the plot of ln(1/
 versus ln(T-Tm))of BFBST-0 and BFBST-Mn for P-I and PII.
Download figure:
Standard image High-resolution image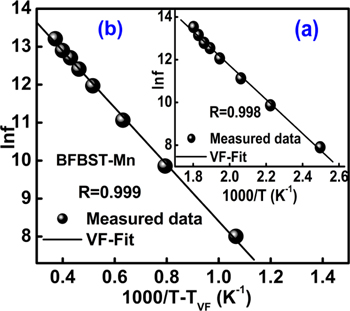
Figure 5. Vogel-Fulcher plot (a) lnf ∼ 1/T and (b) lnf ∼ 1000/T-TVF of BFBST-Mn for corresponding to P-I.
Download figure:
Standard image High-resolution image3.3. Electrical analysis
3.3.1. Complex impedance, modulus, and AC conductivity
Complex impedance spectroscopy (CIS) is used to study the electrical (impedance, modulus, and conduction) mechanisms, electrical contributions of grain and grain boundary affect, different types of conduction processes associated with the materials under investigation. Figures 6(a) shows the variation of real ( ), imaginary (
 ) part of the complex impedance (
 ) with the frequency of BFBST-Mn and a comparison between BFBST-0 and BFBST-Mn at room temperature (as an inset figure). The complex impedance has real and imaginary parts;

where,  and
and 
 can be re-defined by the Cole-Cole relation [32] considering the DC conductivity as follows. The complex impedance data have been modeled by the equivalent circuit consisting of parallel and series combination of resistors (R) and capacitors (C) so that the least-squares fitting of the circuit to the observed data will be able to interpret the micro-grain and grain boundary information. Their is a strong relationship between the complex impedance and grain and grain boundary resistance and capacitance [50]. Figure 6(a) represents frequency varying Z' and Z'' of BFBST-Mn at different temperatures. Both the values of Z' and Z'' decrease with an increase in frequency. This shows the inversely proportional character of impedance with frequency. The frequency dispersion of impedance can be understood from the equation (3.2.1.a). In the high-frequency plateau region, all the impedance tracks approaching each other indicate the space-charge affect. Again, both the Z' and Z'' decrease with an increase in temperature, which shows the negative temperature coefficient of resistivity (NTCR) behavior of the BFBST-Mn within 25 °C–300 °C. This negotiates the increasing trend of conductivity with the ascending temperature. Figure 6(d) shows the positive temperature coefficient of resistance (PTCR) behavior of BFBST-0 as compared to that of BFBST-Mn. BFBST-Mn is found to have a greater impedance as compared to that of the parent one (BFBST-0) at 25 °C. The frequency dependence of Z'' curves can be defined by the relation:
  indicating the non-Debye type of relaxation occurring in both the BFBST compounds. The relaxation mechanism in the materials occurs basically due to the immobility of the electrons at low temperatures and vacancies/defects at high temperatures [51]. Here
  = relaxation time and
  is the maximum frequency. With the increase of temperature, the peaks shift towards the high-frequency side. The temperature dependence of
  follows the Arrhenius relation:
  the slope of
  ∼ 1/T (as shown in figure 6(c) gives the average value of the activa
tion energy (Ea
) (i.e., 0.50 eV) for the given temperature range. The pre-exponential factor
∼ 1/T (as shown in figure 6(c) gives the average value of the activa
tion energy (Ea
) (i.e., 0.50 eV) for the given temperature range. The pre-exponential factor  has the value: 8.5 × 10⁻⁶ s for BFBST-Mn.
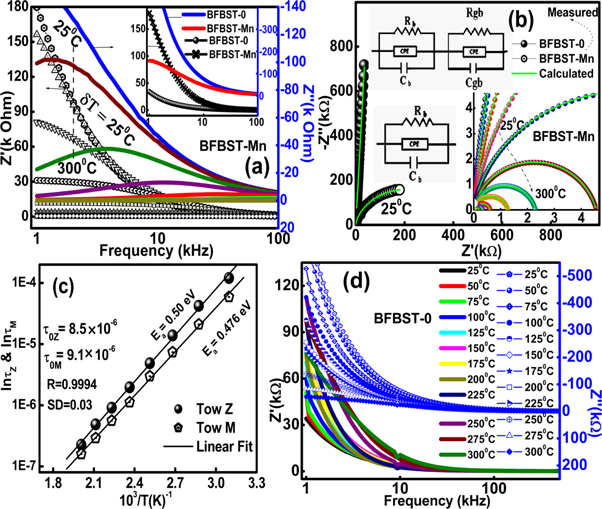
Figure 6. (a) Variation of Z' and Z'' with respect to the frequency at different temperatures, (b) Nyquist plot (Z'' versus Z') and (c)  versus inverse temperature in absolute scale of BFBST-Mn. (d) A comparison of impedance (both real and imaginary) values between BFBST-0 and BFBST-Mn at room temperature.
Download figure:
Standard image High-resolution imageFigure 6(b) shows the Nyquist plot between Z' and Z'' of the Mn modified sample (inset) at different temperatures and a comparison between BFBST-0 and BFBST-Mn at RT. The center of the depressed semicircles lies just below the real (Z') axis, which clarifies the non-Debye type relaxation phenomena involved. The observed data are perfectly fitted to the equivalent circuit (RgQ1Cg)(RgbQ2Cgb) where Q, Rg, Cg , Rgb and Cgb are the constant phase element (CPE), grain and grain boundary resistance, and capacitance respectively. Here, the impedance ![${Z}_{Q}={[{(j\omega )}^{n}C]}^{-1}$](https://content.cld.iop.org/journals/1402-4896/96/3/035804/revision2/psabd1ffieqn47.gif) (parameters have they're usual meaning), represents the deviation from the ideal Debye behavior in the circuit [52]. With the increase in temperature the intercept of the semicircles with the Z' axis (bulk resistance) decreases, this again confirms the NTCR behavior of BFBST-Mn. The first semicircle as present in our samples represents the grain (bulk) affect whereas the second and third semicircles (not observed) represent grain boundary and electrode affect. The grain boundary contribution observed at very high temperatures, which obstructs charge carriers to flow. Hence the low resistance and less frequency dependent region refer to the grain affect whereas a high resistive dispersive region is due to grain boundaries present within the sample microscopically.
(parameters have they're usual meaning), represents the deviation from the ideal Debye behavior in the circuit [52]. With the increase in temperature the intercept of the semicircles with the Z' axis (bulk resistance) decreases, this again confirms the NTCR behavior of BFBST-Mn. The first semicircle as present in our samples represents the grain (bulk) affect whereas the second and third semicircles (not observed) represent grain boundary and electrode affect. The grain boundary contribution observed at very high temperatures, which obstructs charge carriers to flow. Hence the low resistance and less frequency dependent region refer to the grain affect whereas a high resistive dispersive region is due to grain boundaries present within the sample microscopically.
The electric modulus directly relates to the dielectric relaxation phenomenon of grains and grain boundaries [53] occurring due to the applied electric field in the material. It gives an idea about the activation energy and relaxation time related to dipoles as well as the bulk affect. The complex modulus ( ) being the reciprocal complex permittivity has also real and imaginary components (M'' and M') [54]. Figure 7(a) shows the variation of M'' and M' as a function of frequency at different temperatures. It can be seen that at each temperature the real part of modulus M' is approaching zero in the low-frequency region. This corresponds to the long-range mobility of the charge carriers and the electrode polarization affect [55]. A continuous increment of M' with increasing frequency is saturated in the high-frequency region, which may be due to the short-range mobility of the charge carriers. The frequency versus M'' plot in figure 7(a) symbolizes the relaxation affect. Each M'' peak is confined to the relation:
  for
for  The relaxation time (
 ) and Ea
corresponding to the modulus data are calculated as 9.1 × 10⁻⁶ S and 0.47 eV respectively. The values are calculated from the Arrhenius fitting in figure 6(c). Figure 7(b) shows M'' versus M' semicircles indicating the bulk affect of BFBST-Mn. A comparison of the modulus values between BFBST-0 and BFBST-Mn can be observed in figure 7(c). BFBST-Mn is found to have higher modulus value and an improved bulk affect as compared to that of the parent one. Figure 7(d) shows the frequency-dependent M' and M'' of BFBST-0 which slightly differs from the modified one (BFBST-Mn). BFBST-Mn has lesser M' and M'' value, hence higher dielectric values as compared to that of BFBST-0. An increase in the asymmetric peak-width with an increase in temperature signifies the reduction in the non-Debye type relaxation time of the charge carriers [51].
) and Ea
corresponding to the modulus data are calculated as 9.1 × 10⁻⁶ S and 0.47 eV respectively. The values are calculated from the Arrhenius fitting in figure 6(c). Figure 7(b) shows M'' versus M' semicircles indicating the bulk affect of BFBST-Mn. A comparison of the modulus values between BFBST-0 and BFBST-Mn can be observed in figure 7(c). BFBST-Mn is found to have higher modulus value and an improved bulk affect as compared to that of the parent one. Figure 7(d) shows the frequency-dependent M' and M'' of BFBST-0 which slightly differs from the modified one (BFBST-Mn). BFBST-Mn has lesser M' and M'' value, hence higher dielectric values as compared to that of BFBST-0. An increase in the asymmetric peak-width with an increase in temperature signifies the reduction in the non-Debye type relaxation time of the charge carriers [51].
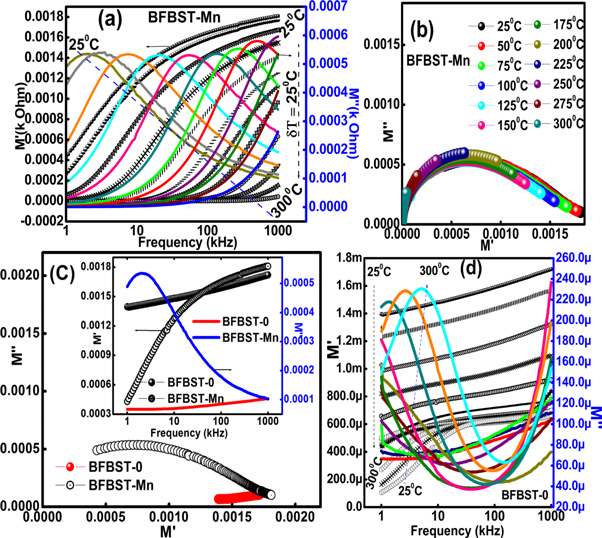
Figure 7. Real and imaginary part of complex modulus of (a) BFBST-Mn and (d) BFBST-0 varying with frequency at different temperatures, (b) M'' versus M' of BFBST-Mn and (c) a comparison of the modulus values between the modified and unmodified sample.
Download figure:
Standard image High-resolution image3.3.2. AC conductivity
Figure 8(a) exhibits the frequency dependence of electrical AC conductivity ( ) at different temperatures. The frequency dependence of
  is found to obey the 'universal dielectric response' law [56]:
  where A and n (0 < n < 1) (frequency power-law exponent) are temperature constants,
  is the frequency-independent DC part of the conductivity of BFBST-Mn. The parameter n represents the measure of interaction between portable ions with the environments or surroundings whereas A signifies the polarization strength.
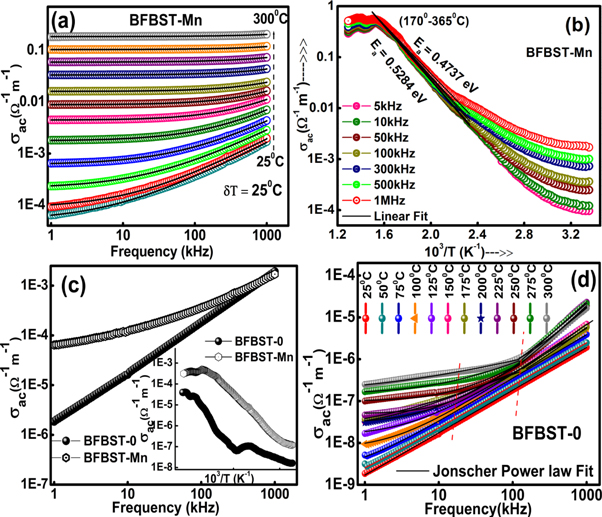
Figure 8. AC conductivity variations with (a) frequency at different temperatures and with (b) inverse absolute temperature at various frequencies. (c) A comparison of AC conductivity value between BFBST-0 and BFBST-Mn at 25 °C and (d) f ∼ σac curves of BFBST-0.
Download figure:
Standard image High-resolution imageThe conductivity relates to the dielectric data through the empirical relation  (
( is the permittivity in the air). The frequency-dependent curves obeying Jonscher's power law have three different regions; (i) a low-frequency region, where
  the current passes through the resistors leaving the conductivity being frequency independent, (ii) the intermediate-frequency region where the admittance of the capacitor
  becomes comparable to
  and (iii) high-frequency region where
  is frequency-dependent (where
  ), thus current starts to flow through the capacitance network [57]. The Jonscher's power law fitting parameters of the frequency-dependent
  are listed in table 2 with very less Chi2 and high goodness of fit (R2). Table 2 shows a close variation in the exponent value n and also A. A non-zero 'n' implies the energy stored by the collective motion of ions [58]. The variation of n with temperature connotes a possible reason for conduction mechanisms. The tabulated values indicate a gradual increase in n with temperature up to 150 °C and than started decreasing up to 300 °C.
Table 2. Jonscher's power law fitting parameters obtained from the plot of frequency versus AC conductivity.
| BFBST-Mn | |||||
|---|---|---|---|---|---|
| Temp. (°C) |

| A | n | Chi2 | R2 |
| 25 | 0.000 05 | 1.0 × 10⁻⁷ | 0.70 | 2.32 × 10⁻¹⁰ | 0.9986 |
| 50 | 0.000 09 | 9.6 × 10⁻⁸ | 0.71 | 1.3 × 10⁻¹⁰ | 0.999 44 |
| 75 | 0.000 21 | 2.0 × 10⁻⁷ | 0.686 | 8.7 × 10⁻¹⁰ | 0.998 02 |
| 100 | 0.000 61 | 2.6 × 10⁻⁷ | 0.693 | 3.74 × 10⁻¹⁰ | 0.999 58 |
| 125 | 0.001 77 | 1.94 × 10⁻⁷ | 0.74 | 2.88 × 10⁻¹⁰ | 0.999 84 |
| 150 | 0.004 44 | 1.42 × 10⁻⁷ | 0.78 | 3.71 × 10⁻¹⁰ | 0.999 87 |
| 175 | 0.008 84 | 1.56 × 10⁻⁷ | 0.779 | 2.96 × 10⁻¹⁰ | 0.999 13 |
| 200 | 0.016 02 | 1.7 × 10⁻⁷ | 0.778 | 7.0 × 10⁻¹⁰ | 0.998 26 |
| 225 | 0.033 23 | 4.2 × 10⁻⁷ | 0.73 | 3.7 × 10⁻¹⁰ | 0.994 27 |
| 250 | 0.059 13 | 1.42 × 10⁻⁷ | 0.6972 | 2.57 × 10⁻¹⁰ | 0.975 |
| 275 | 0.103 39 | 9.82 × 10⁻⁷ | 0.6973 | 2.08 × 10⁻⁷ | 0.986 |
| 300 | 0.184 93 | 1.63 × 10⁻⁶ | 0.68 | 6.08 × 10⁻⁷ | 0.976 |
The nonlinear nature of the frequency exponent implies the presence of two models of conduction. These are: (i) Non-overlapping Small Polaron Tunneling (NSPT) part where n increases with increase in temperature and (ii) the correlated barrier hopping model (CBH) where 'n' decreases with increasing temperature. The temperature below the 150 °C NSPT model is applicable for increasing n with rising in temperature [59]. The affected atom is believed to be screened by an electron charge cloud which generates the interaction between the electron and phonon cloud and the polaron (quasi-particle) tunneling occur to contribute to the conduction process. Assuming that the addition of a charge carrier to a site. It is assumed that the small polaron can be formed by the addition of a charge carrier to a site causing a large extent of local lattice distortion. These small polarons may cause relaxation resulting in frequency-dependent conductivity in a material. And above 150 °C, s decreases with an increase in temperature. The conduction mechanism occurs due to a single or bi-polaron over the Coulomb barrier existing between two imperfect voids [60]. In the CBH model charge carriers hop the potential barrier between the localized sites. The parameter 's' is predicted to be both temperature and frequency-dependent depending upon the width of the effective barrier height. The value of frequency-dependent activation energy obtained from the Jonscher's power law fitting of frequency versus AC conductivity curves is given in table 3.
Table 3. Activation energy at different frequencies calculated from the Jonscher's power law fitting of frequency versus AC conductivity curves.
| Frequency | 5 kHz | 10 kHz | 50 kHz | 100 kHz | 300 kHz | 500 kHz | 1 MHz |
|---|---|---|---|---|---|---|---|
| Ea (eV) | 0.5285 | 0.5307 | 0.5267 | 0.5241 | 0.5097 | 0.4998 | 0.4737 |
3.3.3. Leakage characteristics
The leakage current is one of the prominent attributes for any ferroelectric material to be used in device manufacturing. The study explores a number of models that are used to investigate different types of conduction mechanisms associated with the flow of charge carriers. Those are bulk limited including; (i) Ohmic conduction, (ii) space charge limited conduction (SCLC), (iii) Pookel-Frankel (PF) emission, (iv) Hopping conduction, and (v) Grain-boundary-limited conduction. The other one is the interface limited conduction mechanism which includes (i) Schottky (SE) emission and (ii) Fowler-Nordheim (FN) tunneling. The models are engrossed to fit the J-E curves of the samples to facilitate the understanding of the leakage behavior. Figure 9(a) shows the variation of leakage current of BFBST-Mn density varying with the change in an applied electric field in both forward (+E) and reverse (−E) bias at different temperatures. Room temperature J ∼ E curve for BFBST-0 is shown in the inset. A good symmetry in both positive and negative bias can be seen here. The leakage current increases with an increase in temperature due to the thermal activation of the charge carriers. This resembles the affect of increasing conductivity with the increase in temperature. BFBST-0 has a higher leakage value as compared to that of BFBST-Mn at room temperature. The higher the leakage ultimately lowers the resistivity of the sample. Figure 9(b) shows the I–V-characteristics of both the samples at room temperature. The directly proportional behavior of voltage (V) and (current) I defines the conduction process, obeying Ohm's law called Ohmic conduction mechanism. The I–V characteristics resemble the temperature-dependent resistance of a thermistor with a negative temperature coefficient of resistance (NTC). Figure 9(d) represents the resistance of BFBST-Mn depending exponentially on temperature, which also resembles thermistor like behavior. Mathematically, it is being expressed as  where A' and B' are constants [61].
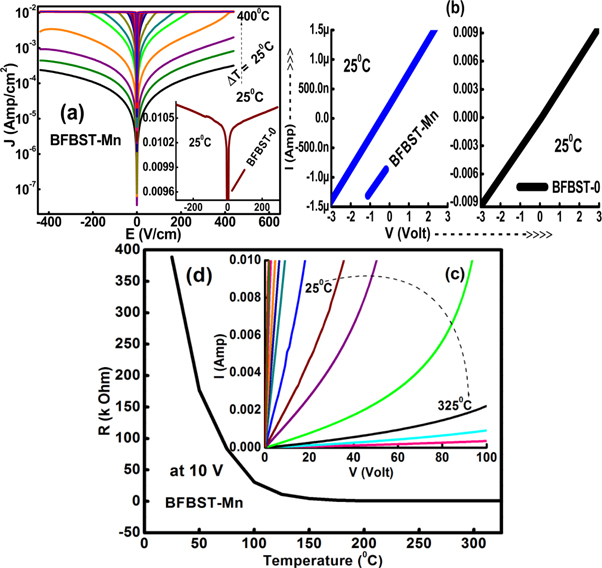
Figure 9. (a) Leakage current versus electric field (J versus E) curves of BFBST-Mn, (b) Leakage current versus applied voltage (I versus V) of BFBST-Mn and BFBST-0 at RT (25 °C) and (c) V versus I of Mn modified BFBST at different temperatures. (d) Temperature variation of resistance (R = V/I) of BFBST-Mn at 10 Volt.
Download figure:
Standard image High-resolution imageIn figures 10(a) and (b) clearly represent log J versus log E of (a) BFBST-Mn and a comparison of the values between BFBST-0 and BFBST-Mn at 25 °C. The leakage current density increases with an increase in an applied electric field. The slope with m ∼ 1 refers to the charge transport phenomena of the Ohmic type at the low field region and for m ∼ 2 the charge carriers obey Child's square law at the high field region of BFBST-Mn. The steep increase in J refers to the accumulation of space charges called space charge limited conduction (SCLC) process [5]. The linear dependence of J up on E is specified by the relation:

where, E, n0, q, and d replicate DC applied field, the density of charge carriers, charge, mobility, and thickness of the layer respectively. The quadratic dependence of J on E i.e.  from the Child's square law which states that:

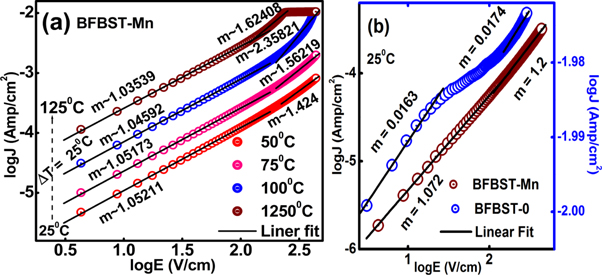
Figure 10. log J ∼ log E plot of BFBST-Mn at different temperatures with the Ohm's and Child square law fitting at both the low and high field region, (b) A comparison between the two BFBST samples (BFBST-0 and BFBST-Mn) at RT.
Download figure:
Standard image High-resolution imageIt can be observed that BFBST-0 has high leakage as compared to that of BFBST-Mn in figure 10(b). The parent compound: BFBST-0 does not show any of the above mechanisms as m < 1.
Figure 11 presents the plot of (a–b) lnJ versus E1/2 and (c–d) lnJ/E versus E1/2 respectively. The linear fitting of the plots displays the SE and PF-emission mechanisms. The Richardson-Schottky emission (SE) is the high-field conduction process that occurs due to the decreasing metal-insulator interfacial barrier height. This happens due to the appearance of image force arising due to the attractive coulombic attraction between electron and hole. Here, the hole is due to the polarization of the escaped electrons. An enhanced thermo-ionic emission occurs by lowering the barrier height due to the application of an external electric field.
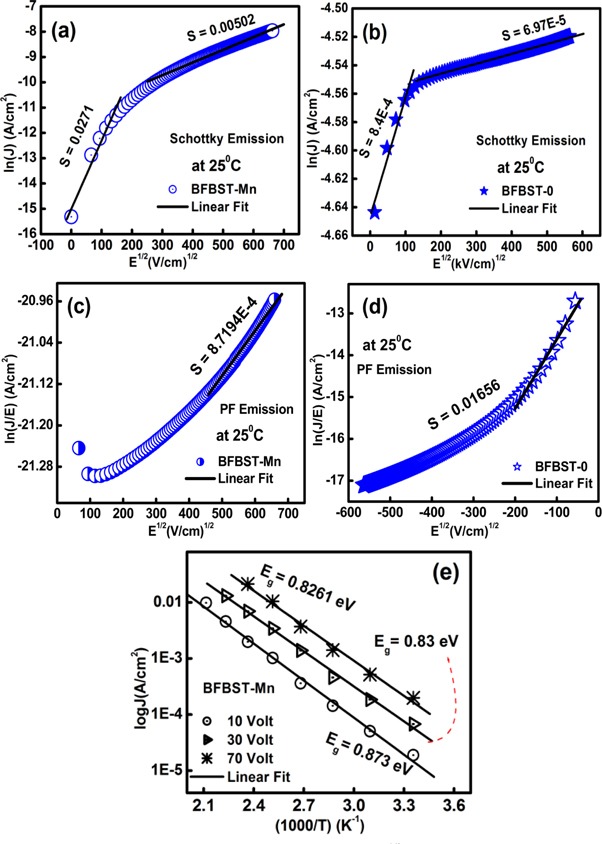
Figure 11. Fitting of SE conduction mechanism to lnJ versus E1/2 plot of (a) BFBST-Mn and (b) BFBST-0 at RT. PF-emission fitting to lnJ/E versus E1/2 plots (c)–(d) of the samples at RT. (e) The Arrhenius linear fit of BFBST-Mn at different DC applied voltages (10, 30, 70 Volt).
Download figure:
Standard image High-resolution imageSE emission [62] can be stated as:

Poole-Frankel (PF) emission is about the lowering of coulombic potential barrier surrounding a localized charge when an external electric field is applied. PF- affect ultimately increases the probability of electrons escaping from the traps contributing to the conduction process. The resultant-current density can be written as:

where A = Richardson constant, B = constant, Ei
= trap ionization energy.  = potential barrier height, k = Boltzmann constant, T is the absolute temperature, and K = permittivity of the medium. Figures 11(a) and (b) signify the linear fit of lnJ versus E1/2 plot showing the SE emission of the two studied samples. The linear fitting of lnJ/E versus E1/2 plot gives rise to PF-emission of BFBST-Mn and BFBST-0 as shown in figures 11(c) and (d). Figure 11(e) shows the calculation of the energy gap (Eg) from the Arrhenius fit of the current-density as a function of the inverse temperature of BFBST-Mn at three different voltages (10, 30, 70 Volt). The current density for Ohmic conduction is found to obey Arrhenius relation with temperature61]:

where, the energy gap between the conduction and valence band (Eg ) = 2 (EC -EF ) = energy gap of the dielectric and E = applied electric field. The slope of the plot quantified the energy gap (Eg ) to be 0.87, 0.83, and 0.82 eV at constant electric field values i.e., 10, 30, and 70 eV respectively. It can be observed that with the increase in an applied electric field the energy gap decreases because the more the applied field more is the leakage current.
3.3.4. Ferroelectric property
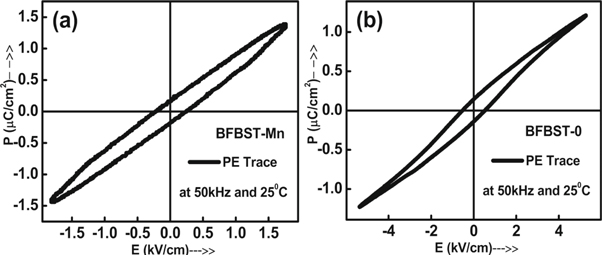
To investigate the ferroelectric properties, field-dependent polarization measurement has been carried out through P-E loop tracer of M/s Marine India to obtain a hysteresis loop. Figure 12 illuminates the hysteresis loop of (a) BFBST-Mn and (b) BFBST-0 at absolutely different applied fields (i.e., 2 kV cm−1 and 5 kV cm−1). Though these loops are not saturated and proper for ferroelectrics, the nature of the loops somehow suggests the existence of ferroelectricity as well as the non-centrosymmetric phase of the materials. As both the components of the BFBST-0 and BFBST-Mn have ferroelectric properties, these unsaturated and banana-type loops can be considered as ferroelectric loops. Such types of loops are observed for many ferroelectric and magneto-electric materials. As the studied materials contain Fe/Mn, they could not be poled at high electric fields. It could be one of the reasons for not getting saturated hysteresis loops.
Figure 12. Polarization versus electric field hysteresis curves of (a) BFBST-Mn and (b) BFBST-0.
Download figure:
Standard image High-resolution image
The remnant polarization (2Pr ) values are 0.34 μC cm−2 and 0.29 μC cm−2 and coercive fields (EC ) are calculated to be 0.23 kV cm−1 and 0.54 kV cm−1 for unpoled samples of BFBST-Mn and BFBST-0 respectively. The thin loop, a negligible saturation, and less value of Pr may be due to the relaxor type ferroelectric behavior of the BFBST samples. The area covered by the P-E loop defines the energy loss, whereas the area above the loop describes the energy storage for the material. Therefore the leakage is directly proportional to the area of the loops. Here the P-E hysteresis loop of BFBST-0 has a slightly more area then BFBST-Mn (as shown in figures 12(a), (b) at 50 kHz (room temperature). This clearly indicates the higher leakage of BFBST-0 as compared to that of BFBST-Mn at room temperature which can be verified from figure 9(b).
4. Conclusion
The recently studied single-phase compounds: BFBST-Mn and BFBST-0 were synthesized by the high-temperature solid-state route successfully. The Rietveld analysis of the XRD pattern of the compounds confirmed tetragonal arrangement having well-calculated lattice parameters, site occupancy of each contributing ions, less thermal parameter, and the fractional coordinate (X, Y, and Z) values which clarified the structure briefly. SEM image shows the homogeneity, less porosity, and formation of grain and grain boundaries over the surface of the samples. Grains offer less resistance, whereas grain boundaries impede the charge carriers more to flow. BFBST-Mn offers a high dielectric constant and higher tan  value as compared to that of BFBST-0. The samples showed anomalous dielectric behavior with multiple peaks. The frequency-dependent dielectric dispersion signifies the relaxor ferroelectric nature with the diffusive phase transition of both the samples. P-II corresponds to TC
of the system. The diffusion coefficient and relaxor nature has been quantified with the help of modified Curie Weiss law and Vogel-Fulcher law fitting respectively. Mn modified sample has less diffusivity as compared to that of the parent one. Relaxation time and activation energy are calculated to be
value as compared to that of BFBST-0. The samples showed anomalous dielectric behavior with multiple peaks. The frequency-dependent dielectric dispersion signifies the relaxor ferroelectric nature with the diffusive phase transition of both the samples. P-II corresponds to TC
of the system. The diffusion coefficient and relaxor nature has been quantified with the help of modified Curie Weiss law and Vogel-Fulcher law fitting respectively. Mn modified sample has less diffusivity as compared to that of the parent one. Relaxation time and activation energy are calculated to be  = 2.0 × 10⁻⁶ s. and Ea
= 1.48 eV respectively. Impedance and modulus property reveal the relaxation phenomena (
= 2.0 × 10⁻⁶ s. and Ea
= 1.48 eV respectively. Impedance and modulus property reveal the relaxation phenomena ( = 8.5 × 10⁻⁶ and
  = 9.1 × 10⁻⁶ S), NTCR behavior of BFBST-Mn, and PTCR nature of BFBST-0. Again, temperature and frequency dependence of AC conductivity shows the thermal activation and dispersion phenomena. J ∼ E-characteristics confirmed the presence of different types of conduction mechanisms such as bulk limited (Ohmic, SCLC/space charge limited, hopping, and Schottky emission type) and interface-limited (Poole–Frenkel emission) type. Both the Pf and SE effects are appearing due to the Coulomb potentials which ultimately reduced the barrier height due to the applied electric field. The temperature dependence of the current density of the Ohmic conduction process exposed the Arrhenius behavior and the linear fitting at different constant electric fields. This gives the energy gap values (Eg
) ∼ 0.87, 0.83, 0.82 eV at E ∼ 10, 30 and 70 eV respectively. Eg
decreases with an increase in an applied electric field which refers to the field-induced conduction/leakage process which may be the positive sign to make the compound beautiful over the parent one. However, BFBST-Mn has less leakage current as compared to that of BFBST-0. Again Mn modified sample has a very much less loss factor at room temperature and high-frequency region. The Mn modified material has less leakage current, relaxor type ferroelectric nature, and high dielectric constant as compared to that of parent one (BFBST-Mn). With the restricted region of higher frequency and low temperature (including room-temperature), the material (with Mn) may extend the possibility of high energy storage applications. A farther investigation may need to understand it's magnetic ordering and ME character as well to enhance the applicability of the system.
= 9.1 × 10⁻⁶ S), NTCR behavior of BFBST-Mn, and PTCR nature of BFBST-0. Again, temperature and frequency dependence of AC conductivity shows the thermal activation and dispersion phenomena. J ∼ E-characteristics confirmed the presence of different types of conduction mechanisms such as bulk limited (Ohmic, SCLC/space charge limited, hopping, and Schottky emission type) and interface-limited (Poole–Frenkel emission) type. Both the Pf and SE effects are appearing due to the Coulomb potentials which ultimately reduced the barrier height due to the applied electric field. The temperature dependence of the current density of the Ohmic conduction process exposed the Arrhenius behavior and the linear fitting at different constant electric fields. This gives the energy gap values (Eg
) ∼ 0.87, 0.83, 0.82 eV at E ∼ 10, 30 and 70 eV respectively. Eg
decreases with an increase in an applied electric field which refers to the field-induced conduction/leakage process which may be the positive sign to make the compound beautiful over the parent one. However, BFBST-Mn has less leakage current as compared to that of BFBST-0. Again Mn modified sample has a very much less loss factor at room temperature and high-frequency region. The Mn modified material has less leakage current, relaxor type ferroelectric nature, and high dielectric constant as compared to that of parent one (BFBST-Mn). With the restricted region of higher frequency and low temperature (including room-temperature), the material (with Mn) may extend the possibility of high energy storage applications. A farther investigation may need to understand it's magnetic ordering and ME character as well to enhance the applicability of the system.
Novelty of the work
In this work, Mn substitution has been made at Ti4+ (B-) site of 0.5BFO-0.5BST (perovskite) system and the work has been compared to that of the parent BFBST. Mn-modified along with the parent BFBST-system, possess a single tetragonal phase with no impurity. Manganese substitution increased the dielectric constant and dielectric loss of the parent BFBST. The relaxor type ferroelectric behavior of the compounds enhances the beauty of the materials in the system. The leakage characteristics are able to identify the different types of conduction process and the energygap of the materials. The microscopic view of the charge transport phenomena has been illuminated with the activation energy within 0.476–0.5 eV at different situations of temperature. As compared to that of the previous work Mn substitution does not disturb the stoichiometry of the perovskite as it gives a single-phase system. Hence stability of perovskite has been increased as compared to that of the previous work [63]. However, the activation energy and the energy gap of Mn modified BFBST has been evaluated.