
Abstract
Objective. We developed a simulated driving environment for studying neural correlates of emergency braking in diversified driving situations. We further investigated to what extent these neural correlates can be used to detect a participantʼs braking intention prior to the behavioral response. Approach. We measured electroencephalographic (EEG) and electromyographic signals during simulated driving. Fifteen participants drove a virtual vehicle and were exposed to several kinds of traffic situations in a simulator system, while EEG signals were measured. After that, we extracted characteristic features to categorize whether the driver intended to brake or not. Main results. Our system shows excellent detection performance in a broad range of possible emergency situations. In particular, we were able to distinguish three different kinds of emergency situations (sudden stop of a preceding vehicle, sudden cutting-in of a vehicle from the side and unexpected appearance of a pedestrian) from non-emergency (soft) braking situations, as well as from situations in which no braking was required, but the sensory stimulation was similar to stimulations inducing an emergency situation (e.g., the sudden stop of a vehicle on a neighboring lane). Significance. We proposed a novel feature combination comprising movement-related potentials such as the readiness potential, event-related desynchronization features besides the event-related potentials (ERP) features used in a previous study. The performance of predicting braking intention based on our proposed feature combination was superior compared to using only ERP features. Our study suggests that emergency situations are characterized by specific neural patterns of sensory perception and processing, as well as motor preparation and execution, which can be utilized by neurotechnology based braking assistance systems.
Export citation and abstract BibTeX RIS

Content from this work may be used under the terms of the Creative Commons Attribution 3.0 licence. Any further distribution of this work must maintain attribution to the author(s) and the title of the work, journal citation and DOI.
1. Introduction
Recent neurophysiological research has been concerned with the use of brain signals for driving assistance systems. Most of the studies focused on maintaining safety by measuring and detecting drivers' physical conditions and mental states such as decreased concentration [1] or sleepiness [2–4] during a monotonous drive. Other studies focused on controlling the vehicle based on different kinds of brain signal components and paradigms such as steady state visual evoked potentials [5], contingent negative variation, anticipatory brain potentials [6], and a head-up display system [7].
In a recent study, upcoming emergency situations during simulated driving were detected using event-related potentials (ERPs) [8]. This study demonstrated that neurophysiological correlates of emergency braking occur about 130 ms earlier than corresponding behavioral responses related to the actual braking, which—at a speed of 100 km h−1—amounts to a reduction of the stopping distance by 3.66 m. Thus, the study demonstrated that neurophysiological signals may be used to prevent serious traffic accidents. However, the degree of realism in the study of Haufe et al was rather low, since the participants were exposed to a very reduced set of driving situations. Additional experiments involving more diverse scenarios and environments are therefore needed in order to verify the feasibility of performing neurophysiology based emergency braking intention detection in practice.
In this article, we investigate whether a driverʼs braking intention can be detected in diverse driving scenarios. In our experiment, the participants drove a virtual vehicle and were exposed to several kinds of traffic situations in a simulator system, while electroencephalography (EEG) signals were measured. The simulated situations were categorized according to whether the driver intended to brake or not. Additionally, each simulated situation had sub-categories. The braking situations were divided into two kinds of braking intentions: emergency braking (sharp braking) and normal braking (soft braking). Additionally, in the no braking situation, participants did not intend to brake. In emergency braking situations, there were three kinds of realistic scenarios: the sudden stop of a lead vehicle, the sudden cutting-in of a vehicle from a neighboring lane, and the unexpected appearance of a pedestrian.
With the present study, we increase the diversity of driving situations compared to [8] by considering these multiple kinds of emergencies, and study neural responses of braking intention in emergency and non-emergency situations. Previous research has examined the detection of different kinds of movement intentions based on EEG [9–11]. One signal component used in these studies was the readiness potential (RP), a preparatory (i.e., pre-movement) component that indexes movement intention [12]. We here use a feature combination based on ERPs (i.e., visual evoked potentials and the P300 component), the RP, and event-related desynchronization (ERD) to distinguish diverse driving situations such as sharp braking in an emergency situation, soft braking in a normal situation and no braking in a driving situation lacking braking intention. Note that the term ERP is typically used for both stimulus- and response locked signals. However, we here only use it to refer to stimulus-locked signals, while the term is used to refer to a specific response-locked signal.
The rest of the paper is structured as follows. First, the class-discriminability of univariate ERP features is investigated. Second, a classification methodology based on combining multivariate spatio-temporal features is proposed. Third, we assess the class discriminative power of our novel feature combination scheme using a classification approach. To demonstrate the performance of the proposed method, we compare the area under the specificity-sensitivity curve (AUC) of the classification results obtained using the ERP features and our novel feature combination. In addition to distinguishing emergency situations from normal driving, we also investigate differences between soft and sharp braking. Finally, we summarize our findings in the discussion section.
2. Material and methods
2.1. Participants and experimental setup
Fifteen healthy individuals (all male and right-handed, age 27.1 ± 1.7 years) participated in this study. All participants had a valid driverʼs license and had driven three years without an accident. All had normal or corrected-to-normal vision. None of the participants had a previous history of psychiatric, neurological, or other diseases that might otherwise affect the experimental results. The experimental procedures were explained to each participant. Written informed consent was obtained from all participants before the experiment. The participants received a monetary reimbursement for their participation after the completion of the experiments. The participants were seated in a driving simulator cockpit (made by R.CRAFT in Korea) with fastened seat belts (the experimental apparatus is shown in figure 1).
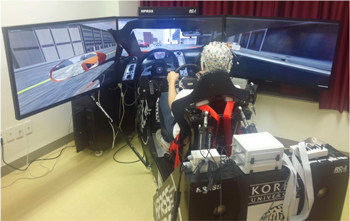
Figure 1. The experimental apparatus and environment.
Download figure:
Standard image High-resolution imageThe virtual driving environment displayed on the screen was developed using the Unity 3D (Unity Technologies, USA) cross-platform game engine. This environment resembled an urban neighborhood without traffic lights, and included autonomous (computer-controlled) vehicles as well as a vehicle to be steered by the participant. There was a six-lane road. The right three lanes were used by the participant. In addition, artificially-induced traffic situations to be analyzed occurred in these three lanes. Autonomous vehicles drove in the first and second lane; the third (rightmost) lane was empty. In addition, there was also oncoming traffic in the left three lanes. The distance between vehicles on the first and second lanes was 50 m. The speed of the virtual vehicles was held constant at 85 km h−1. Pedestrians stood on the sidewalk at 100 m intervals.
2.2. Experimental paradigm
The participants' task was to drive a virtual vehicle using the accelerator and brake pedals and the steering wheel; the virtual vehicle was equipped with a virtual automatic transmission. They were instructed to drive freely without getting into an accident, and to perform immediate braking to avoid crashes if necessary. The maximum speed of the participantʼs vehicle was 120 km h−1. Thus, the participant could pass autonomous vehicles. We defined three kinds of braking situations based on braking intensity. First, if an emergency situation occurred, the participants were instructed to depress the brake pedal sharply. We defined this situation as sharp braking. Second, when the participant performed spontaneous braking to decrease the vehicleʼs speed, the vehicle decelerated 'softly' (i.e., gradually). This situation was defined as soft braking. Finally, in many situations, the participants did not need to decrease the speed of their vehicle. Besides normal driving situations, this was also true if a lead vehicle a long distance away braked abruptly, or if a close-by vehicle on the neighboring lane braked abruptly. We defined this situation as no braking. For all of the stimuli, the inter-stimulus interval was between 4 and 18 s, and drawn randomly from a uniform distribution (see figure 2).
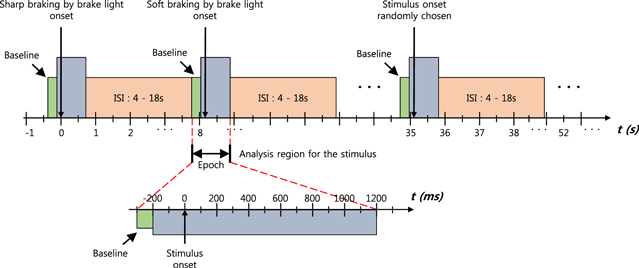
Figure 2. Timing scheme of the experimental paradigm.
Download figure:
Standard image High-resolution image2.2.1. The sharp braking condition
There were three kinds of stimuli inducing sharp braking (emergency) situations. The sharp braking by brake light condition was given, when the vehicle in front of the participant (lead vehicle) abruptly decelerated, and the participantʼs vehicle was within 50 m distance. The lead vehicleʼs brake light flashing was defined as the stimulus onset in this condition (see figure 3(a)).
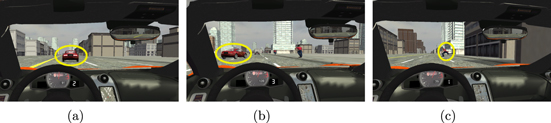
Figure 3. Stimuli related to emergencies. (a) Sharp braking by brake light. (b) Sharp braking by cutting-in. (c) Sharp braking by pedestrian.
Download figure:
Standard image High-resolution imageThe sharp braking by cutting-in condition occured, when a vehicle on the neighboring lane (side vehicle) abruptly cut in front of the participantʼs vehicle, and the participantʼs vehicle was less than 50 m behind the side vehicle. The moment in which the side vehicle came across the lane was defined as the stimulus onset (see figure 3(b)). Finally, in the sharp braking by pedestrian condition, a pedestrian moved quickly toward the participants' vehicle from the side. This only happened when the participantʼs speed was between 60 km h−1 and 110 km h−1. The moment, in which the pedestrian left the sidewalk was defined as the stimulus onset (see figure 3(c)).
2.2.2. The soft braking condition
The soft braking condition was defined based on spontaneous braking in absence of any stimulus. Since the roads in the virtual driving environment were curved, acceleration and decelaration phases took turns. To slow down the vehicle, the participants spontaneously depressed the brake pedal. In this soft braking, the moment in which the participant depressed the brake pedal was defined as the response onset (see figure 4(a)).
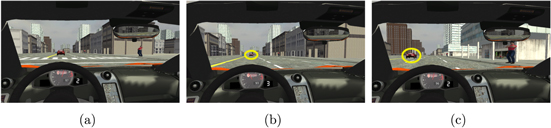
Figure 4. Stimuli not related to emergencies. (a) Soft braking or normal driving (no stimulus). (b) No braking by brake light. (c) No braking by brake on neighboring lane.
Download figure:
Standard image High-resolution image2.2.3. The no-braking condition
The no-braking condition comprised three kinds of traffic situations. One was normal driving, where the participants just focused on driving, and no stimulus was given (see figure 4(a)).
The no braking by brake light condition occured, when a lead vehicle abruptly decelerated, but the distance to the participantʼs vehicle was between 50 m and 90 m. In this condition the participants did not have to depress the brake pedal. The stimulus onset was defined as the moment in which the lead vehicleʼs brake light flashed (see figure 4(b)).
The no braking by brake on neighboring lane condition was given, when the lead vehicle on a neighboring lane abruptly decelerated, and the distance to the participantʼs vehicle was less than 50 m. In this condition, participants did not have to depress the brake pedal. The side vehicleʼs brake light flashing was defined as the stimulus onset in this condition (see figure 4(c)).
2.3. Data acquisition and preprocessing
The EEG signals were recorded using a multi-channel EEG acquisition system from 64 scalp sites based on the modified International 10–20 system [13]. We used Ag/AgCl sensors mounted on a cap (actiCAP, Brain Products, Germany). The ground and reference electrodes were located on scalp position AFz and the nose, respectively. The sampling rate was 1000 Hz throughout the experiments. The low cut-off and the high cut-off frequencies were 0.1 and 250 Hz, respectively.
Electromyographic (EMG) signals were acquired using a unipolar montage at the tibialis anterior muscle. The impedances of the EEG and EMG electrodes were below 10 kΩ. The EEG and EMG data were amplified and digitized using BrainAmp hardware (Brain Products, Germany).
Brake and gas pedal deflection markers were acquired at a 50 Hz sampling rate provided by the Unity 3D software. The time points of the braking response were defined based on the first noticeable brake pedal deflection that exceeded the jitter noise level. The threshold defining response onsets based on brake pedal deflection was set separately for each subject, because the jitter noise level was different for each subject.
The EEG signals were low-pass filtered (tenth-order causal Chebychev type II filter) at 45 Hz, and the EMG signals were band-pass filtered between 15 and 90 Hz (sixth-order causal Elliptic filter). To remove line noise, we applied a second-order digital notch filter at 60 Hz to the EMG signals. Moreover, the EMG signals were rectified by taking their absolute value.
The sampling rates of the physiological (EEG and EMG data) and mechanical (brake and gas pedal data) channels were down-sampled or up-sampled to 200 Hz for synchronization.
Three kinds of main classes of situations were pre-defined, and each class had sub-classes. In addition, there were four different ways of extracting segments ('epochs') from the data. The four different types of segmentation are explained in the section 1 of supplementary material.
For data analysis, three different kinds of preprocessings were considered, corresponding to three different types of features (ERP, RP and ERD) to be extracted from each epoch (see below). In all cases, the data were first baseline-corrected by subtracting the mean amplitude of the first 100 ms from each epoch. For the extraction of ERP components, no additional processing was performed.
To obtain the RP only the time interval between −300 and 600 ms relative to the stimulus onset was used. The reaction time was defined based on the braking response. To emphasize the late signal content, the signal was convolved with a one-sided cosine function before applying a Fourier transform (FT) filtering technique. The one-sided cosine window function was given by  , where n is the sample index and t is the number of sample points of the epoch [14, 15]. The pass-band for the FT filtering was between 0.4 and 3.5 Hz.
For extracting ERD features, the continuous data were band-pass filtered between 5 and 35 Hz (fifth-order Butterworth filter) before epoching, and a spatial Laplace filter was applied.
For visualizing response-aligned ERD, the following preprocessing was applied. The continuous data were band-pass filtered between 8 and 25 Hz (fifth-order Butterworth filter) before epoching, and a spatial Laplace filter was applied. After epoching, the envelope (instantaneous amplitude) of the epoched data was computed by a Hilbert transform, and the logarithm was taken. In the case of RP, the epoched data were convolved with a one-sided cosine function, and then band-pass filtered between 0.4 and 3.5 Hz (FT filtering).
The 45 Hz low-pass EEG filter was causal, as were all other temporal filters applied. However, for computing the Hilbert transform, entire epochs were used.
2.4. ERPs and AUC analysis
The arithmetic mean of the extracted epochs of all 15 participants was computed to obtain grand-average ERP signals. Additionally, the discriminability of univariate (single-timepoint single-sensor) features with respect to the three pre-defined classes was investigated using the AUC measure [16]. This analysis was conducted separately for each pair of classes. The AUC is symmetric around 0.5, where scores greater than 0.5 indicate that a feature has higher values in class 1 than in class 2 and scores smaller than 0.5 indicate the opposite (smaller values in class 1) [16, 17]. The arithmetic mean of the AUC scores across the participants was calculated to obtain grand-average AUC scores.
2.5. Feature extraction
Three different types of features were extracted from the corresponding preprocessed data described above. First, ERP features were extracted from ten discriminating time intervals (not necessarily of equal length) determined heuristically for each channel [18]. These time intervals were selected only using training data. The same intervals were used for the test data.
In case of the RP feature extraction, three discriminating time intervals between 350 and 600 ms post-stimulus were determined using same heuristic used in the ERP feature extraction. The average signal in the three intervals was used as the RP feature vector.
To extract ERD feature, we used common spatial pattern (CSP) analysis. Since the variance of bandpass filtered signals equals their bandpower, CSP filters are well suited to discriminate mental states that are characterized by ERD effects. The variance was computed within each epoch of the CSP-transformed data to obtain an estimate of the band power, and the logarithm of the bandpower was used as the ERD feature. When the classification performance was computed for sliding windows (see below), the CSP transformation matrix was computed only once for each individual subject, namely in latest time window (−200 to 1200 ms relative to the stimulus), and on the training data (see below). The same transformation matrix was then applied to all epochs of the training and test data sets.
The combination features were normalized by subtracting their empirical means and dividing with their empirical standard deviations as estimated on the training sets to rescale the three kinds of features after concatenation of features. The test data sets were also normalized in the same way by subtracting the empirical means and dividing with the empirical standard deviations as estimated on the training data sets.
2.6. Classification
As in [8], we evaluated the extent to which different feature modalities contribute to the overall decoding performance. Classifiers were trained on various kinds of single modalities and modality combinations. These modalities were EEG (feature combination), EEG (only ERP features), EMG, and BrakePedal, which denotes the driverʼs actual brake pedal inputs. Moreover, we analyzed the following modality combinations: EEG (feature combination) + EMG + BrakePedal and EEG (only ERP features) + EMG + BrakePedal. Moreover, the combinations EMG + BrakePedal, EEG (feature combination) + BrakePedal, and EEG (only ERP features) + BrakePedal were used to evaluate the contribution of the EMG and brakepedal modalities to decoding performance. Lastly, the decoding performance based on the BrakePedal modality alone was assessed.
Each feature was computed for all electrodes. Therefore, the dimension of the ERP feature vectors is 640. Analogously, the dimension of the RP feature vectors is 192 (i.e. 3 RP features were computed for all electrodes). Moreover, there are 6 ERD features. Thus, the combined feature vector has 838 dimensions.
The first half of the epochs were used as the training set, and the second half were used as the test set. The entire analysis process including preprocessing is shown in figure 5.
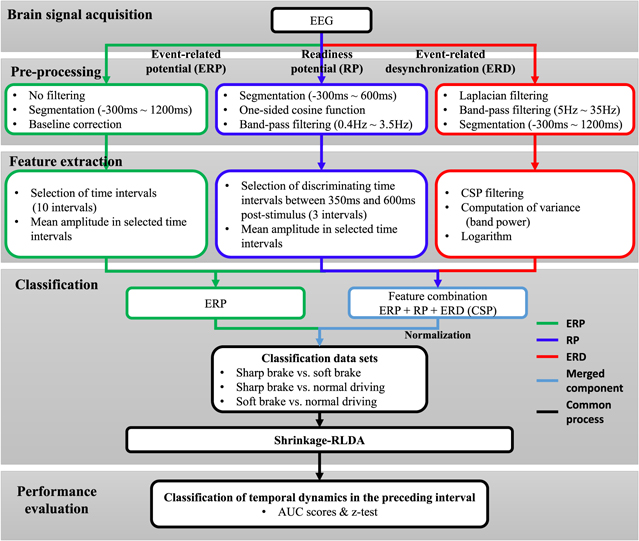
Figure 5. Schematic flow of the data analysis process.
Download figure:
Standard image High-resolution imageThe class discriminability of optimized combinations of spatio-temporal features was investigated using the regularized linear discriminant analysis (RLDA) classifier [19, 20]. For regularization, the automatic shrinkage technique [21–24] was adopted. We had three classes of driving situations. For each pair of classes we calculated the AUC scores of the RLDA outputs on the test set.
2.7. Statistical testing
Whether a given AUC score was significantly different from 0.5 (that is, chance level) on the population level was assessed by means of an two-sided Wilcoxon signed rank test [25]. To assess whether two scores AUC1 and AUC2 were significantly different from each other, the difference AUC1–AUC2 was tested for being nonzero using the same two-sided Wilcoxon signed rank test. Bonferroni-correction was implemented to obtain reliable p-values [26]. The correction factor was 301 (time instants) 64 (electrodes) = 19 264 in the ERP analysis. For other channels, we used a correction factor of 301 (time instants). P-values smaller than 0.05 were considered statistically significant.
3. Results
3.1. ERP analysis related to braking conditions
Each of the three classes of driving situations induced a specific cascade of brain activities representing low- and high-level processing of the (visual) stimulus as well as motor preparation and execution. The same number of braking situations was induced for all braking types and subjects. However, after filtering and artifact rejection, the number of trials used in the analysis of neural correlates differed. On average, 57.1 ± 12.3 trials related to sudden stops of lead vehicle, 60.5 ± 8.1 trials related to cutting-in of lead vehicle, and 44.7 ± 5.6 trials related to sudden appearance of pedestrian were used in the data analysis. The detailed number of trials across all subjects and conditions is presented in section 2 of supplementary paper. Half of the trials were used for training the classifier, and the remaining trials were used to evaluate the decoding performance. We here take a closer look at the spatio-temporal ERP sequences reflecting the class-discriminative brain processes. The results of similar analyzes of response-aligned data are provided in section 3 of the supplementary material.
Figure 6 shows topographical maps of grand average AUC scores in five subsequent 160 ms long time intervals. Figure 6(a) shows the AUC scores related to the difference between sharp braking and no braking. The feature value of sharp braking is higher than that of no braking ( ) in the time interval between 320 and 800 ms post-stimulus in parietal areas. The AUC score is maximal in the time interval between 480 and 640 ms (
 ,
,  ). The electrode having the highest AUC score (0.58) between 480 and 640 ms post-stimulus is Pz. On the other hands, the higher feature value of no braking than that of sharp braking (
 ) is observed in the time interval between 160 and 320 ms in lateralized occipital areas (
 ), and in the time interval between 320 and 800 ms in central areas (
 ). The electrode Cz shows the lowest AUC score (0.40) between 320 and 480 ms post-stimulus.
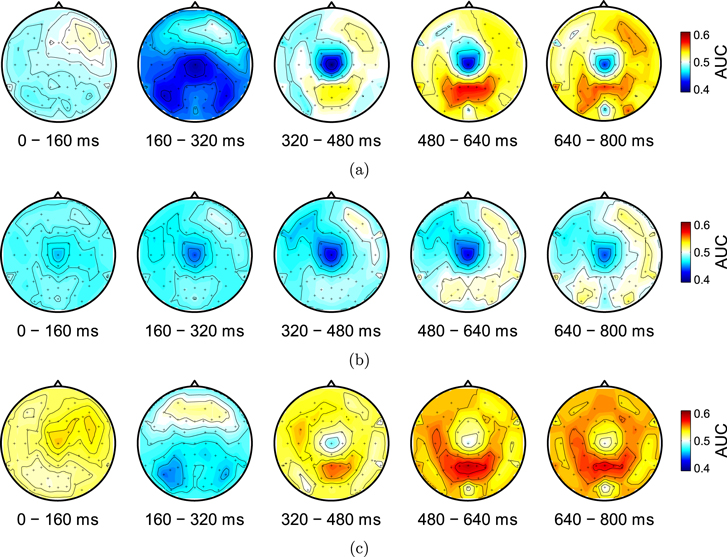
Figure 6. Topographical maps of grand-average AUC scores calculated from average ERPs in five temporal intervals. (a) Sharp braking versus no braking. (b) Soft braking versus no braking. (c) Sharp braking versus soft braking.
Download figure:
Standard image High-resolution imageFigure 6(b) shows the AUC scores related to the difference between soft braking and no braking. The higher feature value of no braking than that of soft braking is observed in the entire time interval in central areas. The lowest AUC score (0.43) is observed in the electrode Cz between 320 and 480 ms post-stimulus. The electrode TP10 has the highest AUC score (0.53) between 640 and 800 ms post-stimulus. Figure 6(c) depicts the AUC scores related to the difference between sharp braking and soft braking. Here, the highest feature value of sharp braking is observed in parietal/occipital areas in the time interval between 480 and 640 ms ( ,
,  ), while a highest feature value of soft braking around electrode Cz is observed in the time interval between 320 and 640 ms (
 ). The electrode P7 has the lowest AUC score (0.44) between 160 and 320 ms post-stimulus, while the highest AUC score (0.59) is observed in electrode Pz between 480 and 640 ms post-stimulus. Thus, sharp braking elicits stronger feature values than soft braking, and is moreover characterized by the additional presence of visual-evoked potentials and a P300 component. Note that it is impossible to distinguish emergency braking situations from normal driving (e.g., no-braking events) before the stimulus. Therefore, the classification before stimulus onset must be at chance level as indicated by AUC scores of 0.5.
3.2. Comparison of classification results based on ERP features and a novel feature combination
The results of the classification analyses using multivariate features are shown in figure 7. These features were extracted from stimulus-locked segments. Additional analyzes were performed to measure the decoding performance based on response-locked segments (similar to Bai et al 2011, Lew et al 2012, Demandt et al 2012, Gheorghe et al 2013). More details on these analyzes are contained in section 4 of the supplement. The classification performance was measured in terms of AUC scores achieved by the outputs of LDA classifiers on test data. These classifiers were trained to distinguish two of the three classes. Thus, there were three different class combinations to consider. Figure 7 provides a time-resolved assessment of the classification performance, where the AUC score at each time point represents the accuracy achievable using the preceding 1500 ms long segment of data. The boxplots in figures 7 and 8 show the distribution of reaction times (defined as the first above-threshold Brake pedal deflection) for the sharp braking condition. Note that for the soft braking condition artificial stimulus onsets were sampled from the same distribution. The distributions of the reaction times for the different types of emergency situations are presented in section 2 of the supplement.
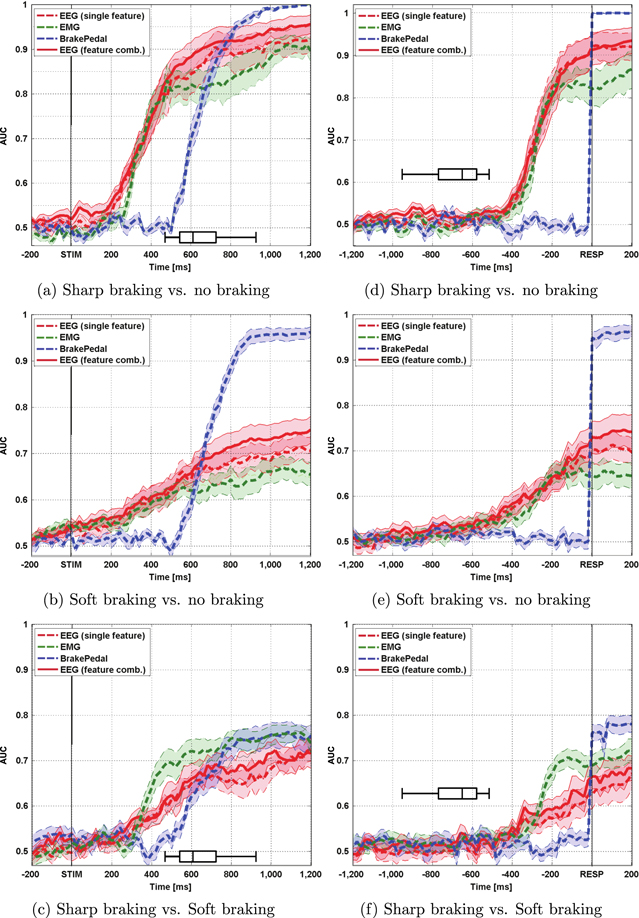
Figure 7. Classification performances based on ERP feature and novel feature combination. The stimulus-locked results are shown in left column and the response-locked results are shown in right column. The distribution of reaction times for the sharp braking condition is depicted by boxplots. The areas of shaded color represent standard errors of the mean (SEM) of the AUC scores.
Download figure:
Standard image High-resolution image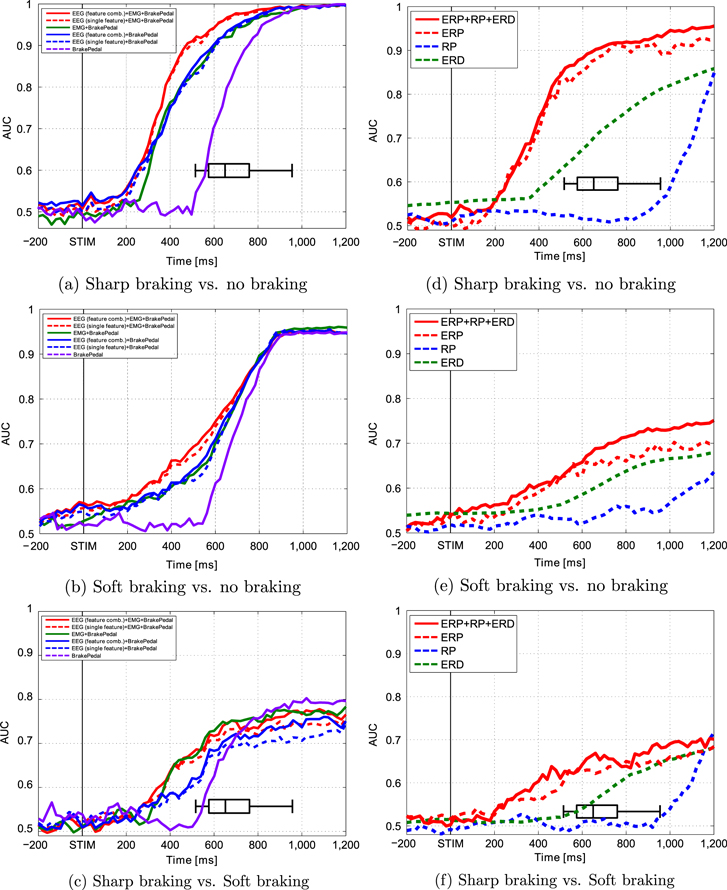
Figure 8. Decoding performance based on different combinations of modalities (left column) and classification performance achieved based on different individual features (right column). The distribution of reaction times for the sharp braking condition is depicted by boxplots.
Download figure:
Standard image High-resolution image
The classification results with respect to distinguishing sharp braking and no braking based on ERP features are similar to the results previously achieved by [8] (see figure 7(a)). The AUC scores of both single features and the proposed feature combination based on EEG exceeded 0.6 after 260 ms post-stimulus. In addition, the score of both EMG and brake signal exceeded 0.6 after 320 and 580 ms post-stimulus, respectively. The AUC of the EEG using the novel feature combination exceeded a value of 0.9 80 ms faster compared to the score obtained using ERP features alone. The novel feature combination showed significantly better performance compared to the ERP features from 640 to 1200 ms post-stimulus ( ; largest difference at 960 ms,
  ,
,  ).
).
The performance with respect to distinguishing the soft braking and no braking conditions is presented in figure 7(b). For EEG, the scores using the novel feature combination were considerably higher than the scores obtained from using ERP features only. For ERP only features, the AUC exceeded 0.6 at 440 ms post-stimulus, while for the novel feature combination it was 340 ms post-stimulus. In addition, the novel feature combination achieved significantly better performance than ERP-only features from 760 to 1200 ms post-stimulus ( ; largest difference at 840 ms,
  ,
, 
Finally, the performance in classifying sharp braking and soft braking based on ERP features was dramatically lower compared to using EMG features in the entire time interval considered. On the other hand, the performance was improved by means of the proposed combination of EEG features, although the achieved scores were still lower than those obtained from EMG. The novel feature combination achieved an AUC score of 0.6 120 ms earlier than the corresponding ERP-only features. It was significantly better than the ERP features alone in the interval from 380 to 440 ms post-stimulus (significant with  ; largest difference at 420 ms,
  ,
,  ). These results are presented in figure 7(c). The detailed descriptions for the response-locked results are provided in section 4 of the supplementary material.
3.3. The decoding performance of single feature modalities
Figure 8 depicts the decoding performance of single features for all three combinations of braking types. No significant difference between ERP features and the combination of all features can be seen when discriminating sharp braking and no braking (figure 8(a)), as well as soft braking and no braking (figure 8(b)). However, the decoding performance when including all features is higher than for ERP features only when discriminating between sharp and soft braking (figure 8(c)). In this case, however, the decoding performance based on the fusion modality is lower than for brakepedal or EMG after 600 ms post-stimulus. Without EEG features (i.e., feature combination and single ERP), the decoding performance exceeds AUC scores of 0.6 30 ms later compared to when including EEG features (figure 8(a)). In addition, the decoding performance without EEG or EMG dropped between 300 ms and 800 ms in figure 8(a). On the other hand, a drop of performance between 200 and 700 ms is observed in case EEG or EMG features are excluded in figure 8(b).
In addition, the decoding performance of each individual feature set was investigated to assess how much the different feature spaces contribute to the final classification outcome, and how much these contributions change depending on the recognition tasks. The results of this analysis are presented in graphs in the right column of figure 8. The detailed descriptions for these results are provided in section 5 of the supplementary material.
These results confirm that our novel feature combination is more informative for the detection of drivers' braking intentions than ERP features alone.
4. Discussion and conclusion
As a result of analyzing the spatio-temporal ERP pattern of diverse driving situations, we observed a positive signal similar to the typical P300 component in a broad parieto-occipital region for various kinds of visual stimulus types. The neurophysiological properties of the ERPs observed here were similar to those obtained in the classical oddball paradigm [27], because our stimuli were presented randomly during normal driving. The intensity of the positivity in the parieto-occipital region was different in response to the two kinds of braking; this difference helped us distinguish these two different classes.
In the case of sharp braking, we hypothesized based on previous research that each stimulus would evoke the same ERP pattern. For instance, we expected to observe a positive ERP pattern similar to a typical P300 [8] in response to a strong visual stimulus such as the flashing of brake lights and a rapidly decreasing distance to the braking vehicle in front. Therefore, we assigned each stimulus in the sharp braking condition to the same class. Although different ERP patterns were observed across the scalp, each of the visual stimuli evoked a positive potential in the parieto-occipital region [28]. As a result, we were able to distinguish the braking intention of the sharp braking class from the other two classes independently of the type of stimulus that triggered the sharp braking situation.
The central negativity related to the planning processes in the motor system (especially at the Cz electrode) before and during the act of switching the right foot from gas to the brake pedal (i.e., the RP) [29, 30] was consistently observed in all braking situations. We measured activity in the foot area of the motor cortex during and prior to muscle movement, and observed a difference in deflection between reactive and spontaneous movements [31, 32]. Moreover, we observed a difference in the start point of the negative deflection in the central region between reactive (similar to cue-based motor execution and corresponding to our sharp braking) and spontaneous movement (similar to self-paced motor execution and corresponding to our soft braking). The start point of the pre-motion negative deflection in the central motor area related to reactive movement was later than the start point of the spontaneous movement, in line with [9]. Thus, as aforementioned, we used the RP as a feature because it provided important movement-related information.
The ERD starts prior to the movement, about 150 ms before EMG onset [33, 34]. The ERD was observed prior to the depression of the brake pedal (i.e., right foot movement from the gas to the brake pedal). Interestingly, the self-initiated movement (i.e., soft braking) and the movement triggered by an external stimulus (i.e., sharp braking) differed in aspects (i.e., magnitude and slope) of the band power. Thus, the ERD information related to foot movement for braking was also used as a feature.
Generally, normal driving situations in real world settings frequently require sensorimotor processing, e.g., of unexpected visual stimuli, or motor execution/preparation. Thus, we reasoned that braking intention overlapped with other cerebral processes. Our simulated driving conditions were similar to several kinds of critical as well as normal driving situations that drivers would experience in real world settings. Ultimately, to accurately detect drivers' braking intentions, the neurophysiological responses in even more diverse driving situations should be examined.
We assessed the prediction performance in the sharp brake and no braking conditions. We found that the AUC score of the EEG increased faster than the AUC score of the EMG. This result is similar to a previous study [8]. However, the peak AUC score of the EMG was lower than that observed in a previous study [8]. Importantly, the prediction performance based on our novel feature combination was higher than the prediction performance based on ERP features. Although the performance in distinguishing sharp braking from soft braking using our novel feature combination was not better than the performance using EMG features, it shows that prediction performance can generally be improved using additional informative features.
Our prediction system using only the EEG-based feature combination could robustly classify the braking intention in all of the simulated traffic situations. Some important environmental stimuli (e.g., vehicle vibration, auditory stimuli) were omitted in our setting. Thus, it is necessary to replicate our findings under even more realistic circumstances. Moreover, the classification performance for sharp braking and soft braking based on EEG features was lower than the performance based on the EMG even though the prediction performance based on the novel feature combination was better than the prediction performance based on ERP features alone reported in a previous study [8]. In order to overcome these limitations, the usage of additional kinds of neurophysiological signals is conceivable.
The present study demonstrates the possibility of better predicting emergencies by detecting braking intention in several types of driving conditions. Our study is complemented by the work of [35], which shows that results identical or better to those of [8] can be obtained in a real-world setting, in which participants drive a real car. Together, Haufe et al 2014 and our study provide converging evidence suggesting that an automatic braking assistance system integrating neurophysiological responses could be adopted in practice.
Acknowledgments
This research was supported by the National Research Foundation of Korea (NRF) grant funded by the Korea government (No. 2012-005741).