


Abstract
Bulk chemicals production from biomass may compete with biofuels for low-cost and sustainable biomass sources. Understanding how alternative uses of biomass compare in terms of financial and environmental parameters is therefore necessary to help ensure that efficient uses of resources are encouraged by policy and undertaken by industry. In this paper, we compare the environmental and financial performance of using ethanol as a feedstock for bioethylene production or as a transport fuel in the US life cycle-based models are developed to isolate the relative impacts of these two ethanol uses and generate results that are applicable irrespective of ethanol production pathway. Ethanol use as a feedstock for bioethylene production or as a transport fuel leads to comparable greenhouse gas (GHG) emissions and fossil energy consumption reductions relative to their counterparts produced from fossil sources. By displacing gasoline use in vehicles, use of ethanol as a transport fuel is six times more effective in reducing petroleum energy use on a life cycle basis. In contrast, bioethylene predominately avoids consumption of natural gas. Considering 2013 US ethanol and ethylene market prices, our analysis shows that bioethylene is financially viable only if significant price premiums are realized over conventional ethylene, from 35% to 65% depending on the scale of bioethylene production considered (80 000 t yr−1 to 240 000 t yr−1). Ethanol use as a transportation fuel is therefore the preferred pathway considering financial, GHG emissions, and petroleum energy use metrics, although bioethylene production could have strategic value if demand-side limitations of ethanol transport fuel markets are reached.
Export citation and abstract BibTeX RIS

Content from this work may be used under the terms of the Creative Commons Attribution 3.0 licence. Any further distribution of this work must maintain attribution to the author(s) and the title of the work, journal citation and DOI.
1. Introduction
Chemicals derived from biomass are gaining increasing interest as pathways to meet sustainability objectives while expanding upon the supply of high market value products or displacing their production from non-renewable resources (Bozell and Petersen 2010). Studies have investigated low-volume and high-value biomass-derived chemicals as biorefinery co-products, where biofuels such as ethanol remain the primary output (e.g., Cherubini and Jungmeier 2010, Song et al 2014). Bulk biomass chemicals, in contrast, target large existing markets and their production may therefore compete with biofuels for low-cost and sustainable biomass sources. Biomass-derived ethylene ('bioethylene') production processes via ethanol dehydration have been developed by companies including Braskem, Chematur and Petron. Bioethylene can directly substitute for conventional fossil fuel-derived ethylene, the production of which exceeded 140 Mt yr−1 in 2013 (True 2013) for a wide range of uses including plastics (polyethylene, polystyrene) and chemicals. Use of ethanol as bioethylene feedstock, however, competes with its use as a transport fuel. Understanding how alternative uses of ethanol compare in terms of financial and environmental parameters is necessary to promote the efficient use of resources, encouraged by policy and undertaken by industry.
Life cycle assessment (LCA) is commonly employed to evaluate environmental implications of biomass-derived fuels and chemicals, and in particular, greenhouse gas (GHG) emissions and fossil energy use have been the focus of the majority of prior studies. A number of LCA studies have evaluated bioethylene production from ethanol, considering a range of ethanol production routes. Liptow and Tillman (2009) found that bioethylene production from sugarcane ethanol and polymerization to low-density polyethylene reduced GHG emissions relative to the conventional fossil fuel-derived plastic by 30% to 80%, depending on assumed land use change impact. Van Uytvanck et al (2014) evaluated polyethylene terephthalate production, utilizing ethylene glycol derived from sugarcane and willow-based bioethylene, and found GHG emissions to be reduced by up to 28% when displacing fossil fuel-derived ethylene glycol. Most recently, Posen et al (2015) compared US and Brazilian production of bioethylene from corn grain, switchgrass and sugarcane with natural gas-derived ethylene. They found that bioethylene produced from switchgrass and sugarcane can significantly reduce GHG emissions relative to fossil ethylene. However, greater emissions reductions could be realized by using US-produced ethanol as a transport fuel, whereas Brazilian bioethylene production was found to achieve greater GHG reductions than using ethanol as a fuel.
Few studies have included an analysis of the financial performance of bioethylene. Both Van Uytvanck et al (2014) and Posen et al (2015) discussed the potentially high cost of ethanol-derived bioethylene as a barrier to deployment but did not complete a financial analysis of bioethylene production. IRENA (International Renewable Energy Agency) (2013) estimated costs of bioethylene production, but the self-published report did not include key data assumptions or the analysis methodology. Intratec studied the financial performance of a hypothetical 270 000 tonne yr−1 bioethylene production facility (Intratec 2013). Bioethylene was found to be cost-competitive with fossil fuel-derived ethylene under the assumption that bioethylene could attract a 30% price premium due to its renewable nature. To our knowledge, no study has undertaken a rigorous comparison of the environmental and financial performance of bioethylene production from ethanol.
This work evaluates the environmental and financial performance of bioethylene production from ethanol and compares performance with the use of ethanol as a transport fuel. We quantify life cycle environmental (GHG emissions and fossil energy use) and financial performance (minimum bioethylene selling prices) to quantify trade-offs between ethanol uses. A modelling framework is created to isolate the relative impacts of these two ethanol uses and generate results that are applicable for any ethanol production pathway.
2. Material and methods
LCA and financial models are developed to assess the feasibility of bioethylene production from biomass-derived ethanol. Results are compared with the utilization of ethanol as a transport fuel to determine the preferred use of ethanol from financial and environmental perspectives.
2.1. Life cycle assessment
Life cycle inventory analysis spreadsheet-based models are developed to quantify GHG emissions and fossil energy use associated with two alternative uses of ethanol: as a feedstock for bioethylene production; and as a light-duty vehicle fuel (figure 1). The starting point of the models is the ethanol plant exit gate. This truncated system boundary is specifically designed to provide a clear assessment of the relative impacts of different ethanol uses by excluding activities common to both systems. Full life cycle impacts, accounting for all activities from the production of biomass feedstocks and conversion to ethanol through to the ethanol uses considered in this study, are subsequently assessed by appending to this model the 'well-to-gate' modelling results of ethanol production routes to understand the impacts of different biomass sources and ethanol production methods on results. Examining market impacts of producing bioethylene and ethanol (e.g., changes in demand for ethylene, gasoline) is beyond the scope of this study.

Figure 1. Life cycle system boundaries for comparing use of ethanol as a feedstock for bioethylene production and as a transport fuel. Inclusion of upstream ethanol production activities allows assessment of life cycle impacts.
Download figure:
Standard image High-resolution imageBioethylene production from ethanol is modelled on a gate-to-gate basis (from ethanol plant exit gate to bioethylene plant exit gate) and is assumed to displace conventional ethylene production from a mix of natural gas liquids and petroleum feedstock representing average US production (NREL 2014). We do not consider the final manufacture of products from bioethylene (e.g., polymerization to polyethylene), use phase of these products, nor end-of-life treatment (recycling; incineration with/without energy recovery). These downstream activities are assumed to be identical to those of fossil ethylene, given that bioethylene and fossil fuel-derived ethylene are chemically and functionally identical, and therefore have no influence on the relative impacts of bioethylene and fossil fuel-derived ethylene. When used as a transport fuel, ethanol is assumed to be blended with gasoline and combusted in a flexible fuel light-duty vehicle, displacing US gasoline from the 2015 projected crude oil mix on an energy-equivalent basis (ANL (Argonne National Laboratory) 2014). Consistent with typical practice, we assume that ethanol displaces gasoline on an energy-equivalent basis (ANL (Argonne National Laboratory) 2014) and do not consider a specific ethanol fuel blend. Cradle-to-gate modules for energy and material inputs into the life cycle stages are obtained from existing databases, including NREL (2014) (ethylene production) and ANL (Argonne National Laboratory) (2014) (ethanol transport/distribution/use; bioethylene process material inputs; gasoline reference pathway) and are included within the system boundaries (e.g., recovery and processing of petroleum; production of process chemicals; generation of electricity).
GHG emissions (CO2, CH4, N2O) are quantified for each life cycle stage and reported as CO2equivalent (CO2eq) emissions based on 100-year global warming potentials (IPCC (Intergovernmental Panel on Climate Change) 2013). We do not directly account for CO2 uptake by growing biomass and instead credit the bioethylene and ethanol products at plant gate or point of use. Bioethylene is considered to sequester biogenic carbon, which is accounted for as a CO2 sink (negative emission). CO2 emissions arising from ethanol combustion are assumed to not impact atmospheric GHGs. Fossil energy use (petroleum, natural gas, coal) is also quantified. The functional unit is 1 kg ethanol produced and used as a feedstock in bioethylene production or as a transport fuel in a light-duty vehicle.
2.2. Bioethylene production
The bioethylene production process is modelled in a published consulting report (Intratec 2013), based on publicly-available process and financial data. To the best of our knowledge, this is the only detailed cost estimate of bioethylene production that is publicly available. The process includes three main sections: (1) three stage reaction of ethanol to ethylene; (2) quench, compression, washing and drying; and (3) purification (figure 1). Bioethylene produced by this process is polymer grade (99.9%wt purity) and is chemically identical to conventional fossil fuel-derived ethylene. Employing technology described by Intratec yields 1.0 tonne of bioethylene per 1.85 tonnes of ethanol. The electricity requirement of the process is assumed to be provided by the US average grid mix (ANL (Argonne National Laboratory) 2014) while thermal energy demands (fuel, steam) are assumed to be provided by natural gas, including a steam generation efficiency of 85%.
2.3. Financial analysis
The capital and operating costs associated with bioethylene production are estimated for a bioethylene production facility that is integrated with an ethanol production facility. We do not assess costs of ethanol production; instead, we use relevant market prices (AgMRC (Agricultural Marketing Resource Center) 2015) to allocate a cost to the ethanol inputs used for bioethylene manufacture. The financial viability of bioethylene production is assessed by determining the bioethylene minimum selling price (MSP), which is compared with historic market prices for both ethanol and ethylene. To account for the impacts of scale, we consider bioethylene production capacities based upon integration with 'medium' and 'large' ethanol production facilities of 150 000 tethanol yr−1 and 450 000 tethanol yr−1, corresponding to 50 and 150 million US gallons (USG) per year (NEO 2015). The large bioethylene production scales considered in this study correspond to the large potential market for this product, with ethylene demand exceeding 140 Mt yr−1 in 2013 (True 2013).
2.3.1. Capital and operating expenses
The installed cost of a bioethylene production facility is calculated considering data in Intratec (2013) for a facility with a production capacity of 270 000 t bioethylene/yr. We use an exponential relationship (equation (1)) to estimate the equipment costs for bioethylene capacities of 80 000 t yr−1 and 240 000 t yr−1, corresponding to the 150 000t yr−1 and 450 000 t yr−1 ethanol production facilities mentioned previously. It is assumed that the plant salvage value is zero, and the economic life of the plant is 15 years.

where C1 and C2 are equipment costs at capacities of A1 and A2, respectively.
According to Intratec (2013), the cost associated with ethylene storage contributes 70% of the total installed cost in an independent ethanol-to-bioethylene plant. Integration with a downstream ethylene consumer (e.g., polyethylene plant) reduces storage capital costs by 90%, and the cost of storage is thus 20% of the total equipment cost. While downstream processing of bioethylene is not considered in the present study, we include a lower capital cost scenario that accounts for potential cost savings due to integration with polyethylene production. Two bioethylene production scenarios are thus considered in the financial analysis: an 'independent' bioethylene production scenario (with full cost of bioethylene storage); and an 'integrated' bioethylene production scenario (with reduced bioethylene storage costs).
The annual operating cost of the bioethylene process is calculated as the sum of operating costs (labour, utility and chemical costs, and ethanol cost), plant insurance and maintenance cost. The maintenance and insurance costs are considered to be 2 and 1% of capital investment, respectively. Labour, utility and chemical costs are taken from Intratec (2013). Ethanol prices from 250 to 1000 USD/t are examined, taking into account recent market prices (AgMRC (Agricultural Marketing Resource Center) 2015). Existing policies, such as the US Renewable Fuel Standard (US EPA 2015), are assumed to not influence ethanol market prices and thus to not impact our assessment of bioethylene production costs. In particular, we note recent corn ethanol production has exceeded quantities mandated by the Renewable Fuel Standard and US-produced ethanol is currently exported to markets that lack similar ethanol mandates (RFA 2015) as indicators that ethanol markets are not significantly distorted by this policy. This issue is discussed further in section 3.2.
2.3.2. Minimum bioethylene selling price
After calculation of capital investment and operating costs, a discounted cash flow analysis is employed to determine the bioethylene production cost assuming a 15% internal rate of return pre-tax, in line with previously published biorefinery analyses (e.g., Humbird et al 2011). The bioethylene production cost is then calculated as the bioethylene MSP at the plant gate to achieve a net present value of zero. We compare bioethylene MSPs with recent US market prices for ethylene (Lippe 2014) to assess the financial viability of manufacturing this product from ethanol.
3. Results and discussion
3.1. Life cycle GHG emissions and fossil energy use
Figure 2 illustrates GHG emissions and fossil energy consumption for ethanol use as a bioethylene feedstock and as a transport fuel, exclusive of activities associated with ethanol production. Ethanol use as a fuel and as a feedstock for bioethylene production leads to comparable GHG emissions reductions relative to their counterparts produced from fossil sources. The production of bioethylene from ethanol results in the emission of 0.7 kgCO2eq. kg−1bioethylene, primarily due to consumption of natural gas (88% of emissions), while electricity and caustic soda inputs represent smaller shares of production emissions (8% and 4%, respectively). Bioethylene sequesters biogenic carbon, equivalent to 3.1 kg CO2eq. kg−1bioethylene, and displaces conventional ethylene production, which is associated with GHG emissions of 1.8 kg CO2eq./kg ethylene. These factors result in net GHG emissions for bioethylene of −4.3 kg CO2eq. kg−1bioethylene or −2.3 kg CO2eq. kg−1ethanol input to bioethylene manufacture. Bioethylene production represents only a small fraction of GHG emissions associated with bioethylene—sequestered CO2 and avoided fossil ethylene emissions are far more significant—and therefore, these results are robust when considering uncertainty in bioethylene production parameters. Inclusion of activities downstream of bioethylene production (further processing, product use, end of life) would not impact the relative performance compared to fossil fuel-derived ethylene, assuming that these activities would be identical for both bioethylene and fossil ethylene. Use of ethanol as a transport fuel is found to result in similar GHG emissions per unit of ethanol input (−2.5 kgCO2eq. kg−1ethanol) when displacing gasoline on an energy-equivalent basis. Under the assumptions of this study, the relative performance of using ethanol as a bioethylene feedstock or a transport fuel is independent of the ethanol source: for all ethanol production routes, use as a transport fuel or for bioethylene production will achieve similar GHG emissions reductions. These results do not consider possible impacts on ethylene and transport fuel markets arising from bioethylene and ethanol production, respectively. If introduction of biomass-based alternatives drives increasing consumption (e.g., Hochman et al 2010), the performance of ethanol and bioethylene in avoiding GHG emissions may be affected.

Figure 2. Greenhouse gas emissions (a) and fossil energy consumption (b) of ethanol use as a bioethylene feedstock and as a transport fuel. These results compare alternative uses of ethanol and exclude ethanol production impacts.
Download figure:
Standard image High-resolution imageTo estimate full life cycle GHG emissions of bioethylene, we append previously published well-to-gate estimates of GHG emissions associated with ethanol production from the GREET 2014 model (ANL (Argonne National Laboratory) 2014). Ethanol derived from corn grain and corn stover are associated with GHG emissions of 1.2 kg CO2eq. kg−1 and 0.4 kg CO2eq. kg−1 , respectively, when employing default assumptions (process inputs; land use change impacts) and system expansion allocation to account for biorefinery co-products (ANL (Argonne National Laboratory) 2014). Inclusion of ethanol well-to-gate activities results in bioethylene life cycle GHG emissions of −0.3 kg CO2eq. kg−1 and −1.8 kg CO2eq. kg−1 for corn grain and corn stover ethanol, respectively. Relative to fossil fuel-derived ethylene (1.8 kg CO2eq. kg−1), bioethylene production from both ethanol sources is able to significantly reduce life cycle GHG emissions, by 114% (corn grain) and 200% (corn stover). On the basis of one kg ethanol input to bioethylene production, GHG emissions for the corn grain and corn stover pathways are 1.2 kg CO2eq. kg−1ethanol and 2.0 kg CO2eq. kg−1ethanol. As indicated above, using ethanol as a transport fuel would achieve similar GHG emissions reductions. On a full life cycle (well-to-wheel) basis, displacing gasoline with ethanol derived from corn grain and corn stover would reduce GHG emissions by 28% and 80%, respectively, equivalent to absolute GHG emissions reductions of 1.2 kg CO2eq. kg−1ethanol and 2.1 kg CO2eq. kg−1ethanol, respectively. Uncertainty regarding GHG impacts of ethanol production routes (e.g., Mullins et al 2010) would impact the absolute results presented here, but would not impact the primary outcome of this analysis: that the use of ethanol as a transport fuel or bioethylene feedstock results in similar GHG emissions.
Figure 2(b) shows fossil energy use associated with the bioethylene and transport fuel scenarios for activities downstream from the ethanol plant exit gate. Results are presented as net fossil energy consumption, which measures energy used by each pathway (direct energy consumption and energy used to produce inputs), less energy consumption avoided by displacing the production of fossil fuel-derived ethylene or production and use of gasoline. Use of ethanol as either a bioethylene feedstock or as a transport fuel significantly reduces fossil energy consumption (indicated in figure 2(b) by a negative net fossil energy value). However, the composition of avoided fossil energy varies between the two uses of ethanol. Bioethylene primarily reduces natural gas consumption (28 MJ/kgethanol), due to the heavy reliance on natural gas liquids feedstock in steam crackers in the US petrochemical industry: natural gas represents over 86% of the life cycle energy inputs to conventional ethylene production. Ethanol use as a transport fuel reduces fossil energy use to a slightly lesser degree, but, by displacing gasoline use in vehicles, this pathway is able to significantly reduce petroleum consumption (26 MJ kg−1ethanol), which is a key energy security concern. The capacity of natural gas and natural gas liquids-fed steam crackers continues to expand in the U.S. as a response to low cost feedstock available from shale gas production (Platts 2015). As such, bioethylene production for US markets cannot significantly reduce petroleum energy use. In contrast, ethylene production in the EU is more heavily reliant on petroleum-based feedstock (e.g., naphtha) (PlasticsEurope 2012); bioethylene production/use in the EU could therefore achieve greater reductions in petroleum energy consumption than in the US, although such an analysis is outside of the scope of the present study.
3.2. Financial analysis
Capital costs are assessed for both 'independent' and 'integrated' bioethylene production scenarios for output capacities of 80 000 tbioethylene yr−1 and 240 000 tbioethylene yr−1. Capital costs of the independent bioethylene scenario are 240 million USD and 460 million USD for the two capacities, equivalent to production capacity costs of 3000 USD/tbioethylene yr−1 and 1900 USD/tbioethylene yr−1 for the lower and higher capacities, respectively. Integration of the bioethylene plant with a downstream user (e.g., polyethylene production) can substantially reduce capital costs for the two output capacities, to 73 million USD and 140 million USD. Bioethylene production on larger scale than those considered here would not be expected to result in lower production costs. Integration with ethanol production facilities would no longer be feasible as ethanol demands would exceed the production capacity of typical, 'large' ethanol biorefineries; as such, larger bioethylene plants would incur additional costs associated with independent facilities. We estimate that 'independent' bioethylene facilities would have to reach approximately 1000 000 tbioethylene yr−1 capacity to achieve the same production capacity capital costs (approximately 600 USD/tbioethylene-yr) of an integrated, 240 000 tbioethylene yr−1 facility; this capacity is approximately on par with large fossil ethylene facilities (e.g., Linde 2014).
The MSPs of bioethylene for independent and integrated facilities at 'medium' scale (80 000 t/yr) and 'large' scale (240 000 t/yr) are shown in figure 3. Capital and operating expenses for bioethylene production are associated with some uncertainty as these values are not based on a producing facility. However, this uncertainty has a very small impact on the financial analysis results as the ethanol feedstock cost dominates the bioethylene MSP. Considering an ethanol cost of $800/t, ethanol feedstock costs represent 68% and 75% of bioethylene production costs for 'medium' and 'large' independent production facilities, and 82% to 86% of production costs for integrated facilities. Similarly, variation in financial analysis parameters (discount rate, facility lifetime) would have a small impact on results. Costs associated with chemicals and energy inputs to the process are the second highest contributor to ethylene production cost in the integrated bioethylene plant, whereas capital-related costs are the second highest cost in the independent plant.
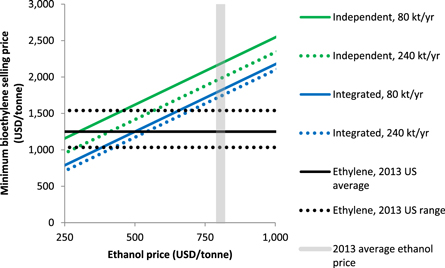
Figure 3. Minimum selling price (MSP) of bioethylene for integrated and independent bioethylene plant scenarios under a range of ethanol feedstock prices for 'medium' scale bioethylene plant (80 000 t yr−1) and 'large' scale bioethylene plant (240 000 t yr−1).
Download figure:
Standard image High-resolution image
To be cost-competitive with the 2013 average US ethylene market price, an independent bioethylene plant would require ethanol costs at or below 300 USD/t or 410 USD/t (80 000 t and 240 000 t capacity, respectively), while an integrated plant would require ethanol costs at or below 500 USD/t or 540 USD/t (80 000 t and 240 000 t capacity, respectively). These ethanol prices are significantly below the 2013 average US ethanol price (805 USD/t or 2.35 USD/USG) (AgMRC (Agricultural Marketing Resource Center) 2015), indicating that it would be more profitable to sell ethanol for use as a transport fuel than to process it further to bioethylene. Based on the US average ethanol price, bioethylene production would have to achieve a price premium over fossil fuel-derived ethylene ranging from 37% (integrated, 240 000 t capacity bioethylene plant) to 65% (independent, 80 000 t capacity plant) based on 2013 average market prices. Recent ethanol and ethylene price data (December 2014) reveal significant price declines for both commodities; however, the estimated MSP of bioethylene , based on December 2014 ethanol prices, ranges from 1 150 to 1 500 USD/t, and would still significantly exceed the market price for ethylene during that period (850 USD/t) (Argus 2015, AgMRC (Agricultural Marketing Resource Center) 2015).
The potential exists for biofuel-related policies to influence market prices for ethanol and thus impact the cost of producing bioethylene. As discussed in section 2.3.1, this analysis assumes that existing policies, such as the Renewable Fuel Standard (US EPA 2015), do not significantly impact ethanol prices. To test the importance of this assumption, we consider a conservative case where the price of ethanol is set based on gasoline market prices (adjusted for energy content), while noting that this approach ignores the value of ethanol as an oxygenate in blended fuels and its role in fuel economy improvements and reduction of certain air pollutant emissions (e.g., Al-Hasan 2003). Even at a discounted ethanol price of 650 USD/t based on the 2013 average gasoline price (US EIA 2015), bioethylene remains uncompetitive with conventional ethylene and would require a price premium of 20% (integrated, 240 000 t capacity plant) to more than 50% (independent, 80 000 t capacity plant).
4. Conclusion
Ethanol-derived bioethylene is capable of significantly reducing GHG emissions and fossil energy use relative to conventional fossil fuel-derived ethylene. However, results of this study show that the further processing of ethanol to bioethylene is not financially favorable compared to ethylene produced from natural gas feedstocks, or to the use of ethanol as a transport fuel. By comparison, ethanol used in place of gasoline can achieve similar GHG emissions reductions and is far more effective in reducing petroleum energy consumption, an energy security concern. At 2013 market prices for ethanol, bioethylene is not cost-competitive with conventional ethylene. With ethanol priced at $2.35/USG (805 USD/t), the bioethylene price would range between $1 700 and $2 300 USD/t, depending upon the plant scale and choice of integrated versus independent operation. This is well above the 2013 average ethylene price of 1250 USD/t. Conversely, at this bioethylene price, ethanol would need to be available at a price of 300–540 USD/t, well below recent and current market prices. Ethanol use as a transportation fuel is therefore the preferred pathway considering financial, GHG, and petroleum energy use metrics, although bioethylene production could have strategic value if demand-side limitations of ethanol transport fuel markets are reached.
Acknowledgments
We thank the Government of Canada through AUTO21 Network Centre of Excellence, Genome Canada (2009-OGI-ABC-1405), the Natural Sciences and Engineering Research Council, as well as the Government of Ontario (ORF-GL2-01-004) and BioFuelNet Network of Centres of Excellence for financial support.