
Abstract
We propose a novel indicator measuring one dimension of the sustainability of an entity in modern societies: Nitrogen-neutrality. N-neutrality strives to offset Nr releases an entity exerts on the environment from the release of reactive nitrogen (Nr) to the environment by reducing it and by offsetting the Nr releases elsewhere. N-neutrality also aims to increase awareness about the consequences of unintentional releases of nitrogen to the environment. N-neutrality is composed of two quantified elements: Nr released by an entity (e.g. on the basis of the N footprint) and Nr reduction from management and offset projects (N offset). It includes management strategies to reduce nitrogen losses before they occur (e.g., through energy conservation). Each of those elements faces specific challenges with regard to data availability and conceptual development. Impacts of Nr releases to the environment are manifold, and the impact profile of one unit of Nr release depends strongly on the compound released and the local susceptibility to Nr. As such, N-neutrality is more difficult to conceptualize and calculate than C-neutrality. We developed a workable conceptual framework for N-neutrality which was adapted for the 6th International Nitrogen Conference (N2013, Kampala, November 2013). Total N footprint of the surveyed meals at N2013 was 66 kg N. A total of US$ 3050 was collected from the participants and used to offset the conference's N footprint by supporting the UN Millennium Village cluster Ruhiira in South-Western Uganda. The concept needs further development in particular to better incorporate the spatio-temporal variability of impacts and to standardize the methods to quantify the required N offset to neutralize the Nr releases impact. Criteria for compensation projects need to be sharply defined to allow the development of a market for N offset certificates.
Export citation and abstract BibTeX RIS

Content from this work may be used under the terms of the Creative Commons Attribution 3.0 licence. Any further distribution of this work must maintain attribution to the author(s) and the title of the work, journal citation and DOI.
Introduction
The challenges of reactive nitrogen
Nitrogen (N) supply is a necessary element for crop and livestock growth, and protein intake is essential for a balanced human diet (Smil 2002, WHO 2007). Historically, strategies have been developed to guarantee N supply to crops, including rotation systems with legume crops that can fix atmospheric nitrogen, transfers of reactive N (Nr) from pastures to crops via manure, or inputs of Nr from external sources (Billen et al 2008). In particular since the invention of Haber–Bosch ammonia synthesis in the early twentieth century, mineral fertilizer was rapidly adopted and Nr supply ceased to be a limiting factor in most industrialized countries (Erisman et al 2008, Galloway et al 2013). While progress has been made in some countries to improve nitrogen use efficiency (NUE) in agriculture, unintended losses of N to the environment continue to remain a problem in many regions, and farmer adoption of known best management practices to improve NUE is incomplete due to a complex combination of socio-economic, technical, and policy factors. External costs associated with inefficient nitrogen use include impacts on ecosystem services such as the functioning of soils and biodiverse landscapes, clean air and water, and a stable climate. Relatively cheap nitrogen for farmers in developed countries translates to cheap protein sources for consumers (O'Kane 2012). However, these cheap protein sources are often in the form of livestock products, which have a lower NUE than other food products, leading to increased nitrogen losses to the environment. Currently, new N fixation for agriculture is about three (EU27, Leip et al 2011) to four (Global Carbon Project 2008, Fowler et al 2013) times the amount of N fixation through combustion sources.
However, the nature of Nr in the environment makes it cascade over multiple stages of transformation and associated impacts until final denitrification to harmless atmospheric dinitrogen (N2) (Galloway et al 2003). These impacts encompass acidification of soils, air pollution through particulate matter formation, pollution of drinking water, eutrophication of fresh and coastal water resources, and contribution to radiative forcing (Sutton et al 2011b, 2011c, Erisman et al 2013).
Despite the abundance of reactive N produced through the Haber–Bosch process, scarcity of reactive N is still an issue in many parts of the world; this is amongst the causes of continuing prevailing food insecurity (Sanchez et al 2007, Bekunda et al 2007, Sánchez 2010, FAO WFP and IFAD 2012). The Food and Agriculture Organization of the UN, with two other international agencies, has recently launched the zero hunger challenge, which is an effort that aims to eradicate chronic hunger and malnutrition by implementing efficient but sustainable food production systems and reducing food losses and waste by 50% (www.un.org/en/zerohunger/).
Many smallholder farmers–particularly in developing countries–have limited access to sufficient nitrogen supply to replenish the nutrient quality, only relying on supply from soil organic matter that continuously faces depletion (Musinguzi et al 2014). This development is parallel to increasing urbanization, which separates food production and food consumption by sometimes large distances and disrupts previously closed nutrient cycles (Ebanyat et al 2010). Another cause of the nutrient gap observed on many farms is high N losses to the environment–despite insufficient N supply–caused by increasing soil erosion losses and inefficient use of available N sources. The former is a consequence of population pressures causing high deforestation rates, leaving the soil unprotected; the latter is rooted in lack of application of integrated soil fertility management (Musinguzi et al 2013, Vanlauwe et al 2010).
Individual and institutional responsibility of environmental Nr releases
Measures to decouple the availability of food and energy from environmental threats linked to Nr releases (Sutton et al 2011a, 2013) include improved full-chain nitrogen use efficiency (NUE). Potential intervention points occur at all stages of the supply chain from crop and animal production over food supply to the consumer. Also, efficiency can be improved by reducing and/or re-using biomass streams in form of manure, food wastes, and sewage. Societal consumption patterns of both energy and food play a crucial role in this portfolio (Bellarby et al 2013, Westhoek et al 2014). Suggestions focus on reduction of animal protein consumption and substitution of protein sources (Tuomisto and de Mattos 2011, Stokstad 2010, Dagevos and Voordouw 2013, Garnett 2009, Tukker et al 2011, Kastner et al 2012, International Nitrogen Initiative 2009, Vogel 2010). At the same time, tools are being developed to communicate to consumers the connection between high N use in agriculture and the consumption (or wastage) of large quantities of protein-rich products.
The situation can be compared to the link between emissions of greenhouse gases and voluntary carbon (C) offsetting programmes, which serve to encourage private companies and individuals to offset the greenhouse gas emissions they cause by purchasing emission reductions achieved by climate mitigation projects elsewhere (Lovell 2010, Global Carbon Project 2008). In order to make sure that C offsetting leads to a real benefit for climate change mitigation efforts (compared to no offsetting), strict rules and standards have been developed (Global Carbon Project 2008): additionality, leakage avoidance, permanence, verification, and efficiency (see definitions here: www.globalcarbonproject.org/carbonneutral/StringentStandards.HTM). Furthermore, and most importantly, C-neutrality requests that C offsetting can be done only after all options for avoiding emissions (i.e., abstaining from emitting activities or consumption) and reducing emissions (e.g. switching to cleaner energy sources) have been exhausted. Still, there is an ongoing debate on the ethics of carbon offsetting, claiming e.g., that it is unlikely that purchasers strictly follow this sequence (Hyams and Fawcett 2013).
N footprints
No comparable instruments to C-neutrality exist so far to enable individuals and other entities to compensate their unavoidable Nr releases to all compartments of the environment. However, the concept of the N footprint has recently been proposed as a communication tool (Leach et al 2012, 2013, Galloway et al 2014)7 . The N footprint is defined as the total amount of Nr released to the environment as a result of an entity's consumption patterns. Estimates of N footprints for a number of countries are now available or being developed (China: Gu et al 2013, US and Netherlands: Leach et al 2012, UK: Stevens et al 2014, Portugal: Gonçalves 2013, Cordovil et al n.d., Germany: Umweltbundesamt 2012, Japan: Shibata et al this issue, Austria: Pierer et al 2014, Tanzania: Hutton et al this issue). Detailed partial food production N footprint coefficients for the food sector are available for all countries of the European Union (Leip et al 2014).
Objective of the paper
Here we develop the concept of N-neutrality that combines (1) the quantification of the release of Nr to the environment associated with a period of time or at a specific event on the basis of the Nr releases (i.e., here N footprint) and (2) the offset of the N footprint (i.e., N offset). We describe how N-neutrality has been adapted to a major event, the 6th International Nitrogen Conference (N2013) in Kampala, Uganda8 .
The N-neutrality concept
N-neutrality definition
Based on the C-neutrality concept, we define N-neutrality as a two-step approach focusing on (1) the measures that avoid and/or reduce the release of Nr, before (2) purchasing N offsets that compensate the residual Nr releases (see figure 1). The goal of N-neutrality is for an entity to achieve zero net Nr release to the environment. N is particularly complex as it is both an essential input to guarantee agricultural production yet it contributes to a cascade of negative effects through avoidable (and unavoidable) losses to the environment. Different metrics can be used to quantify Nr releases to the environment, depending on the choices made with regard to flows that are considered (N flows after consumption, Nr emission from land use change, N2 emissions from soils etc). A discussion of other metrics that could be used to quantify the Nr releases is given in the Discussion section and in the Supplementary Information, available at stacks.iop.org/ERL/9/115001/mmedia. Here, we choose to use the N footprint as defined below.

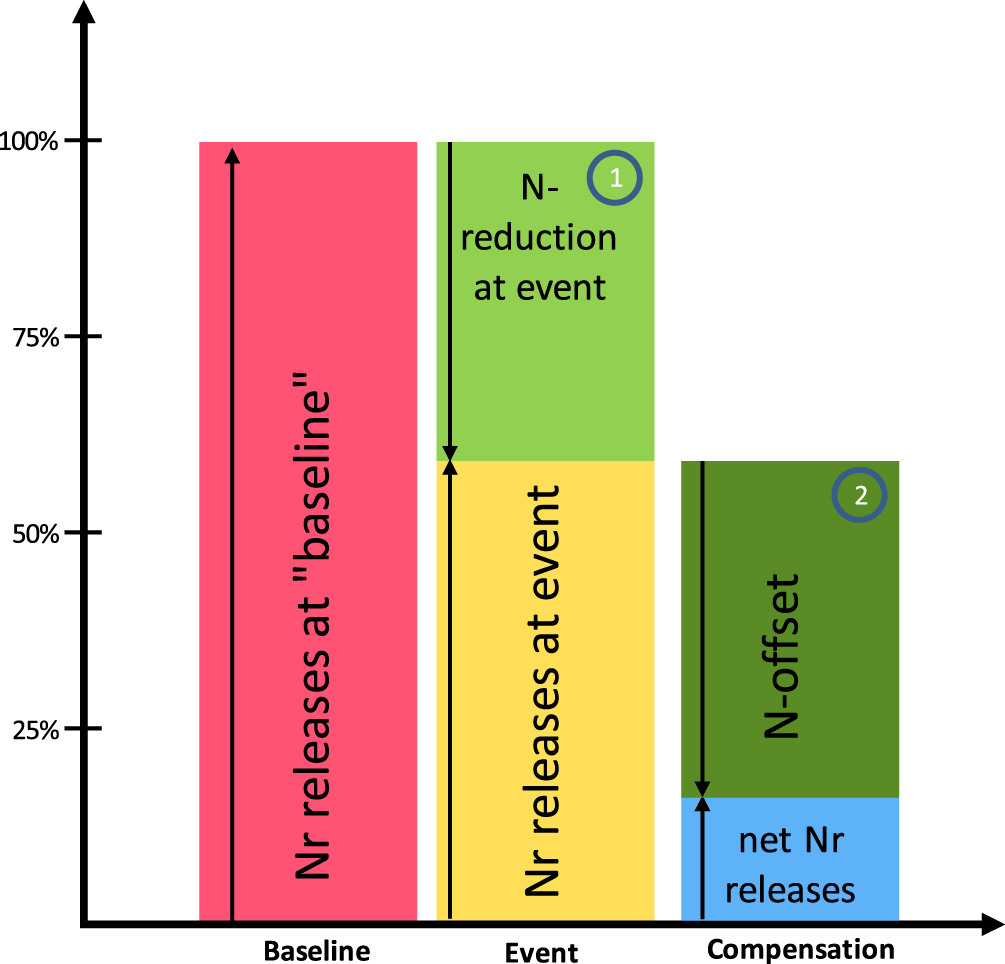
Figure 1. Schematic representation of the N-neutrality concept. First, the baseline of Nr releases is calculated to determine what the Nr releases would be if no measures were taken. Second, measures to reduce Nr releases from the event 'baseline' are implemented (point 1 in the N-neutrality definition). Finally, the residual Nr releases are compensated with N offsets according to the definition of N-neutrality (point 2 in the N-neutrality definition). N-neutrality is achieved if there are no remaining net Nr releases of the event. We show the concept here for an 'event' such as the N2013 conference (achieving 41% reduction in step 1 and a calculated offset of 73% in step 2, see later sections), but it could be any entity (e.g., individual, organization, country).
Download figure:
Standard image High-resolution imageThe negative impact related to N in agriculture is not only linked to the wasteful use of N and associated Nr releases, but also to unsustainable land management. A compensation of Nr releases can thus encompass a reduction of N losses elsewhere, an increase of Nr sinks (e.g., through restoring water resources in riparian zones), and an increase of sustainable land management where this is not yet achieved (see box 1).
Box 1. Definition of N-neutrality and sustainable land management.
| Definition of N-neutrality |
|---|
| To achieve N-neutrality, |
| (1) first decrease the release of reactive nitrogen (Nr) into the environment by |
| (a) reducing over-consumption of food and reducing food wastes |
| and minimizing energy consumption, and |
| (b) choosing sustainable sources of energy and food, |
| (2) then, contribute to a measured compensation of the remaining Nr releases by a measured |
| (a) reduction of Nr releases elsewhere to balance the remaining releases, |
| (b) increased sustainability in the production of food where sustainable land management is not yet achieved. |
| Definition of sustainable land management |
| (3) With respect to N-neutrality, sustainable land management is a farming system which |
| (a) minimizes the ecological footprint of the farming products (incl. the C footprint, N footprint, water-footprint), |
| (b) keeps the farmed land in good environmental conditions, |
| (c) satisfies human food needs and enables the farm worker(s) and their families to a decent living standard. |
We define sustainable land management for the purpose of N-neutrality accordingly with the three dimensions of (i) the ecological footprint; (ii) good agricultural and environmental conditions of the land; and (iii) satisfying human food requirements while meeting the socio-economic needs of the farmers (see box 1).
Quantification of the N footprint
Nr releases were quantified as the N footprint as used in the N-Calculator tool (Leach et al 2012) and the N footprint quantification for food products according to Leip et al (2014). The N footprint for food products as defined in literature (Leach et al 2012, Leip et al 2014) is an integrative indicator for the total Nr releases in the food production chain, accounting for all Nr releases on its way to final disposal and is as such an indicator for resource use (Pelletier and Leip 2014). Leach et al (2012) apply the footprint calculator model to country-wide average personal consumption patterns that include Nr activation from both food consumption and production as well was the burning of fossil fuels for the generation of energy. This covers also energy used for food production, although these Nr losses are comparatively small.
For the purpose of N-neutrality, the calculation algorithm was split into 'modules' enabling flexible and transparent assessment of multiple food products sharing the same losses for a part of the overall food chain, such as beef from different production systems which are treated equally entering the processing/retail steps. Furthermore, we extend the concept of N footprint to include soil mining (see also Hutton et al this issue).
The N footprint of a specific food product or food ingredient f was calculated using total N losses per unit of intake (kg N total loss (kg product)−1) caused in the food supply chain. For each food product, a factor was calculated to describe the Nr releases during the food supply chain (if, see equation (1)). According to equation (2), total N losses for a food product are obtained by subtracting the part of the N that is consumed (intake, here Nout) from the total N inputs; this also subtracts nitrogen flows that are recycled in the food chain because they are not lost to the environment. Examples of recycled N flow include manure applied to fields for the purpose of N fertilization, crop residues incorporated or used for mulching, composted food wastes applied on field or in household gardens. Here it is not of interest if the N is used in the same or another food chain.


with

|
the total N footprint (kg N loss (kg product)−1) of intake of food product f |

|
the N loss factor (kg N releases (kg N intake)−1) specific for the food supply chain of food product f |

|
the intake of N with food product f (kg N) |

|
the total N losses (kg N) in the food supply chain of food product f |

|
the mass of food f that is eaten or otherwise used by end-consumers |

|
the total N input (kg N) required for the production of the food item, independent of its sources (external such as mineral fertilizers, manures, etc and internal sources from mineralized organic nitrogen from soils, ...); 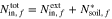
|

|
the N input (kg N) from external sources, including recycled nitrogen and newly fixed nitrogen |

|
the N that is depleting in the soil (soil mining) (kg N). Note that here changes in soil nitrogen are from the perspective of N released from soil organic matter |

|
the total Nr mobilized by use of energy in the food chain (kg N) |

|
the N output (kg N) of the food chain element for food product or ingredient f. By-products with the purpose of direct (end) consumption, such as beef from dairy cattle, are considered as well in  . That implies that at this stage both milk and meat from a dairy cow have the same N loss factor . That implies that at this stage both milk and meat from a dairy cow have the same N loss factor  , following a physical allocation of losses according to recommendations (ISO 2006, see also Weiss and Leip 2012). However, in practice, beef is produced in separate production systems giving different N loss factors. For the purpose of the , following a physical allocation of losses according to recommendations (ISO 2006, see also Weiss and Leip 2012). However, in practice, beef is produced in separate production systems giving different N loss factors. For the purpose of the  calculation, a process producing multiple products can be thought to be split into separate sub-processes proportionally to the total N in each product. The output of the consumption step in the food chain is also termed Nint,f above. calculation, a process producing multiple products can be thought to be split into separate sub-processes proportionally to the total N in each product. The output of the consumption step in the food chain is also termed Nint,f above. |

|
the total N recycled not considering human wastes |

|
the N that is recycled in the current or another food chain. |
A comprehensive explanation of the different components and variables relevant in the food supply chains is given in the supplementary Information (figure S1).
Note that our approach includes the part of the N footprint related to losses of Nr caused by the food chain (food production) before consumption of the food. In accordance to Leach et al (2012) this is thereafter referred to as food production N footprint from food consumption.
The N loss factor  can be split into two terms, i.e., the losses related to the consumption of energy
  , and the losses directly linked to the flow of nitrogen in the food chain
  . The latter is further differentiated into
 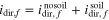 , with
  also called the Soil Mining Factor (Hutton et al this issue) and
  being equivalent to the Virtual N Factor as defined by Leach et al (2012).
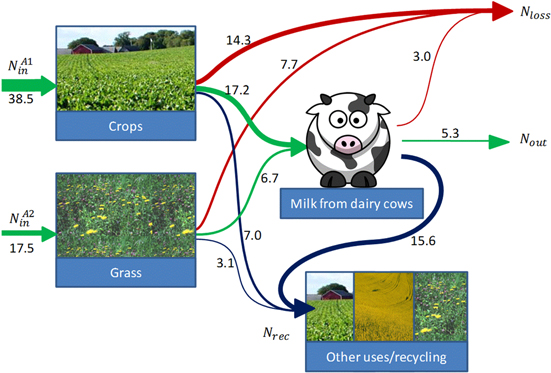
The food supply chain can be split into phases, and multiple intermediate products (e.g. 'A') can be combined and further processed in (e.g. in phase 'B'). 'A simple example of such a two-step calculation combining crop and grass as feed for dairy cattle is shown in figure 2.
Figure 2. N-flows for typical milk production in Europe with about 30% of N consumption from grazing and full return of manure as fertilizer (data from Leip et al 2014), simplified to two feed categories (grass and crops).  ;
;  ;
;  ;
;  .
.
Download figure:
Standard image High-resolution image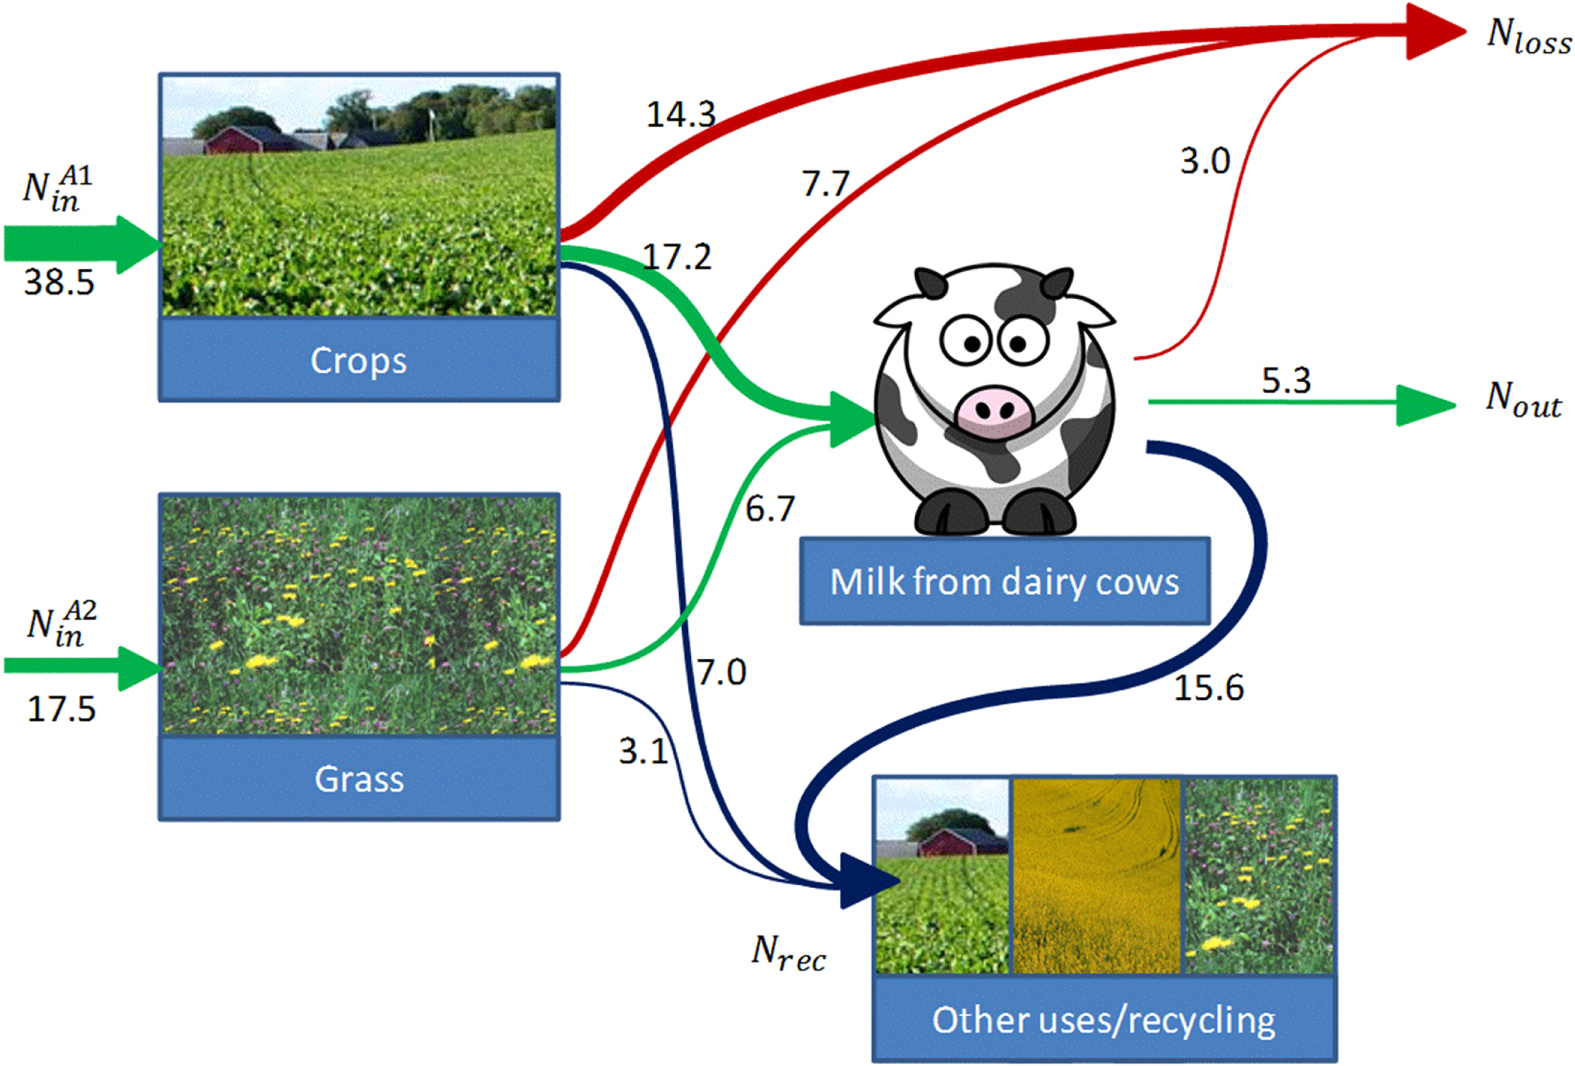
Quantifying the required N offset
Quantifying the N offset required to compensate the Nr releases requires both (1) the quantification of the achievable reduction of the Nr releases as well as (2) the increase in production of sustainable food (see box 1) that can be achieved with the support of a compensation project (see equation (3)).

with
 and
and  the Nr releases before (baseline at time
  ) and after transition (time
  ).
).
Time plays an important role for compensation and the total compensation impact  depends thus on a time discounting factor
  (equation (4)).

assuming that the impact level either falls back to  for all
  in the case of a one-off reduction, or remains at an 'improved' level
  for all
  in the case the effect lasts multiple years, for example if the sustainability of a farm is improved. This constancy is assumed to hold at least for the time period with relevant discounting factor
  .
.
The shape of the discounting factor function as well as the measure for the compensation project impact (reduction) are not yet included in the definition of N-neutrality and need to be established on a case-by-case evaluation of the nature of the Nr releases to be compensated and the N offset project(s) selected.
In case the unit of the impact reduction  is different from the unit of the Nr releases caused (for example if sustainable land management is being targeted which is not measured in the same unit as the N footprint), the quantity of N offset units
  needed is obtained from an equivalence factor
  (equation (5)).

Implementation of N-neutrality
The N-neutrality concept has been applied to a major conference: the 6th International Nitrogen Conference (Kampala, Uganda; November 2013).
The 6th international nitrogen conference (N2013)
The 6th International Nitrogen Conference (N2013) was held on 18–22 November 2013 at Speke Resort and Conference Center in Kampala, Uganda under the theme 'Let us aim for Just Enough N: Perspectives on how to get there for 'too much' and 'too little' regions'. The conference's themes were linked to nitrogen management, including food security, human health, agriculture, and the water cycle (see http://n2013.org/).
N footprint
The N footprint of N2013 was determined based on a survey carried out with the chefs of the kitchens in charge of catering for the conference (i.e., breakfast, morning and afternoon breaks, lunch, workshop dinner) as described in Tumwesigye et al (2014). To quantify the magnitude of Nr releases reduction achieved by the measures implemented at N2013 (reduced meat and more vegetable choices offered in the buffet), Tumwesigye et al carried out a second survey on a 'baseline' conference that took place at the same venue a few weeks prior to N2013 where footprint reduction measures were not implemented. Survey data include both food ingredients (supply, serving, left-overs) as well as the number of guests joining the meal, on the average around 140 persons over the five days the conference lasted. N loss factors were taken from a study on the N footprint in Tanzania (Hutton et al this issue). The N footprint related to energy use was not considered.
N offset
Agriculture in Uganda is dominated (>70%) by farmers with small land holdings (<0.4 ha). Fertilizer use in Sub-Saharan Africa in general is very low (<8 kg ha−1 yr−1) (Africa Fertilizer Summit 2006), with per capita use in Uganda <1.0 kg yr−1. At the same time, Uganda soils suffer from high soil mining rates in cases exceeding 70 kg N ha−1 yr−1 with soil erosion accounting for the highest N loss pathway for several farming systems in Uganda (Mubiru et al 2007, Ebanyat et al 2010, Nkonya et al 2008, Olupot et al 2006). Such Nr losses are among the major contributors to eutrophication of water bodies, especially Lake Victoria (Wang et al 2012, De Meyer et al 2011, Verschuren et al 2002). At the same time, increasing the supply of N for smallholder farmers must be integrated into a holistic approach if yields and farmers' livelihood is to be improved and hunger combatted (Nkonya et al 2004, Sanchez 2009). Such an approach is being implemented under the UN Millennium Villages Project (Nziguheba et al 2010, Sanchez et al 2007) and its village cluster Ruhiira in South-Western Uganda (The Earth Institute 2011, Millennium Villages 2011). The holistic approach of the UN Millennium Villages approach intends to '[...] raise the capital stock above threshold level above which the village can move toward self-sustaining growth'. (Sanchez et al 2007). Multiple dimensions considered are natural capitals, infrastructure, human capital (skills and health), and financial capital (Sanchez et al 2007).
Hence, the UN Millennium Village Ruhiira was selected to be supported to compensate the N footprint of N2013 participants, giving focus to the increase of sustainable food production according to paragraph 2b of the definition of N-neutrality and the definition of sustainable land management (see box 1). The use of the 'donation' was selected according to the current need of the village cluster to work towards the Millennium Development Goals (MDG, www.un.org/millenniumgoals/). Specifically, the support was used for a tree afforestation programme—important for reducing soil erosion and improving water storage capacity and soil fertility (Siriri et al 2012).
We measure the impact as increased crop productivity, expressed in kg N ha−1 yr−1 harvest, thus  is 1 kg N released per kg N of sustainable increased productivity as a consequence of implementation of the holistic UN Millennium Villages concept. The unit of the N offset
  is measured in hectares supported. Harvests in the Ruhiira village cluster increased to 3–3.5 t ha−1 yr−1 from a baseline of 0.8 t ha−1 yr−1 (maize) or from 0.5 t ha−1 yr−1 to 2.2 t ha−1 yr−1 (beans), giving an average impact (improvement) of about 49 kg N ha−1 yr-1. This increased productivity will not be limited to one year but continue thus we apply an (exponential) discounting function such that (arbitrarily) the weight of following years is halved every ten years (integrated multiplicator is 14.4 yr). The total compensation impact
  is thus 702 kg N ha−1. The choice of the relatively long half-life period of ten years is justified by the multiple dimensions of capital targeted by the UN Millennium Villages project going beyond direct effects on soil fertility.
According to Sanchez et al (2007) the funds required to achieve the objectives of the the UN Millennium Villages projects are $110 per inhabitant in a supported village per year, sustained over a period of 5–10 years, thus totaling $1100 per capita. On the basis of household sizes (0.13 ha per household and 5.3 capita per household, Julius Ssempiira, personal communication, November 2013) the cost per supported hectare amounts to 45 000 $US ha−1.
Results
The total food production N footprint of the surveyed meals at N2013 was 66 kg N. This includes all surveyed meals taken in at the venue and organized by the N2013 conference. Survey data include both food ingredients (supply, serving, left-overs) as well as the number of guests joining the meal, on the average around 140 persons over the five days the conference lasted. Details on the surveys is given in Tumwesigye et al (2014). Since the breakfast was not served separately for N2013 participants but for other guests present as well, the N footprint at breakfast was adjusted proportionally. Relative to a 'baseline' conference surveyed in July 2013, the N footprint per capita for the N2013 conference was 41% smaller (see step 1 in figure 1). This reduction was attributed to general lower intake levels, and a reduction of meat served and consumed as a consequence of the N footprint reduction measures implemented and increased awareness at the N2013 conference (Tumwesigye et al 2014).
Contributions to the N footprint were: dinner 35%, lunch 31%, breakfast 17% and morning and evening tea 8–9% each. Meat (beef, pork, chicken, goat and mutton, fish and seafood) and staple food (matooke, rice, sweet and Irish potatoes, cassava, maize, cereals) contributed equally to the N footprint with 37% each, followed by fruit and vegetables (17%), animal products (milk and eggs, 7%). Leguminous crops (ground nuts, beans and peas) contributed less than one percent, but 3% of fresh weight intake and 8% of protein intake. Luxury food (tea, coffee, sugar)—the one food group which consumption was significantly higher when compared to the baseline conference—contributed 2% to the N footprint of the conference. The fresh weight intake for the food categories per person and meal at N2013 and the related N footprint is given in table 1 and table 2.
Table 1. Per capita intake of food at N2013 (g fresh weight per meal).
| Breakfast | Morning tea | Lunch | Evening tea | Dinner | Total | |
|---|---|---|---|---|---|---|
| Luxury food | 10 | 24 | 8 | 14 | 8 | 63 |
| Animal products | 89 | 23 | 0 | 23 | 2 | 140 |
| Leguminous crops | 14 | 6 | 27 | 0 | 30 | 77 |
| Meat | 52 | 5 | 140 | 5 | 140 | 340 |
| Staple food | 81 | 24 | 280 | 29 | 350 | 770 |
| Fruits and vegetables | 150 | 17 | 520 | 7 | 650 | 1300 |
| Total | 400 | 98 | 980 | 77 | 1200 | 2700 |
Total meals considered for N2013 over five days were: breakfast and morning tea: 686; lunch: 677; evening tea: 684; dinner: 728. Items for the food groups see text.
Table 2. Per capita food production N footprint from food consumption at N2013 (g total direct N losses per meal).
| Breakfast | Morning tea | Lunch | Evening tea | Dinner | Total | |
|---|---|---|---|---|---|---|
| Luxury food | 0.5 | 0.7 | 0.0 | 0.3 | 0.0 | 1.5 |
| Animal products | 2.9 | 1.1 | 0.0 | 2.0 | 0.1 | 6.2 |
| Leguminous crops | 0.0 | 0.0 | 0.2 | 0.0 | 0.2 | 0.5 |
| Meat | 5.9 | 0.8 | 16.0 | 0.1 | 13.0 | 35.0 |
| Staple food | 5.3 | 4.7 | 7.5 | 5.7 | 12.0 | 35.0 |
| Fruits and vegetables | 1.8 | 0.2 | 6.1 | 0.1 | 7.7 | 16.0 |
| Total | 16.0 | 7.7 | 29.0 | 8.3 | 33.0 | 94.0 |
Total meals considered for N2013 over five days were: breakfast and morning tea: 686; lunch: 677; evening tea: 684; dinner: 728. Items for the food groups see text. The footprint is calculated using equation (1) and includes all pre-consumption N losses.
On the basis of a preliminary estimate of the N footprint (giving a much higher value of about 150 kg N = 705 g N cap−1 · 200 cap), a compensation fee of US$ 50 was estimated and requested from N2013 participants as voluntary maximum contribution to N-neutrality. With 160 registered participants and a resulting per capita N footprint of 0.41 kg N per registered person (which is lower than the footprint of the for the average N footprint per person present at the meals of 0.47 kg N, due to shorter attendances or 'skipped' meals), the cost per person dropped to US$ 26 per person (note that no energy-related Nr releases were included in the calculation). From the 160 registered delegates, 61 persons donated up to US$ 50, where by the donations were topped-up to US$ 50 by sponsors, giving a total of collected money of US$ 3050 (or about 73% of the total calculated required compensation fee, see step 2 in figure 1) and invested in the compensation project as described above.
Discussion
The choice of N offset projects
The UN Millennium Villages project targets N as a component in a holistic concept to improve sustainable land management in a country at risk of insufficient food security and low N input availability combined with depleting soil resources. This is only one of many routes for the implementation of N offsets according to the definition of N-neutrality. For example, the 18th Nitrogen Workshop9 selected the REFOOD project10 for targeting at the reduction of N losses at one of its roots in affluent European societies: waste (Bellarby et al 2013, FAO 2011, Parfitt et al 2010).
Other projects, specifically targeting different N forms or different compartments affected, thus atmosphere or hydrosphere, might be selected for compensation of other events. The effect of Nr released to the environment is variable in space and time and such aspects could potentially be included in both the quantification of Nr releases and the selection of a compensation project.
Standards for N offset projects
Stringent rules and standards have been developed for carbon offsetting projects (Global Carbon Project 2008) to ensure that the offset results in a real change for the environment. The criteria for allowable offsets are additionality, leakage avoidance, permanence, verification, and efficiency. All of these standards with the exception of 'permanence' (where carbon sequestration in soils or forest biomass is reversible) are relevant also for N offsetting. Additionality, which means that the offset needs to be in addition to what would have happened otherwise, is difficult with regard to the small scale of N offsetting donations which requires that existing projects are selected; however the donation such as the one presented here to the UN Millennium Villages Project will most likely help to reach their target earlier or can go further which would be a real 'extra' offset. A baseline assessment, however, is not possible. Verification and efficiency will be ensured by reports on the progress of the use of the donations, as accorded with the Ruhiira Millennium Village. As the projects do not target any decrease in production, any leakage effect can be excluded.
Inclusion or exclusion of energy related releases
N2013 chose not to consider energy-related Nr releases. Because N2013 was an international conference, it is expected that emissions from traveling to the venue were significant. Incorporating the energy related emissions is important for combining the concepts of C- and N-neutrality. Both carbon and nitrogen are in principle essential elements for overall sustainability.
For N2013 the reasons for excluding energy were twofold—first, the N-neutrality concept was being newly developed which made it difficult to monitor energy use and measure GHG emissions; second, the estimate of the offset-price per person was high at US$ 50 and already stretched the possibility of participants contributing to N-neutrality. Adding to that cost other offsetting needs for energy would rather have resulted in lower voluntary contributions. Indeed, in a survey made at N2013 evaluating the N-neutrality concept and its implementation, 50% of those who gave a reason why they did not contribute mentioned the price. Nevertheless, the survey also revealed that not including energy emissions was seen as problematic by some participants. However, the investment of the donation for tree planting—even though not chosen for this purpose—will still contribute to some carbon sequestration.
Do we need a reference level of Nr releases?
In contrast to the carbon footprint and offset for GHG emissions, the use of N is not an unwanted side effect of food production but is intended and required to feeding a growing global population (Erisman et al 2008). Food is an essential human need (FAO WFP and IFAD 2012), and a differentiated assessment on the basis of regional critical limits might lead to somewhat higher 'emission allowances' as compared to the planetary boundary of 35 Tg N fixed annually proposed by Rockström et al (2009) (De Vries et al 2013). However, if the aim is the reduction of the wasteful use of N, the introduction of a reference situation in the concept of N-neutrality would add complexity without substantial improvements. This is similar to biogeochemical emissions of GHGs, contributing to C footprints, which are not completely avoidable yet can be controlled. The situation might have to be re-assessed, however, if a functioning N offset market is to be established.
N footprint as a measure for Nr releases
We used the N footprint to quantify Nr releases related to the food chain of a product. However other metrics are possible. For example, such other choices could consider the N flows after consumption, indirect emissions from land use changes, or energy input. The choice depends both on practical considerations and on the objective, mainly if increased resource use efficiency is targeted (in this case N2 emission are to be counted as wasteful losses and as such need to be included in the Nr releases quantification) or if a reduction of adverse effects linked Nr emissions is targeted (in this case N2 emissions should not be considered). Furthermore, choices on including post-consumption stages (which might not be under control of individuals) or possible (indirect) land use change emissions are to be made. A discussion on possible metrics to quantify the Nr releases is given in the supplementary information.
Conclusion
The N-neutrality concept can be applied to a major scientific conference to raise awareness, reduce the conference's N footprint, and demonstrate that real compensation of Nr releases is possible. Multi-faceted solutions are feasible, and the choice of the compensation program needs to match the socio-environmental settings of the entity that caused the Nr releases. Scientific progress on the standardization of the methods for the quantification of Nr releases and N offset needs to continue. The high spatio-temporal variability of both factors and the particularity of N as a cascading environmental pollutant must be considered. The ideal situation to test this concept is at future conferences or other events. To advance the implementation of such measures, further education is needed to change behaviors. A longer-term goal might be the creation of an N offsets market in parallel or even in combination with the existing C offsets markets.
Acknowledgements
We are thankful to all participants of the 'Workshop on N-sustainable food systems in Uganda' November 2012, Makerere University, for valuable and constructive discussions paving the way for the implementation of the N-neutrality concept for the N2013 conference. We are also grateful for the support of the INI steering committee and the chairs of the continental branches of INI. Last but not least we want to express our thanks to the staff of Speke Resort for cooperation.
Footnotes
- 7
See also http://n-print.org/.
- 8
Kampala, Uganda, 18–22 November 2013, see http://n2013.org/.
- 9
Lisbon, Portugal, 30 June–3 July 2014, see www.nitrogenworkshop.com/.
- 10