

Abstract
Efforts to estimate plant productivity using satellite data can be frustrated by the presence of cloud cover. We developed a new method to overcome this problem, focussing on the high-arctic archipelago of Svalbard where extensive cloud cover during the growing season can prevent plant productivity from being estimated over large areas. We used a field-based time-series (2000−2009) of live aboveground vascular plant biomass data and a recently processed cloud-free MODIS-Normalised Difference Vegetation Index (NDVI) data set (2000−2014) to estimate, on a pixel-by-pixel basis, the onset of plant growth. We then summed NDVI values from onset of spring to the average time of peak NDVI to give an estimate of annual plant productivity. This remotely sensed productivity measure was then compared, at two different spatial scales, with the peak plant biomass field data. At both the local scale, surrounding the field data site, and the larger regional scale, our NDVI measure was found to predict plant biomass (adjusted R2 = 0.51 and 0.44, respectively). The commonly used 'maximum NDVI' plant productivity index showed no relationship with plant biomass, likely due to some years having very few cloud-free images available during the peak plant growing season. Thus, we propose this new summed NDVI from onset of spring to time of peak NDVI as a proxy of large-scale plant productivity for regions such as the Arctic where climatic conditions restrict the availability of cloud-free images.
Export citation and abstract BibTeX RIS

Original content from this work may be used under the terms of the Creative Commons Attribution 3.0 licence.
Any further distribution of this work must maintain attribution to the author(s) and the title of the work, journal citation and DOI.
Introduction
The use of satellite-derived data, such as the Normalised Difference Vegetation Index (NDVI), has provided great opportunities for large-scale monitoring of environmental change, particularly in regions that are remote and difficult to access (Kerr and Ostrovsky 2003, Turner et al 2003, Pettorelli et al 2005). Indeed, several remotely-sensed NDVI-based studies covering large areas of high latitudes in the north have indicated increased vegetation greenness during the last few decades (Myneni et al 1997, Beck and Goetz 2011, Epstein et al 2013, Xu et al 2013, Park et al 2016, Vickers et al 2016). However, there can be major drawbacks in deriving accurate assessments of plant productivity over large areas using proxies such as NDVI: for example, the lack of sufficient cloud-free data and the absence of validation with field-based plant biomass data. Extensive cloud cover typically leads to an underestimation of plant productivity when based on peak or average NDVI values (cf Comiso and Hall 2014). Very few large-scale studies have validated satellite-derived plant productivity proxies with plant biomass data from field-based studies, with those that have then using data from only one season and thus failing to capture annual variability (Epstein et al 2012, Raynolds et al 2012). Therefore, to provide more accurate proxies of plant productivity at large spatial scales in regions where cloud cover is particularly prevalent, new methodologies are required which are validated against data from long-term field-based studies.

Figure 1. The study area in central Spitsbergen, Svalbard: (a) mean (2000−2014) July NDVI values and the locations of the field validation data site in Semmeldalen, the capital Longyearbyen (black dot) and its nearby meteorological station (red dot); (b) mean (2000−2014) onset of the growing season, extracted from Karlsen et al (2014), with names of fjords and valley systems mentioned elsewhere in the text.
Download figure:
Standard image High-resolution imageOne such area that is experiencing rapid change and suffers from extensive cloud cover is the Arctic. Here, summers are becoming warmer (IPCC 2014), which potentially is one of the major drivers of tundra ecosystem change (Post et al 2009, Ims and Ehrich 2013). Changes in plant productivity influence the rate of energy and nutrient cycling in arctic ecosystems (Sjögersten et al 2012) and are therefore particularly important to track. However, carrying out long-term field-based studies of plant productivity in such remote locations is labour intensive, expensive and logistically challenging. Hence, extremely few long-term time-series of arctic plant productivity exist, especially at very high latitudes (Hudson and Henry 2009, Gauthier et al 2011, Elmendorf et al 2012, Van der Wal and Stien 2014). Therefore, development of robust, cost-effective, efficient, and spatially extensive tools for monitoring the spatio-temporal variation in plant productivity are crucial to aid in predicting future environmental changes (Pettorelli et al 2005).
Here we present a new methodology for estimating plant productivity using satellite-derived data, which addresses the problem of data scarcity due to extensive cloud cover. We combine a MODIS-NDVI dataset, which covers the high-arctic archipelago of Svalbard, with a unique long-term time-series (2000−2009) of field-based plant productivity data to give validated annual estimates of plant productivity at the landscape scale. The performance of this new MODIS-NDVI derived predictor of plant productivity is then compared with other commonly used plant productivity proxies: peak NDVI, summer temperatures and growing degree days (GDD).
Material and methods
Study area
The study area comprised the central part of West Spitsbergen (Nordenskiöld Land peninsula) in the archipelago of Svalbard, located between approximately 77.7°N−78.4°N and 13.5°W−17.4°W (figure 1). The meteorological station at Svalbard Airport, located close to the archipelago's administrative centre Longyearbyen (figure 1(a)), recorded a mean July air temperature of 7.0 °C for 2000−2014 (Norwegian Meteorological Institute 2015); the annual mean air temperature over the same period was −3.5 °C. Various habitats occur within the study area, including heaths, fens and mires (Johansen et al 2012, Johansen and Tømmervik 2013). At higher elevations the vegetation is sparse, as shown in July NDVI values below 0.2 (figure 1(a)). Onset of the growing season, as defined by MODIS data and corresponding to time of flowering of the widespread polar willow (Salix polaris), normally occurs in mid to late June in the bottom of the valleys and in the first half of July at higher elevations (figure 1(b)), but there is high additional variability in space, as well as between years (Karlsen et al 2014).
MODIS-NDVI data
Due to the short and intense period of plant growth in the High Arctic and the occurrence of frequent cloud cover (see Van der Wal and Hessen 2009), all possible cloud-free data are needed when determining the onset of the growing season from satellite-based NDVI data. Karlsen et al (2014) used MODIS Terra data (MOD09Q1 and MOD09A1 surface reflectance products, both with 8 day temporal composites), to map the onset of the growing season on Svalbard from 2000–2013 (figure 1(b)). To make use of as much cloud-free data as possible, a combination of three cloud removal methods (MODIS State Quality Assurance values, the authors' own algorithms and manual removal of cloudy parts of the image) were used (for more processing details, see Karlsen et al (2014)). In the current study, the MODIS-NDVI (232 × 232 m pixel size) dataset has been extended to include data from 2014. In addition, the dataset has been interpolated to daily time resolution, from which the annual onset of the growing season was calculated on a pixel-by-pixel level and defined as the time when the NDVI value for that year exceeded 70% of the 4 July to 3 August mean NDVI value from 2000−2014. Due to insufficient data in spring 2001, no granules of MODIS data were produced for the period 15 June−1 July 2001 (day-of-year 166−182). Since the spring 2001 data was also partly cloudy in the days prior to 15 June, the time gap was too long to allow interpolation by the adaptive Savitzky–Golay filter that we used. Therefore, we treated this period separately and used a simple linear interpolation method (weighted mean values from the cloud-free pixels before and after) to fill this gap (for spring 2001 only).
Plant biomass field data
To validate the plant productivity proxy that we derived from MODIS-NDVI data (2000−2014), we used above-ground live vascular plant biomass data that was collected annually from 2000−2009 (as described in Van der Wal and Stien 2014). This plant biomass data covers marsh, ridge and heath vegetation types, and was collected in Semmeldalen (figure 1(a)). Field sampling was done annually around 1 August (range of medium sampling dates: 24 July−6 August), i.e. close to the estimated peak NDVI (see Results). For this study we have used annual mean biomass estimates from five sampling sites (100−1600 m apart) in the most common vegetation type, i.e. moist Luzula heath, which is also widespread across central Spitsbergen (Elvebakk 2005, Johansen et al 2012). Each sampling site was relatively homogeneous in terms of micro-topography and vascular plant community composition over at least 25 m2. The biomass estimates are the sum of above-ground live vascular plant biomass, obtained through a combination of non-destructive shoot density counts in small (25 cm × 25 cm) permanent plots (10 per sampling site) and destructive shoot mass determinations outside these plots. Although the field sampling method allowed for the inclusion of small amounts of perennial above-ground biomass (from polar willow, of which 28% ± 7% (SD) of shoot tissue sampled was categorized as 'branch', and part of this will have been produced in years prior to when sampled), the biomass estimates largely consist of the annual growth of vascular plants (hence using peak plant biomass estimates as a field-based index of plant productivity).
Relationships between MODIS-NDVI data and field-based plant productivity data
To link the MODIS-NDVI data with the field-based plant productivity data two masks of different sizes were created. Firstly, in order to spatially match the (232 m pixel size) MODIS-NDVI data with the field biomass data, a single polygon enclosing moist Luzula heath vegetation (i.e. the target of the biomass sampling data used here) was delineated on a map in the field. This local mask represented densely vegetated areas with moist Luzula heath and hence excluded areas such as river, river gravel, snow patches, less vegetated ridges and wetlands. The resulting mask covered 7 MODIS pixels (0.38 km2), and is hereafter referred to as the local mask. Secondly, to test the NDVI field-data relationship for larger areas, a general mask was created (hereafter referred to as the regional mask), covering the entire study area depicted in figure 1. In this mask, only MODIS pixels with mean (2000−2014) July NDVI values above 0.5 were included (see dark green areas in figure 1(a)), resulting in a coverage of approximately 405 km2. We used the NDVI threshold of 0.5 to ensure that the vegetation most representative of the field validation study area was included, and to reduce noise from sparsely vegetated areas.
Since several years in our study period were characterized by frequent cloud cover before and during the peak growing season (modal, median and average cloudiness of 6.5 recorded on an 8 point scale at Longyearbyen airport—see Van der Wal and Hessen 2009), we developed a new NDVI measure, which calculated the integrated NDVI from the onset (O) to the Peak (P) of the growing season (hereafter referred to as OP NDVI). For each year we calculated a cumulative measure of NDVI from time of onset of the growing season on a pixel-by-pixel level within the masks. However, for the peak of the growing season NDVI we used a fixed date, for all pixels for all years because time of maximum NDVI on a pixel-by-pixel and year-by-year basis showed several outliers. These were, again, likely due to the frequent cloud cover on Svalbard during the peak NDVI period and because some bryophyte-dominated areas may have their highest NDVI value either early or late in the season due to their lack of senescence (Arndal et al 2009). Hence, we estimated the average time of maximum NDVI across all pixels in all years, which for the Central Svalbard mask was 25 July (mean value for the 2000−2014 period). Therefore, to simplify data analysis and to reduce noise problems from cloud cover and bryophyte dominated areas we used 25 July (day-of-year 206) as time of maximum NDVI for both masks (local and regional) for all pixels in all years when calculating OP NDVI. For comparison of OP NDVI with more traditionally used NDVI products, we also determined peak NDVI values for both the local and regional mask areas using the unprocessed MOD09Q1 MODIS products.
Weather station data
Given the importance of summer temperature for high arctic plant growth (Van der Wal and Hessen 2009, Van der Wal & Stien 2014), and thus its likely influence on NDVI, we obtained daily mean temperatures from the meteorological station at Svalbard Airport near Longyearbyen (see figure 1(a) for its location). Two summer temperature indices were calculated for each year, i.e. average July temperature and total growing degree days (GDD). GDD (defined as the temperature sum > 0° C) were calculated from time of onset of the growing season (average for the respective mask each year) to average time of peak maximum NDVI (25 July) using daily mean temperatures.
Statistical analyses
Statistical analyses were carried out in R version 3.1.1 (R Development Core Team 2015). We used linear regression models to determine the relationship between (field-based) plant productivity and OP NDVI values derived from MODIS data for the two different masks (local and regional) for the period 2000−2009; the same analysis was run using maximum NDVI values instead of OP NDVI to contrast goodness of fit. We also used a similar model structure to analyse the extent to which between-year variation in OP NDVI (period 2000−2014) could be explained by the accumulated predictor variable GDD and, alternatively, onset of growth and July temperature, for the two different masks. The linear regression models used F-tests for analysis of variance, with the numerator and denominator degrees of freedom indicated by the subscript numbers.
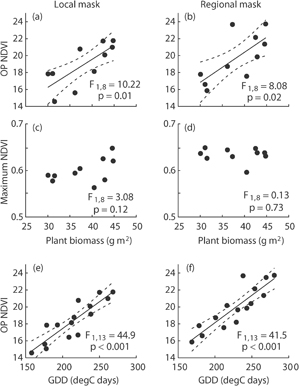
Figure 2. (a) and (b) Relationship between OP NDVI (cumulative NDVI calculated between onset of spring and peak biomass) for the local mask and the regional mask and field based estimates of live above-ground vascular plant biomass; (c) and (d) relationship between maximum NDVI for the local mask and the regional mask and the field based estimates of live above-ground vascular plant biomass; (e-f) relationships between growing degree days (GDD) calculated from Svalbard airport weather station data, and OP NDVI for the local mask and the regional mask.
Download figure:
Standard image High-resolution imageResults
Relationships between NDVI measures and field-based plant productivity
For the period with overlapping data for NDVI and plant biomass (2000−2009), average annual plant biomass in the moist Luzula heath plots varied between 30.0 and 44.8 g m−2 (mean = 38.1, SD = 5.7, table A1), while the average MODIS based OP NDVI values for the time of onset of growth until the time of maximum NDVI varied between 14.6 and 21.8 (mean = 18.4, SD = 2.4) and 15.9 and 23.7 (mean = 19.9, SD = 2.5) for the local and regional masks, respectively. OP NDVI showed a strong positive relationship with the plant biomass data measured in the field (figure 2(a), figure 2(b); Pearson's correlation coefficients r = 0.75 and 0.71 for the local and regional mask, respectively), and the relationship was even stronger for the annual rates of change (figure A1). With the local mask, which surrounds the field data site, the OP NDVI increased by 6.62 for each 10 g m−2 increase in plant biomass (F1,8 = 10.2, p = 0.01, adjusted R2 = 0.51; figure 2(a)). With the regional mask, where the mask covers all areas with high summer NDVI values, the OP NDVI increased by 9.70 for each 10 g m−2 increase in plant biomass (F1,8 = 8.08, P = 0.02, adjusted R2 = 0.44; figure 2(b)). Compared with OP NDVI, maximum NDVI proved to be a poor proxy of peak plant biomass (figures 2(a) and (b), table 1). Using the local and the regional masks, the relationships between maximum NDVI and peak plant biomass were non-significant (F1,8 = 3.08, p = 0.12 for the local mask and F1,8 = 0.13, p = 0.73 for the regional mask). When calculating OP NDVI from the original MODIS product before any processing and cloud removal, correlation with the field data were then less than 0.3 for both masks (data not shown).
Table 1. Correlations between variables used in the statistical analyses. Above the diagonal are Pearson correlation coefficients, and below the diagonal are the two-tailed P-values. P values in bold are significant at the 0.05 level.
| Biomass (field- based measure) | OP NDVI (local) | OP NDVI (regional) | Max NDVI (local) | Max NDVI (regional) | Onset of spring (local) | Onset of Spring (regional) | GDD (local) | GDD (regional) | July temp. | Year | |
|---|---|---|---|---|---|---|---|---|---|---|---|
| Biomass (field- based measure) | — | 0.75 | 0.71 | 0.53 | –0.13 | –0.65 | –0.62 | 0.91 | 0.94 | 0.94 | 0.50 |
| OP NDVI (local) | 0.0127 | — | 0.86 | 0.59 | 0.13 | –0.92 | –0.82 | 0.94 | 0.89 | 0.69 | –0.02 |
| OP NDVI (regional) | 0.0128 | 0.0015 | — | 0.69 | 0.15 | –0.67 | –0.94 | 0.81 | 0.89 | 0.65 | –0.02 |
| Max NDVI (local) | 0.1173 | 0.072 | 0.0282 | — | 0.41 | –0.46 | –0.56 | 0.63 | 0.68 | 0.49 | 0.08 |
| Max NDVI (regional) | 0.77302 | 0.7231 | 0.6713 | 0.2404 | — | –0.10 | 0.04 | 0.05 | 0.06 | –0.27 | –0.67 |
| Onset of spring (local) | 0.0424 | 0.0001 | 0.034 | 0.1853 | 0.7874 | — | 0.72 | –0.85 | –0.75 | –0.61 | 0.04 |
| Onset of Spring (regional) | 0.0549 | 0.0034 | <0.0001 | 0.0935 | 0.9175 | 0.0185 | — | –0.74 | –0.81 | –0.61 | 0.01 |
| GDD (local) | 0.0003 | <0.0001 | 0.0045 | 0.0491 | 0.8822 | 0.002 | 0.0144 | — | 0.97 | 0.81 | 0.23 |
| GDD (regional) | <0.0001 | 0.0005 | 0.0006 | 0.0296 | 0.8720 | 0.0117 | 0.0049 | <0.0001 | — | 0.84 | –0.26 |
| July temp. | <0.0001 | 0.0288 | 0.0406 | 0.1548 | 0.4559 | 0.0603 | 0.0598 | 0.0044 | 0.0022 | — | 0.52 |
| Year | 0.1375 | 0.9594 | 0.9485 | 0.8214 | 0.0328 | 0.9025 | 0.9679 | 0.5136 | 0.4611 | 0.1277 | — |
Predictors of OP NDVI and plant productivity
Analysis of the whole time-series (2000−14) revealed that OP NDVI was strongly and positively related to growing degree days (GDD) for both the local mask (F1,13 = 44.9, p < 0.001; figure 2(e)) and the regional mask (F1,13 = 41.5, p < 0.001; figure 2(f); table 1). GDD in turn was explained well by a multiple regression model including the additive effects (see table 1 for pairwise relationships) of the satellite imagery-based onset of spring and July temperature (F2,12 = 27.9, p < 0.001, adjusted R2 = 0.79). Accordingly, and unsurprisingly—due to its cumulative nature—OP NDVI was highly correlated with onset of growth (r = −0.89 and −0.93 for the local and regional masks, respectively; table 1). Onset of growth was also significantly correlated with field-based plant productivity (r = −0.65 and −0.62 for the local and regional masks, respectively; table 1), but not as strongly as with OP NDVI (table 1). Likewise, both OP NDVI and (in particular) field-based plant productivity were also positively correlated with July temperature (r = 0.69 (local), 0.65 (regional) and 0.94 (field-based), respectively; table 1). Thus, although careful interpretation is needed due to a tendency for collinearity, a multiple regression model (local mask: F2,12 = 25.3, p < 0.001, adjusted R2 = 0.78; regional mask: F2,12 = 41.4, p < 0.001, adjusted R2 = 0.85) indicated that OP NDVI values were effectively highest for years in which growth was estimated to start early and the summer was warm, which in turn explained the apparent positive effect of a high accumulated GDD (figure 2(e) and (d)). This pattern was also indicated in the shorter time-series (2000−09) of field-based productivity data (F2,7 = 27.2, p < 0.001, adjusted R2 = 0.85), although the effect of onset of growth (see table 1) was far from significant (p = 0.48 and 0.65 for local and regional mask, respectively) when fitted together with the strong July temperature effect (see also Van der Wal and Stien 2014).
Temporal and spatial patterns of OP NDVI
High OP NDVI values, i.e. above ca. 20 units (corresponding to a plant biomass of more than 39 g m−2 based on figures 2(a) and (b), were predominantly found at lower elevations of the main valleys of central Svalbard (figure 3). In two of the valleys (Adventdalen and Colesdalen, see figure 1(b)), OP NDVI values exceeded 25 in some spots, indicating an average peak plant biomass of more than 45 g m−2 for these areas (given the temporal linear relationships in figure 2(a) and (b), and assuming that they can be extended). At higher elevations, the average OP NDVI values fell below 10 (i.e. < 25 g m−2).

Figure 3. OP NDVI values from onset of the growing season to time of maximum NDVI. Mean values for the 2000−2014 period are shown.
Download figure:
Standard image High-resolution imageLarge regional and inter-annual (2000−2014) variations in OP NDVI were apparent (figure 4), however there was no significant relationship between either the local or regional OP NDVI mask and year (r = −0.02 in both cases; table 1). In some years, OP NDVI was uniformly reduced across the whole of the study area, such as in 2008 with 84 % of the mapped area having an OP NDVI value of at least 2 units below the 2000−2014 average (figure 4). The years 2000 and 2009 also had lower than average OP NDVI values (58 % and 42 % of the mapped area > 2 units below average, respectively). Yet, the spatial pattern of reduced OP NDVI differed greatly between the two years, with reduced plant productivity in the eastern part of West Spitsbergen (including Sassendalen, Adventdalen and inner Reindalen) in 2000 and in the central part (including the valleys of Colesdalen, Semmeldalen and outer Reindalen) in 2009. Several years, such as 2002, 2006 and 2013, had generally greater than average OP NDVI (and, hence, plant productivity). In yet other years, some areas were more productive than average whilst other parts were less productive. This was, for example, the case for the years 2010 and 2014, but strikingly the area which had reduced productivity in 2010 (Reindalen) had greater than average productivity in 2014, highlighting the great variability in opportunities for vascular plant growth in different valley systems in different years. See appendix figure 1 for time-series plots showing the annual variation in OP NDVI, and other predictors (max NDVI, the onset of spring, GDD and July temperature), for the Nordenskiöld Land peninsula study area as a whole.
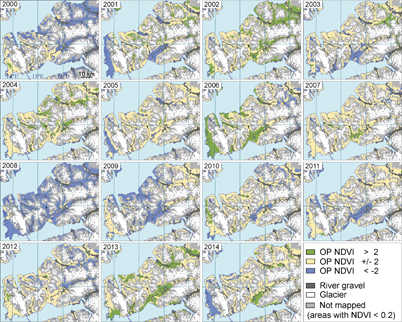
Figure 4. Spatio-temporal variation in OP NDVI relative to the 2000−2014 average.
Download figure:
Standard image High-resolution imageDiscussion
Previous studies of vegetation greenness based on time-series of satellite data from sensors such as MODIS, Spot Vegetation or the GIMMS datasets either used maximum NDVI or NDVI values integrated over two–three summer months or the photosynthetically active period (e.g. Beck and Goetz 2011, Bhatt et al 2013, Xu et al 2013). Such approaches may be functional for arctic regions with continental climates, but for regions subject to more oceanic conditions, cloud cover may render too many satellite images—in some or many years—unusable. This was very much the case for the satellite-based MODIS products of our high-arctic study region (Central Svalbard), with scarcity of cloud-free days rendering non-significant the relationship between maximum NDVI and field-based vascular plant productivity across years. To address this problem we developed an alternative approach, OP NDVI, which integrates MODIS-NDVI data from the start of the growing season to its peak, to determine plant productivity in regions of the Arctic with an oceanic climate. By taking advantage of (cloud-free) data from across the growing season, this method is less subject to the effects of stochastic cloud cover during the peak growing season, which is likely to underestimate maximum NDVI in some years. Furthermore, by only including the period up to average peak productivity, OP NDVI avoids problems related to estimating the NDVI curve at the end of the growing season (which is included in 'integrated NDVI'). We were able to test the relative performance of our new NDVI measure with ground-based plant biomass data over a large number of years (Van der Wal and Stien 2014). This extensive validation is unusual as very few satellite-based vegetation greenness studies are validated with plant biomass data (e.g. Raynolds et al 2012) and none with field measurements from more than a single season, meaning that between-year variability in either measure (ground or satellite-based) has so far remained uncaptured. This new approach uses all cloud-free satellite pixels (by combining three different cloud detection methods) obtained during the plant growing season to effectively reconstruct a seasonal NDVI curve (using the adaptive Savitzky–Golay filter), determine the onset of the growing season for each pixel and identify the average date of maximum NDVI across all pixels for all years. Accordingly, as confirmed by the strong relationship with field-based plant productivity, OP NDVI seems to capture the build-up of plant productivity over the course of the main part of the plant growing season and was strongly and significantly related to our measure of field-based plant productivity. The fact that we failed to detect such a relationship when calculating OP NDVI from MODIS data before cloud removal had taken place further indicates the compromising effect of clouds in this high-arctic ecosystem. Importantly, our analyses also confirmed the inapplicability of the current standard approaches (maximum NDVI) when using satellite-derived data in cloudy areas to estimate plant productivity. This more commonly used measure provided a poor, and non-significant fit with the field data, thereby demonstrating the superiority of our newly developed NDVI method.
The validity of our newly developed NDVI method for estimating plant productivity found further support in the strong relationship with growing degree days (GDD), and the fact that this measure, in turn, was strongly related to two factors known to be important for arctic plant growth: onset of spring and mean July temperature. Onset of spring, as calculated from our data, does not indicate the first evidence of new leaves on the tundra, but that of flowering in polar willow and a variety of other vascular plant species (see Karlsen et al 2014). Variation in the determined onset of spring meant that the length of time over which NVDI was calculated largely concerned July. Whilst this did not preclude onset of spring from greatly influencing OP NDVI—by determining the length of time over which this measure could accrue—it was likely the reason why this ecologically meaningful term was not significant in the model explaining variation in the field-based plant productivity data over and above the strong predictor July temperature (Van der Wal and Stien 2014). OP NDVI was more strongly correlated with GDD than with plant biomass. This could be because GDD and OP NDVI are both cumulative measures, while the plant biomass data was sampled at a fixed time (around 1 August). However, this could also be a result of working across different spatial scales. The field data is sampled on species level, which experiences a more complex set of factors influencing its accrual than GDD (extreme climatic events, local grazing pressure, etc.), while the integration of daily mean temperature data from the weather station and the coarse MODIS-NDVI pixels represent more comparable scales in time and space (cf Clark 1985).
The fact that, in our case study, local summer temperatures seem better at capturing annual fluctuations in peak plant biomass than OP NDVI, does not, we feel, suggest that satellite-derived measures are potentially inferior for analyses of large-scale plant productivity. The drawback in using local temperature data is that they are often simply not available at a granularity that satellite-based data is, with the nearest weather stations often hundreds of kilometres away. Furthermore, and perhaps more importantly, while local plant productivity in our high-arctic study area was tightly linked with local summer temperatures, the relationship is likely to be weaker in more productive arctic regions where other environmental drivers (e.g. precipitation) and growth forms, notably shrubs, prevail (Walker et al 2016).
When we applied our new NDVI method across a larger spatial area and a longer time span, we found years with high/low OP NDVI both at the start and end of the 2000−2014 study period. No statistically significant trends in productivity were apparent over this timescale, which is in accordance with several other circumpolar areas (Bhatt et al 2013). In the annual mapping of the OP NDVI (figure 4) some spatial gradients were apparent across the region, e.g. in 2006 high plant productivity occurred in the west and low productivity in the east. A somewhat opposite spatial pattern of plant productivity occurred in 2003. This could be due the oceanic gradient found in the study area, where the western parts have a more humid climate compared with the eastern parts (Førland et al 2010). An east–west pattern was also found in some years in the onset of growing season maps (Karlsen et al 2014), indicating an influence of spatial gradients in snow-pack characteristics on both onset of the growing season and, in turn, plant productivity. In addition, the timing of the break-up of the sea-ice in the large fjord in the southern edge of our study area could influence the local climate and thereby the spatial pattern in timing of the onset of the growing season and hence plant productivity (Macias-Fauria et al 2017). Furthermore, the prevailing wind direction, and thereby local duration of snow and sea ice cover, could influence the spatial patterns in plant productivity. Now that plant productivity in cloudy areas can be estimated from satellite data with considerable reliability using OP NDVI, efforts should be made to identify the key factors responsible for the spatio-temporal variability in high-arctic plant productivity.
Conclusion
This study has shown that OP NDVI, as calculated from the onset of the growing season until time of average peak NDVI, can be used for improved estimation of annual plant productivity in regions where cloudy weather typically restricts access to high-quality imagery during large parts of the growing season. Given situations where the date of onset of the growing season can be estimated and field calibration data are available, plant productivity can be estimated and its temporal and spatial variation mapped over large areas. This novel approach stresses not only the need for careful selection of the most appropriate satellite-derived data, but also the benefits of combining remote sensing tools with long-term field-based ecological data.
Acknowledgements
Processing of the MODIS dataset for monitoring the onset of the growing season was, in part, funded by the Environmental Monitoring of Svalbard and Jan Mayen (MOSJ). We are grateful to senior advisor John Richard Hansen, our contact person at the Norwegian Polar Institute in MOSJ, for his support, and to the members of the Arctic Biomass project (Research Council of Norway [RCN], grant 227064/E10) for valuable discussion about the NDVI—biomass relationships. Additional funding was provided by the RCN through the projects 'Predicting effects of climate change on Svalbard reindeer population dynamics: a mechanistic approach' (grant 216051) and 'SnoEco' (grant 230970), the ESA PRODEX project 'Sentinel-2 for High North Vegetation Phenology' (grant 4000110654), and the Svalbard Environmental Protection Funded project 'Effects of climate change on plant productivity' (grant 15/28).
: Appendix
Table A1. Correlations between annual rates of change (value year t/value year t–1) of the variables used in the statistical analyses. Above the diagonal are Pearson correlation coefficients, and below the diagonal are the two-tailed P values. P values in bold are significant at the 0.05 level.
| Biomass (field- based measure) | OP NDVI (local) | OP NDVI (regional) | Max NDVI (local) | Max NDVI (regional) | Onset of spring (local) | Onset of Spring (regional) | GDD (local) | GDD (regional) | July temp. | Year | |
|---|---|---|---|---|---|---|---|---|---|---|---|
| Biomass (field- based measure) | — | 0.86 | 0.79 | 0.40 | –0.25 | –0.75 | –0.68 | 0.93 | 0.95 | 0.93 | –0.11 |
| OP NDVI (local) | 0.003 | — | 0.82 | –0.02 | 0.04 | –0.89 | –0.78 | 0.97 | 0.93 | 0.73 | –0.08 |
| OP NDVI (regional) | 0.012 | 0.0003 | — | 0.29 | 0.22 | –0.66 | –0.91 | 0.77 | 0.89 | 0.54 | –0.14 |
| Max NDVI (local) | 0.28 | 0.94 | 0.32 | — | 0.56 | –0.01 | –0.19 | –0.12 | 0 | –0.07 | –0.04 |
| Max NDVI (regional) | 0.52 | 0.89 | 0.44 | 0.04 | — | –0.07 | 0.04 | –0.06 | 0.02 | –0.21 | 0.08 |
| Onset of spring (local) | 0.019 | <0.0001 | 0.01 | 0.99 | 0.83 | — | 0.73 | –0.85 | –0.79 | –0.75 | 0.14 |
| Onset of Spring (regional) | 0.043 | 0.001 | <0.0001 | 0.52 | 0.90 | 0.0031 | — | –0.73 | –0.82 | –0.58 | 0.14 |
| GDD (local) | 0.0003 | <0.0001 | 0.001 | 0.68 | 0.85 | 0.0001 | 0.003 | — | 0.96 | 0.80 | –0.04 |
| GDD (regional) | <0.0001 | <0.0001 | <0.0001 | 0.99 | 0.96 | 0.0008 | 0.0003 | <0.0001 | — | 0.76 | –0.10 |
| July temp. | 0.0004 | 0.003 | 0.048 | 0.80 | 0.47 | 0.002 | 0.03 | 0.0005 | 0.002 | — | –0.12 |
| Year | 0.78 | 0.77 | 0.62 | 0.88 | 0.79 | 0.62 | 0.64 | 0.90 | 0.75 | 0.68 | — |
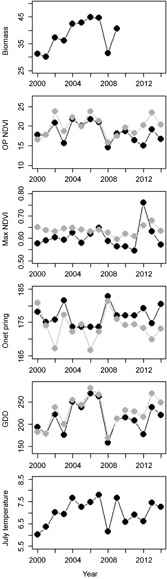
Figure A1. Time-series plots showing the annual variation of biomass, OP NDVI, maximum NDVI, the onset of spring, growing degree days (GDD) and July temperature. For the satellite derived measures, black symbols are for the local mask in Semmeldalen, while grey symbols represent the regional mask (i.e. Nordenskiöld Land peninsula as a whole).
Download figure:
Standard image High-resolution image