

Abstract
Following a decade of unprecedented investment, China now has the world's largest installed base of wind power capacity. Yet, despite siting most wind farms in the wind-rich Northern and Western provinces, electricity generation from Chinese wind farms has not reached the performance benchmarks of the United States and many other advanced economies. This has resulted in lower environmental, economic, and health benefits than anticipated. We develop a framework to explain the performance of the Chinese and US wind sectors, accounting for a comprehensive set of driving factors. We apply this framework to a novel dataset of virtually all wind farms installed in China and the United States through the end of 2013. We first estimate the wind sector's technical potential using a methodology that produces consistent estimates for both countries. We compare this potential to actual performance and find that Chinese wind farms generated electricity at 37%–45% of their annual technical potential during 2006–2013 compared to 54%–61% in the United States. Our findings underscore that the larger gap between actual performance and technical potential in China compared to the United States is significantly driven by delays in grid connection (14% of the gap) and curtailment due to constraints in grid management (10% of the gap), two challenges of China's wind power expansion covered extensively in the literature. However, our findings show that China's underperformance is also driven by suboptimal turbine model selection (31% of the gap), wind farm siting (23% of the gap), and turbine hub heights (6% of the gap)—factors that have received less attention in the literature and, crucially, are locked-in for the lifetime of wind farms. This suggests that besides addressing grid connection delays and curtailment, China will also need policy measures to address turbine siting and technology choices to achieve its national goals and increase utilization up to US levels.
Export citation and abstract BibTeX RIS

Original content from this work may be used under the terms of the Creative Commons Attribution 3.0 licence.
Any further distribution of this work must maintain attribution to the author(s) and the title of the work, journal citation and DOI.
1. Introduction
Expanding low-carbon power generation in China is a key national priority to reduce the adverse health effects of coal use (Zhang et al 2012) and mitigate global climate change (IPCC 2015). Achieving China's target of 20% non-fossil primary energy by 2030 will require China to deploy an additional 800–1000 GW of low-carbon power generation (The White House Office of the Press Secretary 2014). Wind power is considered one of the most promising options to grow the share of low-carbon power generation in China (McElroy et al 2009, Chandler et al 2014, IRENA 2014, ERI and Energy Foundation 2015, IEA and ERI 2011). To this end, China has set in its 13th Five-Year Plan the target to reach 210 GW of grid-connected wind capacity by 2020 (China National Energy Administration 2016).
In addition to installed wind capacity targets, estimates of the technical generation potential for wind power—i.e. electricity generation realizable with current technology independent of economic and implementation considerations—suggest that China has sufficient wind resources to produce 24 700–39 400 TWh of electricity per year (McElroy et al 2009, Lu et al 2009). This is equivalent to 4.1–6.6 times China's total electricity consumption in 2016 (5990 TWh (CEC 2017)). Estimates of the Chinese wind sector's economic potential—i.e. the share of technical potential development that is also cost-competitive—though much lower, still suggest that China could vastly expand its wind generation (Davidson et al 2016). For example, McElroy et al (2009) estimate that about 6960 TWh, greater than China's current total electricity consumption, could be produced at or below a representative electricity price of CNY 0.516 per kWh. Table SM.1, available at stacks.iop.org/ERL/13/044001/mmedia, shows other estimates of economic potential pegged to several forecast years.
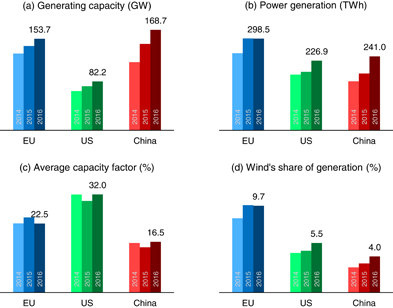
Figure 1. Comparisons of key wind sector statistics in the European Union, United States and China in 2014–2016: (a) generating capacity, (b) power generation, (c) average capacity factors (not accounting for the installation-date correction; see section 4 and SM.3.5), and (d) wind's share of total power generation. Data sources: (GWEC 2016, 2017, EIA 2017, CEC 2016, 2017, Eurostat 2017).
Download figure:
Standard image High-resolution imageTo spur growth in the sector, policy makers in China have applied a range of provincial- and national-level policies. These policies include a mandate for power companies to install minimum capacity shares of wind, a feed-in tariff introduced in 2009 that ranges from CNY 0.49–0.61 per kWh, a requirement for grid operators to connect wind farms to the grid and purchase generated power, and numerous financial and tax incentives (see section SM.4 for a comprehensive account of Chinese wind energy policies from 1994–2014). In this policy environment, cumulative installations in the Chinese wind sector rose more than 100 fold between 2005 and 2016, from around 1.3 GW to 168.7 GW (CEC 2017), pushing China's 2016 wind capacity above that of the whole European Union (153.7 GW) and more than double that of the United States (82.2 GW) (figure 1(a)). In 2016, 43% of all new wind capacity in the world was installed in China (GWEC 2017).
Despite the Chinese wind sector's unparalleled expansion of capacity, the human health and environmental benefits of this development have been less than anticipated because these benefits depend not on installed capacity but on how much electricity is fed into the electric grid to displace conventional, polluting power sources. On this metric, the Chinese wind sector falls far short of its potential and trails the European Union and the United States by a significant margin (figure 1(b)). In 2016, the European Union generated 36% more electricity per unit of installed wind capacity than China, and the United States generated 93% more (figure 1(c)). In 2016, Chinese wind farms generated 241.0 TWh of wind power from 168.7 GW of installed capacity, implying an approximate capacity factor of 16.5% (capacity factors correspond to the ratio of realized electricity generation to potential generation if a facility perpetually operates at full nameplate capacity6). This figure is significantly lower than the corresponding figures in the European Union (22.5%) and the United States (32.0%), which generates more power per unit of wind capacity than any other major economy (figure 1(c)).
Actual capacity factors in China are also significantly lower than the assumed capacity factors used in scenarios of future Chinese wind generation. Often, these scenarios use developed country experiences as references. Section SM.1 notes several recent estimates of the Chinese wind sector's economic potential and the assumed capacity factors used, with a range that spans 22.8%–31.8%. These studies utilize approximations of capacity factors far greater than current capacity factors in China (figure SM.1). It is important to emphasize that these studies are designed to estimate the potential of the Chinese wind sector in the future and assume, rather than estimate, performance characteristics (i.e. capacity factors) in line with current performance benchmarks of developed countries. Our present study is focused on the historical performance of the Chinese wind sector and is designed to identify the opportunities to improve the sector's future performance. Our approach is to identify the components of the gap between past performance and technical potential in China and the United States. In short, our work complements previous work by using historical data to identify the areas with the largest potential to reach the higher future capacity factors used in other work.
In the remainder of this paper, we develop a framework to estimate the technical potential of wind generation in a country, which we apply consistently to China and the United States. We then quantify the factors that have contributed to the Chinese and US wind sector's shortfall in generation between 2006 and 2013. We explain how these factors have changed over time and how the power generation gap in China compares to that in the United States. Finally, we use the analysis of the performance gaps and the comparative analysis to inform a discussion of policy options that could address the wind power generation gap in China.
2. Factors contributing to the wind generation shortfall in China
Understanding the drivers of the difference between actual generation and technical potential in two countries shows how generation potential is captured with different technologies, policies, and practices, thereby providing insights for improving performance. Operating at maximum technical potential is by no means an economically or socially desirable or even feasible objective. A range of technical, economic, and institutional factors contribute to the shortfall of actual wind power generation relative to both technical and economic generation potential and the capacity factors of other countries. Even perfectly competitive wind sectors that maximize private profit would not operate at maximum theoretical capacity, as improving efficiencies beyond a certain point in multiple dimensions (e.g. better siting, better turbines, reduced curtailment) may not be privately profitable. Institutional constraints compound this and (as we posit in section 7) are likely to be a primary explanation for the differences between the US and Chinese systems.
While previous studies have examined subsets of the drivers contributing to lowered capacity factors or have relied on aggregated data (see table 1 for a summary), to our knowledge, no study has explored the full range of drivers using wind farm-level data in a manner that reveals the relative importance of each driver. A recent paper estimates the impact of three key drivers of the shortfall in China (turbine choice, grid connection, and curtailment), but does not examine how these factors compare to farm siting, hub height, and operational efficiency, factors that we find contribute nearly 40% of the average annual difference between technical potential and actual generation (Lu et al 2016). As a result of this gap in the literature, there is limited systematic understanding of the drivers of the Chinese wind generation shortfall—an understanding that is critical for assessing the future costs and benefits of various policies that could be put in place to address the shortfall. Further, as an early-moving developing country in installing wind power, learning from China's experience would be valuable for other developing countries anticipating an expansion of their domestic wind power sectors.
In this paper, we develop a framework for analyzing a dataset of nearly all wind farms in China (a dataset of 64 272 turbines in 1065 unique sites) and the United States (52 959 turbines installed in 769 unique sites) installed through 2013. Using this framework, we quantify the impact of the following six drivers that explain the performance of each country's wind sector:
- 1.installation-date correction (correcting for data reporting practices of turbine installations and electricity generation);
- 2.site selection;
- 3.turbine choice (which includes turbine model and hub height selection);
- 4.grid-connection delays;
- 5.curtailment; and
- 6.operational efficiency (a residual factor that captures unobserved factors, such as losses from the electrical efficiency of the wind farm and technical unavailability due to maintenance and repairs).
These six drivers are described in table 1. Section SM.5 expands table 1 to include more detailed explanations of each of the six drivers underlying the shortfall in capacity factors as well as measures discussed in the literature to address each of the gaps.
Table 1. Factors contributing to the gap between potential and actual wind power generation, listing previous assessments, definitions, and mechanisms. See section SM.5 for an expanded discussion of drivers and possible interventions to address each gap.
| Gap (previous assessments) | Definition | Mechanisms |
|---|---|---|
| Installation-date correction | Analytic error in comparing year-end capacity with cumulative generation over the year | • Newly commissioned capacity during any year is not available to generate for the entire year |
| Site selection (Tang and Popp 2016, Yang et al 2012, Wang et al 2012, CREIA et al 2013) | Gap between power generation in best feasible wind sites and power generation in actual sites | • Sub-optimal siting occurs due to availability, price, and right to access land• Sub-optimal siting may occur due to transmission constraints and incentives to site projects in close proximity to grid substations• Sub-optimal siting across provinces occurs due to political drivers |
| Turbine choice (Tang and Popp 2016, Li et al 2012, Qiu and Anadon 2012, Lewis 2013, Zhao et al 2012b, Wang et al 2012, Gosens and Lu 2013, Cyranoski 2009, Lu et al 2016) | Gap between potential of state-of-the-art turbines at optimal heights and power generation with turbines as installed | • Tower height (hub height) is constructed lower than state-of-the-art• Selected turbine model is less efficient than state-of-the-art• Turbine model is not suited to local wind profile and climate conditions |
| Grid-connection delay (Yang et al 2012, Li et al 2012, Cyranoski 2009, Lu et al 2016, Lam et al 2016) | Lost power generation due to delay between turbine commissioning and grid connection | • Commissioned wind turbines cannot produce electricity if not connected to the grid |
| Curtailment (Yang et al 2012, Li et al 2012, Pei et al 2015, Davidson 2014, Zhao et al 2012a, Lu et al 2016, Lam et al 2016) | Lost power generation due to generated electricity being curtailed (not dispatched onto the grid) | • Power that could be generated is not dispatched onto the grid in response to grid operator requests |
| Operational efficiency (Tang and Popp 2016, Li et al 2012, Qiu and Anadon 2012) | Remaining gap between predicted and actual power generation after accounting for above factors | • Inefficiencies are caused by electrical losses in the wind farm (e.g. transformer substation inefficiency)• Turbines are unavailable due to maintenance• Other unobserved factors create inefficiency |
3. Data and methods
To quantify the impacts of the factors that contribute to the shortfall between technical potential and observed wind power generation in China and the United States, we compile a uniquely detailed dataset of individual turbines and wind farms. This dataset includes high-resolution hourly wind speed, turbine models, installation information, and power generation for each existing wind farm in both countries between 2006 and 2013, the latest year for which micro-level Chinese data is available. We believe this dataset to be the first of its kind in its comprehensiveness and micro-level information. Section SM.2 compiles a complete list of data sources and a more detailed description of our methodology.
Our dataset allows us to take a unique bottom-up approach to calculating an estimate of technical potential. Beginning with the observed data, we first correct for inconsistencies in the timing of reported data7. Then we sequentially impose a set of technical assumptions to arrive at our technical potential. These imposed assumptions allow us to quantify six driving factors that explain the gap between the technical potential capacity factor and observed capacity factor. Previous 'top-down' approaches to estimating technical potential begin with assessments of natural wind resources and layer assumptions of imperfect wind extraction technologies, including taking capacity factors from other countries (e.g. McElroy et al (2009)). In contrast, our approach to estimating technical potential begins with a 'bottom-up,' data-rich characterization of actual performance and sequentially connects observations with theoretically optimal configurations to estimate the technical potential in terms of capacity factor. We are able to systematically explore a wide range of explanatory factors using historical data to inform what would need to change to make it possible to reach the higher capacity factors assumed in forward-looking analyses.
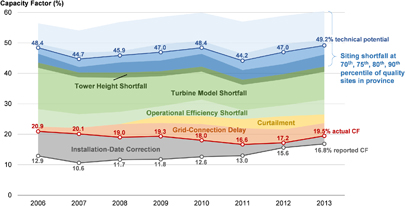
Figure 2. The shortfall in average capacity factors in the cumulative installed wind power base in China from 2006 to 2013 attributed to seven factors: installation-date correction, grid-connection delay, curtailment, operational efficiency shortfall, turbine model shortfall, tower height shortfall, and siting shortfall. The siting shortfalls (shown in different shades of blue) indicate average capacity factors Chinese wind farms could achieve if they were installed in sites in the same province with better wind resources. The Xth siting percentile areas show the average capacity factor that could be achieved if all wind turbines were installed in the Xth percentile of sites within the same province. We adopt the convention of using the 75th percentile of within-province site quality to define technical potential, but display the 70th, 75th, 80th, and 90th percentiles as well.
Download figure:
Standard image High-resolution imageOur estimate of technical potential capacity factors begins with observations and then adds the following layers of assumptions:
- 1.all existing wind farms were in sites that are in the top 25% of province- or state-wide best available sites in terms of wind resources8;
- 2.developers adopted wind turbines at the technology frontier with a state-of-the-art hub height9;
- 3.projects were operated efficiently with the least possible downtime; and
- 4.there was no curtailment nor delays in connecting completed wind projects to the grid10.
4. Capacity factors of Chinese wind farms: 2006–2013
The average capacity factor of Chinese wind farms installed between 2006–2013, if calculated based on reported annual electricity generation and end-of-year installed capacity, is 14.4%. Over this period, there has been a slight upward trend from 12.9% in 2006 to 16.8% in 2013 (figure 2). However, this average capacity factor, which is often cited in the literature (Yang et al 2012, Li 2010, Williams and Kahrl 2008), does not take into account the fact that new installations are installed continuously over the course of a year and are therefore available for power generation for only a portion of the year. We calculate that the corrected capacity factor for the period 2006–2013, accounting for the commissioning dates of wind farms, is 18.2%, 26% higher than the un-corrected figure. In the early portion of this period (2006–2009), when wind capacity doubled every year and most installations came online during the later months of the year, this correction is very significant: e.g. reported 2007 capacity factors require a 90% upward correction. Importantly, with this installation date correction, the apparent upward trend of average capacity factors in the reported data is reversed: while uncorrected figures indicate an improvement in capacity factors, we find that actual capacity factors decreased from 20.9% in 2006 to 19.5% in 2013. The correction for installation-date falls sharply over time because new capacity additions represent an increasingly smaller share of cumulative capacity. The slight downward trend in actual capacity factors suggests that despite significant government and industry efforts, average wind farm performance in China has not measurably improved between 2006 and 2013. Figure 2 shows reported capacity factors and actual capacity factors that account for mid-year installations.
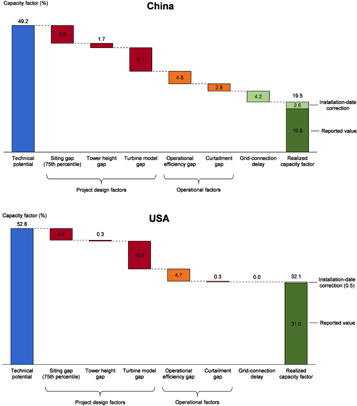
Figure 3. Breakdown of the generation shortfall between reported values and technical potential in China and the United States from their installed capacities in 2013, displayed as percentage points of lost capacity factor.
Download figure:
Standard image High-resolution image
5. The shortfall from technical potential
Our estimates suggest that over the period 2006–2013, the fleet of Chinese wind farms produced only 36.8%–45.0% of their total annual technical generation potential. Expressed in terms of capacity factors, actual average capacity factors for 2006–2013 range from 16.6%–20.9% and are significantly lower than what would have been technically achievable, 44.2%–49.2%. Expressed in terms of total generation, China's installed base of wind farms produced 410.6 TWh of power from 2006–2013 but could have produced a total of 1345.0 TWh over this period if farms had been installed and operated at maximum technical efficiency. Here we discuss country-level drivers of the shortfall in generation. Prospects for wind energy in China have significant regional variation (He and Kammen 2014) and province-level differences in each of the gaps are discussed in section SM.7.
We find that factors related to project design rather than wind farm operation, are the most important drivers of the shortfall of actual generation from technically achievable levels (figure 3 top). In 2013, the three project design gaps together contribute to an aggregate shortfall in capacity factor of 17.8 percentage points, with 6.9 percentage points attributed to suboptimal site selection, 1.7 percentage points attributed to tower height design, and 9.1 percentage points attributed to turbine model choice. These project design gaps contribute 60% (23%, 6%, and 31%, respectively), to the total gap between technical potential and actual generation that year (figure 3 top). Factors relating to the uptake of wind electricity by the grid—grid connection delays and curtailment—were responsible for 4.2 percentage points and 2.8 percentage points of lost capacity factor, respectively (14% and 10% of the total gap). The shortfall attributable to other operational inefficiencies was responsible for a 4.8 percentage point decrease in the average capacity factor in 2013 (16% of the total gap).
Over time, there are only modest relative changes to each of the driving factors of the gap between technical potential and actual generation (figure 2). These trends indicate that the impact of the changing policies and economics for wind plant installation and construction have not induced meaningful changes in aggregate performance outcomes. Grid-connection delays decrease only slightly in absolute terms despite the fact that new installations make up an ever-decreasing share of the total. This is because the average time to connect a wind farm to the grid, estimated here based on the difference between installed and grid-connected generation capacity in government reports, has significantly outpaced the rate of new capacity additions, increasing from an average of 31 days in 2006 to over 365 days in 2013. Curtailment rates first increased from a (reported) 0% of potential generation in 2006 to a maximum of 7% in 2012, before declining to 4% in 2013; however, there is substantial variation across provinces (see section SM.7). Further, more recent data indicates an upward trend in curtailment in the years after our study period (NEA 2017). The project design factors (siting, turbine choice, and tower height) are roughly constant in aggregate, with a slight decrease in the gap attributable to turbine model choice (indicating improved selection of technically efficient turbines) and a slight increase in the gap attributable to site selection (indicating that sites selected in later years have had marginally worse wind resources).
6. China's wind generation shortfall in comparison to the US
The United States provides a useful benchmark for the Chinese wind sector's performance. While the US and Chinese contexts vary in many important ways, the US system still provides empirical performance benchmarks for what may be feasible in countries with different political and economic incentives and infrastructure systems. Comparing differences in performance between the US and Chinese systems may provide practicable insight beyond the quantification of the gaps in section 5 and identification for priorities to bring the performance of the Chinese wind sector to the benchmarks used in the technical potential studies reviewed in section SM.1. Figure 3 shows the breakdown of the shortfall in wind power generation in the United States and China in 2013 relative to their technical potentials. The United States produced 60.7% of its technical potential capacity factor in 2013, while China produced 39.6% of its technical potential capacity factor. (Over the period 2006–2013, the range for this figure in the United States was 53.7%–60.7%, and in China, the range was 36.6%–45.0%.). Turbine model selection is the largest cumulative gap in both countries; a reduction of 9.1 percentage points of capacity factor can be attributed to suboptimal turbine model selection in China whereas this figure is 10.8 percentage points in the United States. (As we discuss in the next section and in SM.6., an analysis of the gaps by year, as opposed to cumulatively, shows that a greater fraction of the US turbine model gap is attributable to the US fleet being older.) Siting also plays an important role in both countries, but is a more important driver in China (6.9 percentage points of capacity factor lost in China compared to 4.6 percentage points in the United States). Lost generation from grid connection delays and curtailment are the largest differences between the two countries, attributable for, respectively, 4.2 and 2.5 more percentage points of lost capacity factor in China. In absolute terms, the United States produced more power from its wind fleet in 2013 (167.8 TWh) despite a much smaller technical potential (285.9 TWh) relative to China (134.9 TWh of a potential 338.0 TWh).
7. Discussion: policy responses
Despite increasing awareness of the underperformance of the Chinese wind sector (Liu 2015, The Economist 2015, Bloomberg News 2016, Lu et al 2016), we show that the Chinese wind sector's overall performance has not improved in a measurable way relative to its technical potential or international benchmarks. Our analysis and interviews with experts in the Chinese wind industry suggest two possible explanations for this underperformance, highlighting key areas for future empirical research. First, policy efforts by the Chinese government to grow the wind sector over the past ten years have focused primarily on creating incentives to install new wind turbines (rather than incentivize generation), leading to project design decisions (namely site selection, turbine model selection, and hub height) to be insufficiently valued and evaluated. Second, recent efforts by the Chinese government to increase capacity factors have primarily focused on factors related to the uptake of wind electricity, especially improving grid integration and grid management. Reducing curtailment and grid-connection delays will be critical to improve the performance of existing turbines and are a major point of departure between the United States and Chinese wind sectors. However, our results suggest that these measures will have to be complemented by policies to address turbine siting and technology choices to increase the sector's performance relative to the levels seen in developed countries.
Gaps related to decisions about turbine siting and technology choices (turbine model and hub height) have received much less attention in the literature and in policy debates than grid connection delays and curtailment (e.g. Liu 2015, The Economist 2015, GWEC 2016). Unlike the factors related to the uptake of electricity from wind, turbine siting and technology choices are the decisions made in the design stage of new wind projects. Therefore, as the Chinese wind sector has rapidly increased capacity installations, suboptimal site selection and turbine selection has created inefficiencies that are locked-in for the lifetime of new wind farms, typically 20 or more years. The comparison with the United States suggests that China has a larger shortfall in siting and has not managed to improve turbine model choices over time in the same way as the United States has (see section SM.6). Taken together, these findings imply that besides improving grid connection and reducing curtailment, in order to avoid locking in further inefficiencies in the sector, more attention needs to be paid to addressing the incentives and constraints affecting farm siting and technology choice. Here we turn to specific measures that could reduce siting and turbine-selection-related inefficiencies.
Siting choices for new wind farms in China are driven by trade-offs between land availability and prices (developers are required to lease land for wind farms from local governments), wind resource quality (and the availability of such knowledge), proximity of the site to the electric grid and service roads (this affects prospects for timely grid connection), and the level of available feed-in tariffs to guarantee revenue. The many factors that affect site selection can lead to development in sites with poorer wind resources, particularly in provinces with limited infrastructure. Further, there is limited information about wind resource quality in many prospective sites. Comprehensive, multi-year wind measurements prior to project development are uncommon in China. Neither the provincial governments who approve new wind projects nor the state-owned banks who provide loans regularly require detailed evaluation of a prospective site's wind resources. Instead, because of incentives that have historically incentivized wind capacity development over actual generation, developers often rely on short-term wind measurements or measurements of nearby weather stations, and thus often do not collect reliable information about the quality of the wind resource in their proposed sites.
The wind farm siting gap could be reduced by increasing access to multi-year wind measurements in specific locations. Such assessments could also be required or otherwise incentivized. For example, state-owned banks could require detailed wind resource assessments before tendering project finance loans, as is common practice for commercial and public banks that finance wind projects in Europe and the United States. Developers and provincial-level policy makers should consider the procedures of obtaining land leases at the provincial level so that sites with higher wind quality are favored for the construction of new wind farms.
A project developer's turbine model choice, in principle, is primarily a trade-off between a turbine model's cost and performance. Following the 2009 abolishment of local content requirements that gave preference to domestic turbines, there are few existing formal incentives to select economically suboptimal turbines. However, trends in the turbine model gap (figure SM.2), interviews with practitioners, and other observations from the literature suggest that wind project developers may sometimes respond to non-economic incentives and dynamic considerations that lead to apparent suboptimal decisions. For example, developers and turbine manufacturers commonly have long-term personal relationships and may even operate under the same parent company (Gosens and Lu 2014, Lin and Purra 2012, Tang and Popp 2016). These formal and informal relationships distort what could otherwise be a more market-driven choice and helps explain part of the turbine model gap found in the Chinese system. However, the turbine model gap is also a large factor in explaining the gap between technical and actual capacity factors in the US wind system where turbine model choices are made under more competitive economic conditions. Yet the drivers of the turbine model gap in the United States and China may be somewhat different. While wind capacity has been growing rapidly in both countries, the growth rate has been higher in China, and as such, wind farms in the United States are relatively older than China. Weighted by capacity, as of 2013, turbines in the US wind system were 5.7 years old, compared to 3.6 years in China. Therefore, as our data shows, in the US system, the turbine model gap is partly attributable to older, smaller turbines continuing to operate. Older turbines have locked in some degree of inefficiency in the US wind sector simply due to less efficient technologies being available at the time of installation. The Chinese turbine model gap is likely to be influenced to a greater extent by non-economic considerations, such as preferential treatment for domestic manufacturers, some of which are not subject to international quality standards. While newly installed turbines in China were actually more efficient than newly installed US turbines from 2008–2011, the most recent three years of data (2011–2013), show that the turbine efficiency gap has been increasing, rather than decreasing, in China, while it has decreased in the US. See section SM.6 for a more detailed discussion.
Several measures could help reduce the Chinese wind turbine gap. First, improving wind resource characterization at proposed sites, as described above, could provide useful information for improving the selection of appropriate turbine models that match specific site conditions. Second, more transparency about turbine model performance could enhance competition for turbine model selection, so the government could require mandatory publication of performance data of wind farms that benefit from government incentives. Lastly, government support for wind turbine R&D and other measures to build technology absorptive capacity could also contribute to advancing technology transfer and reduce the turbine selection gap as well as the operational efficiency gap.
8. Conclusion
The Chinese government is likely to support a continued, rapid expansion of the country's wind sector. A recent government study projected that China could install wind turbines with a total capacity of 2400 GW, capable of generating 5350 TWh of electricity per year (or 35% of total generation) by 2050 (ERI and Energy Foundation 2015). However, if the Chinese wind sector produces energy from these turbines at historical average capacity factors rather than assumed capacity factors, the wind sector would produce 1605 TWh per year less electricity than forecasted. The implications of China's shortfall in wind power generation are significant for China's progress toward reduced local air pollution and CO2 emissions goals and the cost-effectiveness of meeting these goals with wind energy.
This work quantifies the different sources of the underperformance of the Chinese wind sector and identifies potential avenues to improve productivity by using a common framework to analyze the US wind sector as an international benchmark. Our findings underscore that reducing curtailment and grid-connection delays, two drivers of underperformance that have been a focus of the literature, are critical to improve the efficiency (capacity factor) of the current installed fleet of turbines. However, our findings also point towards additional areas for improvement that have not received as much attention in the literature and in policy debates and that have already locked-in inefficiencies for the next two decades: suboptimal siting and technology choices (turbine model and tower height). As wind power continues to expand, avoiding such lock-in in project design in the future will be a key factor in determining whether China is able to achieve the high capacity factors assumed in existing economic forecasts and, perhaps more importantly, whether China's path to a low-carbon future can be achieved cost-effectively. The analysis we conduct here may serve as a blueprint for developing similar insights and policy recommendations for other energy technologies and in other countries currently working on designing policies to cost-effectively accelerate the pace of low-carbon energy technology deployment.
Acknowledgements
Dr. Huenteler contributed to this article in his personal capacity. The views expressed are his own and do not necessarily represent the views of the World Bank, its executive directors, or the countries they represent.
The authors wish to thank two anonymous referees for useful comments on a previous version of this paper. They also thank Charlie Wise and Vaisala/3TIER for assistance with the management of wind speed data. Karl Aspelund provided excellent research assistance. This work was supported by four research institutions at Harvard University: the Harvard Environmental Economics Program, the Energy Technology Innovation Policy research group, the Science, Technology, and Public Policy Program, and the Sustainability Science Program.
Footnotes
- 6
For the bulk of our paper, we analyze technical potential in terms of capacity factors. This reflects our focus on operational performance (i.e. how more energy can be generated from the existing fleet) rather than the focus of previous analysis, which has been focused on both deployment potential and generation potential.
- 7
Most prior studies calculate the reported countrywide average capacity factor as the ratio of the observed annual generation to year-end installed capacity. However, this is biased because turbines are installed continuously throughout the year. We correct for this by utilizing exact commissioning dates for new installations.
- 8
The potential of wind resources at different within-province sites varies, but optimal sites may not be selected for a variety of social and technical constraints. We show the range of technical potentials for different assumptions of the mean site quality in figure 2. However, for the remainder of the paper, unless otherwise specified, we use the 75th percentile of within province/state sites as the mean site quality in defining technical potential.
- 9
We assume this to be a turbine with a power curve equivalent to a 1.5 MW Vestas turbine installed at 80 meters and recalibrate generation using hourly wind speed data.
- 10
There is no universal definition of 'technical potential,' and estimates of technical potential will vary from study to study depending on assumptions of the best technically feasible technology and deployment conditions. For the purposes of this study, we define one estimate of technical potential that we can apply equivalently to the United States and China to facilitate comparison across the countries. Our estimates of technical potential are not directly comparable to other estimates of technical potential.