

Abstract
Achieving the Paris Agreement's near-term goals (nationally determined contributions, or NDCs) and long-term temperature targets could result in pre-mature retirement, or stranding, of carbon-intensive assets before the end of their useful lifetime. We use an integrated assessment model to quantify the implications of the Paris Agreement for stranded assets in Latin America and the Caribbean (LAC), a developing region with the least carbon-intensive power sector in the world. We find that meeting the Paris goals results in stranding of $37–90 billion and investment of $1.9–2.6 trillion worth of power sector capital (2021–2050) across a range of future scenarios. Strengthening the NDCs could reduce stranding costs by 27%–40%. Additionally, while politically shielding power plants from pre-mature retirement or increasing the role of other sectors (e.g. land-use) could also reduce power sector stranding, such actions could make mitigation more expensive and negatively impact society. For example, we find that avoiding stranded assets in the power sector increases food prices 13%, suggesting implications for food security in LAC. Our analysis demonstrates that climate goals are relevant for investment decisions even in developing countries with low emissions.
Export citation and abstract BibTeX RIS

Original content from this work may be used under the terms of the Creative Commons Attribution 3.0 licence. Any further distribution of this work must maintain attribution to the author(s) and the title of the work, journal citation and DOI.
1. Introduction
The Paris Agreement uses nationally determined contributions (NDCs) as the near-term foundation for achieving its long-term goal of limiting the increase in global mean temperature to 'well below 2 °C above pre-industrial levels and pursuing efforts to limit the temperature increase to 1.5 °C above pre-industrial levels' [1]. NDC targets are initially defined for the period 2025 or 2030 [2] and vary greatly from country to country, reflecting countries' unique mitigation challenges and opportunities and social, economic and political circumstances.
Paris temperature targets require reaching net-zero global carbon dioxide (CO2) emissions before the end of the century [3]. Achieving these goals would require policies to shift the current methods of energy production from carbon-intensive sources to low and non-carbon-emitting sources. Such a shift could in turn result in the devaluation or retirement of carbon-intensive assets before the end of their expected lifetime, referred to as 'stranding' of assets [4–7]. The concept of stranded assets has been explored by experts in a variety of disciplines, from economics to finance to accounting and public policy [8], in contexts ranging from fossil fuel reserves to electric power to natural gas liquefaction to agriculture [9, 10]. Stranded assets, defined broadly by Caldecott et al (2013) as assets which 'suffer from unanticipated or premature write-offs, downward revaluations or [conversion] to liabilities' [9], can result a variety of physical/environmental (i.e. increasing water scarcity as a result of climate change), technological (emergence of disruptive technologies), social (shifting consumer preferences), and regulatory forces [8]. The issue of stranded assets is important because they could result in financial market instability which in turn could create macro-economic instability [11]. Stranded assets could also create political instabilities due to a rapid loss of wealth for the owners of affected capital assets, potentially resulting in lobbying and rent-seeking behavior [12].
In the context of climate change mitigation, stranded assets could manifest in various forms such as fossil-fuel resources that cannot be burned in order to maintain a long-term temperature goal or pre-mature retirement of man-made capital assets due to climate policies [13]. Previous quantitative studies of stranded assets in the context of climate change mitigation have focused on quantifying unburnable fossil fuels [14–17], quantifying 'committed' future emissions implied by current investments [18–21], and on assessing stranded power sector capital assets under global long-term mitigation scenarios with different levels of stringency of near-term mitigation policies [7, 22, 23]. Several of these studies have utilized global integrated assessment models (IAMs) to quantify the potential for future stranded assets in a manner that captures key regional and sectoral interactions and feedbacks. Such IAM studies have largely quantified stranded assets results in physical terms such as GW of stranded capacity, seldom assigning monetary values to these stranding outcomes. A number of studies have used other methods to estimate stranded assets in more specific regional and sectoral contexts (see IRENA (2017) [10]), including several studies focused on coal-fired power plants [24–31].
Stranded assets is a key issue for countries in Latin America and the Caribbean (LAC), despite the fact that the region is responsible for less than 10% of global carbon dioxide (CO2) emissions [32] and already generates more than half of its electricity from renewable sources [33, 34]. For example, a recent analysis found that the region ranks second (behind only the Middle East) in terms of total volume of unburnable oil and gas reserves [16], and fossil fuel production is a key component of many LAC economies. However, the risks associated with man-made stranded assets in LAC have been largely overlooked as few studies have attempted to assess their implications for the region or countries therein [10]; there is a clear need for tools and analyses which help decision-makers better understand the potential for stranded assets in LAC and their implications for low-carbon development strategies [35, 36]. In addition, financial institutions in LAC are not as robust as in other regions [37, 38], which can hamper countries' ability to deal with the instability created by stranded assets.
Despite its growing prominence as a topic, there has been little analytical work specifically looking at stranded assets in regional contexts [10, 39]. While global studies are helpful to provide a sense for the scale of the problem, regulatory and investment decisions are made predominately at the national and subnational level. Hence, conducting analyses with greater geographic resolution is important for making results relevant to decision-makers.
We provide analysis at the regional level, assessing the issue of stranded assets and long-term decarbonization strategies for LAC. Specifically, we address the following question: What are the implications in terms of power sector stranded assets and investment needs for LAC countries in delivering their commitments towards achieving the objectives of Paris agreement? Additionally, to make our findings more salient for decision-makers, we quantify stranded assets in monetary terms. We also provide a sensitivity analysis around several modeling assumptions, including political willingness to avoid stranded assets, technology availability, and the role of land-use in mitigation, which were identified as key uncertainties by decision-makers in LAC.
2. Methods
2.1. The global change assessment model
We use the Global Change Assessment Model (GCAM) to analyze the composition and magnitude of stranded assets in the LAC power sector. GCAM is an open-source, global IAM which captures important interactions between the global economic, energy, agriculture, and land-use systems [40–43] (supplementary figure 1 is available online at stacks.iop.org/ERL/15/044026/mmedia). Dynamic-recursive models of each system are linked through markets and paired with a reduced-form atmosphere-carbon-cycle-climate model called Hector [44].
GCAM contains 32 geopolitical regions and operates in five-year time steps from 2010 (the last base year) to 2100. LAC is divided into seven model regions, four of which (Argentina, Brazil, Colombia, and Mexico) represent individual countries (see supplementary table 1 for a breakdown of countries contained in each GCAM LAC region). Key inputs which drive model results include socioeconomic assumptions (population, labor participation rates, and labor productivity growth rates for each geopolitical region) and representations of the physical world (resources, biophysical processes like net primary productivity), technologies, and policy. In each model period, the model solves for the equilibrium prices and quantities of various energy, agricultural, and greenhouse gas (GHG) markets at either the global or regional level. GCAM tracks emissions of 24 GHGs and air pollutants endogenously based on activity in the energy, agriculture, and land-use systems (supplementary note 1). The model tracks electricity generation by technology vintage (supplementary note 2), which allows the quantification of stranded assets in monetary terms.
2.2. Scenarios
We explore four global GHG mitigation scenarios to assess the implications of the Paris Agreement on stranded assets in LAC (table 1). These scenarios vary in terms of near-term and long-term mitigation stringency. To represent the Paris Agreement's long-term temperature goals, we constrain the cumulative CO2 emissions budgets over the century (2011–2100) to levels that are consistent with limiting mean global surface temperature increase to 2 °C (1000 GtCO2) or 1.5 °C (400 GtCO2) [45]. Country-level NDCs are aggregated to the GCAM region level in a manner consistent with previous studies [46] (supplementary note 3; supplementary table 2). Our representation of the NDCs assumes economy-wide mitigation, implemented through a carbon price. Real-world measures will differ from this approach. Regardless, our results are meant to be illustrative and our idealized implementation is sufficient to illustrate the key points raised in this paper. In the long-term, the regional allocation of emissions within the emissions budget is based on global least-cost mitigation and can vary across scenarios.
Table 1. Scenario design.
| Scenario | 2016–2020 | 2021–2030 | Beyond 2030 |
|---|---|---|---|
| NDCs-to-2 °C | Copenhagen | NDCs | Global cumulative CO2 emissions budget (2011–2100) of 1000 GtCO2 |
| NDCs-to-1.5 °C | Copenhagen | NDCs | Global cumulative CO2 emissions budget (2011–2100) of 400 GtCO2 |
| Straight-to-2 °C | Copenhagen | Global cumulative CO2 emissions budget (2011–2100) of 1000 GtCO2 | |
| Straight-to-1.5 °C | Copenhagen | Global cumulative CO2 emissions budget (2011–2100) of 400 GtCO2 | |
In the Straight-to-2 °C and Straight-to-1.5 °C scenarios, countries are assumed to achieve their Copenhagen pledges [46] through 2020 before pursuing least-cost mitigation efforts (as implemented by a global carbon price) starting from 2021 to meet the emissions budgets. In contrast, in the NDCs-to-2 °C and the NDCs-to-1.5 °C scenarios, the same emissions budgets are assumed to be achieved while countries mitigate according to their NDCs until 2030, after which global least-cost mitigation is employed. Since it has been demonstrated that the NDCs collectively produce higher emissions than global least-cost mitigation pathways [47, 48], the Straight-to scenarios provide more flexibility to act earlier in decarbonizing the economy and minimize overall financial implications [6].
2.3. Estimation of monetary value of stranded assets
GCAM tracks electricity generation by technology vintage. Generation in a vintage's initial year of operation represents full utilization and the generation for a vintage can never exceed full utilization. If a technology cannot cover its operating costs, it is retired before the end of its lifetime. We employ a logistical method to retire power production capacity when variable costs approach the price received for power. An s-curve function defines the fraction of power plants which must retire when the variable cost of operation exceeds the market price of electricity (supplementary note 2). These retirements are tracked as a reduction of the vintage's generation capacity.
Our estimate of the value of retired production capacity is based on the original investment to bring the capacity on line and its expected physical lifetime at the time of installation, as well as the fraction of the vintage retired. The cost to bring the vintage of capital on line is the original overnight capital cost (supplementary table 3). The financial value of installed capacity is assumed to decline linearly with time from its initial overnight capital cost. That is, the economic value of the capital stock in subsequent years is the original capital cost times the fraction of the capital stock's foregone useful life (supplementary figure 2). In other words, the foregone value of a prematurely retired power plant is calculated as the total capital cost of the asset times the fraction of expected (physical) lifetime (supplementary table 4) foregone due to premature retirement. This can be expressed as:
SV = OCC * ((EL − AL)/EL), where:
SV = stranded value,
OCC = overnight capital costs,
EL = expected lifetime, and
AL = actual lifetime.
Our methodology extends the one developed by Johnson et al [23] by applying asset depreciation.
3. Results
3.1. CO2 emission pathways
Energy and industry CO2 emissions continue to rise until 2030 in the NDCs-to-2 °C and NDCs-to-1.5 °C scenarios, both globally and in LAC (figure 1). Globally, emissions in the NDCs scenarios are 17% and 77% higher than the Straight-to-2 °C and Straight-to-1.5 °C scenarios in 2030; in LAC, this emissions gap is 18% and 62%, respectively (see supplementary note 4 for a discussion of LAC Emissions Pathways). These pathways are consistent with previous findings that there is a substantial gap globally between the NDC pledges and least-cost emissions pathways [47–49]. The higher near-term emissions in the NDCs scenarios entail steeper reductions beyond 2030, since the NDCs and the Straight-to scenarios are constructed to achieve the same emissions budget over the century. The near-term trend and emissions gap are similar in the power sector, which fully decarbonizes by 2050 in each mitigation scenario (see supplementary figure 4 for information on the LAC power sector in the Reference scenario).
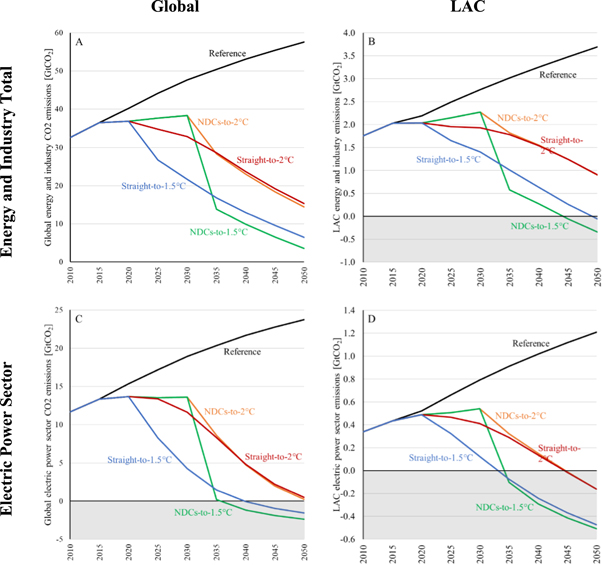
Figure 1. Global (A) and Latin America and Caribbean (B) CO2 emissions from energy and industry across all model scenarios. Global (C) and Latin America and Caribbean (D) electric power sector CO2 emissions across all model scenarios. Negative emissions come from bioenergy with carbon capture and sequestration (BECCS; see supplementary note 5). Scenarios in which BECCS is unavailable are explored in section 4: Sensitivity analysis.
Download figure:
Standard image High-resolution imageIt is notable that LAC reaches net-negative energy and industry CO2 emissions by 2050 in both of the 1.5 °C scenarios, while global emissions in those scenarios remain positive through mid-century. This result is influenced by the use of a uniform global carbon price to achieve the cumulative emissions budget. Under such a regime, emission-reduction efforts are directed toward lowest cost, irrespective of the source of emissions. Since LAC's energy system is presently less carbon-intensive than the average for the rest of the world, it is able to reach net-zero emissions more quickly than regions which have more carbon-intensive infrastructure already locked in place. Negative emissions come from bioenergy with carbon capture and sequestration (BECCS); because LAC has a higher share of bioenergy in primary energy consumption than the rest of the world of the world historically, it tends to deploy BECCS more quickly at a given carbon price in our modeling framework. However, the potential for large-scale BECCS deployment is highly uncertain for a variety of reasons [50]; the sensitivity analysis in section 3.4 includes scenarios in which CCS (and therefore BECCS) is unavailable. (For further discussion on LAC emissions pathways and the role of BECCS, see supplementary notes 4 and 5.)
3.2. Stranded assets and investments in the LAC power sector
The four mitigation scenarios are characterized by a major transformation of the energy system by 2050 (supplementary figure 3), including increased energy efficiency and conservation, a transition from emitting fossil-fuel technologies (such as oil and gas power and petroleum based transportation) to low- and non-carbon emitting technologies (including renewable electricity, carbon capture and sequestration, and liquid biofuels), and a shift in the type of investments throughout the energy system.
Here, we focus on stranded assets and investments in the power sector, an important sector in the context of climate change mitigation [4], as a conservative measure of the scale and value of stranded assets in LAC. Across the mitigation scenarios explored in this study, between 60 GW (Straight-to-2 °C) and 128 GW (NDCs-to-1.5 °C) of fossil-fuel power plants are prematurely retired before the end of their physical lifetimes in the LAC power sector from 2021 to 2050 (figure 2; supplementary table 5). These amounts are equivalent to 15%–33% of the total installed capacity in 2015 in LAC (approximately 393 GW) [51]. Since the NDCs-to-1.5 °C scenario requires the fastest reductions in CO2 emissions, the magnitude of stranded assets in that scenario is also greatest, resulting in nearly 50% more stranding than the Straight-to-1.5 °C scenario and more than double the stranded capacity observed in the Straight-to-2 °C scenario. Most of this stranding occurs between 2031 and 2035, when LAC energy and industry emissions are reduced by nearly 75%. Over 80 GW of capacity is prematurely retired over this five-year period.
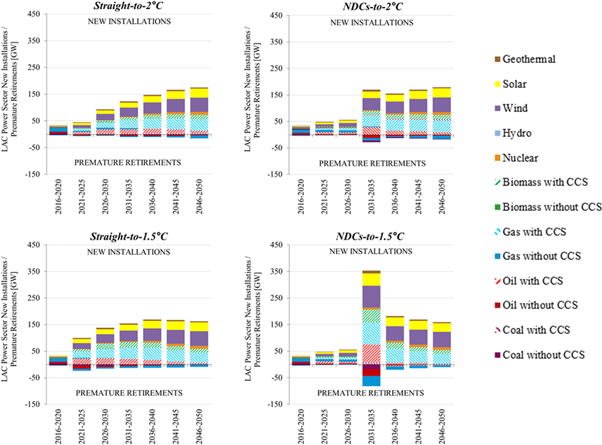
Figure 2. New Installations and Premature Retirements (negative investment values) by Scenario, Period, and Technology in the LAC Power Sector. Bars represent cumulative additions/retirements over a five-year model period. See supplementary figure 5 for country-level results.
Download figure:
Standard image High-resolution imageNatural gas and oil power plants without carbon capture and sequestration storage (CCS) represent the largest fraction of prematurely retired capacity in our scenarios in LAC. In our scenarios, natural gas without CCS accounts for about 45% of stranded capacity in the NDCs-to-2 °C scenario and about 54% of stranded capacity in the NDCs-to-1.5 °C scenario, calling to question natural gas's role as a 'bridge fuel' [52]. To meet the growing demand for electricity, between 751 and 967 GW of new capacity are installed during the 30 year period from 2021 to 2050 (figure 2). These capacity additions are roughly 1.9–2.5 times the total electricity generation capacity in LAC in 2015 [51, 53]. As anticipated, scenarios with the 1.5 °C cumulative emissions budget require more capacity additions than the 2 °C scenarios. This is because achieving the more stringent budget in the 1.5 °C scenarios requires the electricity sector to both (1) decarbonize faster by replacing carbon-intensive plants with new low-carbon capacity and (2) produce more electricity overall, so that end-use sectors can reduce emissions by switching their energy use to electricity.
Similarly, the NDCs scenarios require more new installations overall than the Straight-To scenarios, although the timing of these installations is delayed. Greater near-term mitigation spreads the new installation requirements more evenly across time; low-carbon power installations in the near-term both lower near-term emissions and reduce the rate at which emissions must be curtailed post-2030 (figure 1), limiting the need for greater investments post-2030 to 'catch up' with the cumulative emissions budget [54].
3.3. Stranded capacity and investment costs
An assessment of the costs associated with these premature retirements and new installations helps illuminate the economic implications of climate change mitigation. Scale is the primary driver of investment costs, with each scenario averaging about $2.5–2.7 billion per GW of new generation capacity (figure 3). Investment costs for the Straight-to-2 °C scenario are the lowest ($1.9 trillion across LAC between 2021 and 2050; see supplementary table 6), while those for the NDCs-to-1.5 °C scenario are the highest (nearly $2.6 trillion). These results are consistent with the insights from figures 1 and 2—while the NDCs are insufficient to limit warming to 2 °C, they imply even more challenges for limiting warming to 1.5 °C [7]. Overall, investment requirements in the NDCs-to-1.5 °C scenario represent about 0.8% of LAC's projected (exogenously specified) GDP from 2021 to 2050, and reach as high as 2.1% of GDP for the 2031–2035 period.
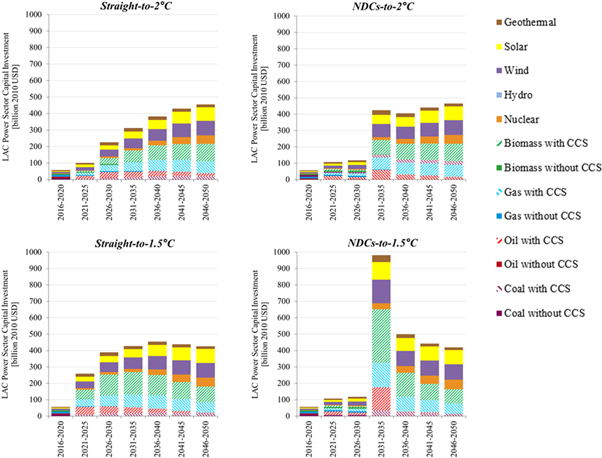
Figure 3. LAC Power Sector Capital Investment by Scenario, Period, and Technology. Bars represent cumulative costs over a five-year model period.
Download figure:
Standard image High-resolution imageSimilarly, the costs of stranded capacity (hereafter referred to as 'stranding costs'; see methods) are highest in the NDCs-to-1.5 °C scenario, with cumulative costs of $90 billion between 2021 and 2050 (figure 4). These costs are two-thirds higher than the Straight-to-1.5 °C scenario and more than double the costs in the Straight-to-2 °C scenario. In contrast, the difference in stranding costs between the Straight-to-2 °C and NDCs-to-2 °C scenarios is about 37% ($13 billion USD) over the course of 30 years. For the 1.5 °C scenarios in particular, the timing of asset stranding is driven by their vastly different emissions pathways (figure 1). While the Straight-to-1.5 °C scenario requires more mitigation in the near-term, the NDCs-to-1.5 °C scenario requires a rapid decline in emissions post-2030. This in turn results in much more dramatic stranding of assets in the NDCs-to-1.5 °C scenario compared to the Straight-to-1.5 °C scenario. In other words, the value of strengthening near-term ambition is even greater for a 1.5 °C temperature target [10].
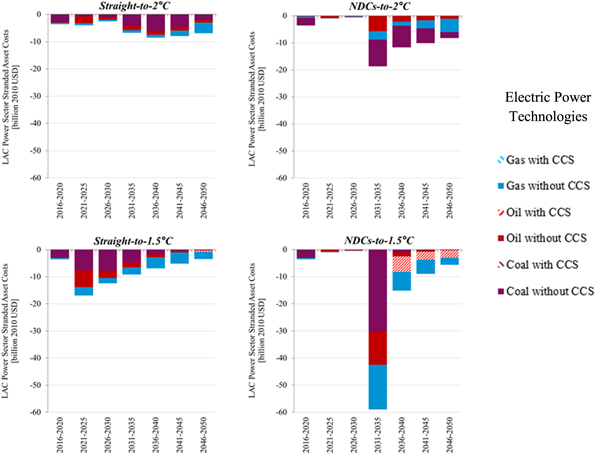
Figure 4. LAC Power Sector Stranded Asset Costs by Scenario, Period, and Technology. Bars represent cumulative costs over a five-year model period.
Download figure:
Standard image High-resolution imageAn interesting result from our analysis is that the cost of stranding coal technologies is the greatest across scenarios, even though these technologies make up a relatively small percentage of the total capacity stranded (figures 4, 2). This is because (1) coal power plants are more capital intensive than gas and oil plants, and (2) coal power plants are assumed to have longer lifetimes (60 years) than gas and oil plants (45 years) and hence the economic value of coal power plants depreciates slower than gas and oil plants. In addition, oil with CCS plants contribute significantly to stranding costs for the 1.5 °C scenarios between 2041 and 2050 because not only are these plants capital intensive, but they are also relatively new. Hence, although a small amount of capacity is retired, the plants have comparably large economic value when their operations cease.
3.4. Sensitivity analysis
To assess the extent to which our estimates of power sector investment and stranding costs are influenced by key modeling parameters, we conduct a sensitivity analysis on assumptions about (1) political willingness to avoid stranded assets, (2) technology availability, and (3) the role of land-use change (LUC) in mitigation (table 2). In total, all combinations of these assumptions result in 36 sensitivity cases (18 cases per temperature target).
Table 2. Sensitivity scenarios considered in this study. See supplementary table 7 for details about implementation in GCAM.
| Sensitivity parameter | Sensitivity scenario | Description | Regional application |
|---|---|---|---|
| Political willingness to avoid stranded assetsa | Mid Avoidance | Assumes medium premature asset retirement in the power sector in response to changing profit margins for utilities (Central Assumption). | Global |
| High Avoidance | Assumes low premature asset retirement in the power sector in response to changing profit margins for utilities. | Global | |
| Technology availability | Full Tech | Assumes that the full suite of power sector technologies is available globally (Central Assumption). | Global |
| No CCS | Assumes no deployment of carbon capture and storage technologies. | Global | |
| No CCS and No New Nuclear | Assumes no deployment of carbon capture and storage technologies globally, and no new deployment of nuclear technologies in LAC. | No CCS global; no new nuclear in LAC only | |
| Role of land-use in mitigation | Low LUC | Assumes low mitigation in the land-use sector through lower price signal on emissions from land-use and land cover change. | Global |
| Mid LUC | Assumes medium mitigation in the land-use sector through medium price signal on emissions from land-use and land cover change (Central Assumption). | Global | |
| High LUC | Assumes high mitigation in the land-use sector through high price signal on emissions from land-use and land cover change. | Global |
aVery high stranding avoidance assumptions (no stranding allowed in the power sector) was found to be infeasible within the GCAM modeling paradigm.
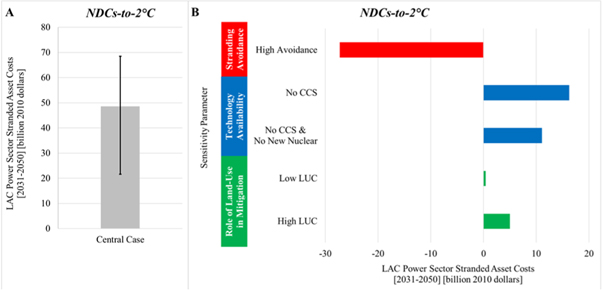
Different sensitivity cases result in different investment and stranding outcomes (figure 5, supplementary figure 6) and CO2 emissions pathways (supplementary figure 7). For example, increased political willingness to avoid stranded assets reduces power sector stranded asset costs by 27 billion USD over the twenty-year period from 2031 to 2050 (NDCs-to-2 °C), holding all other parameters at their central assumption values (figure 5). However, increased stranding avoidance in the power sector shifts emissions mitigation to other sectors such as refining (supplementary figure 8) and requires higher carbon prices (17% in 2050) to achieve emissions mitigation goals (supplementary table 8). This heightened refining sector mitigation in turn requires a significant increase in biofuels, intensifying the competition for cropland and raising food prices (by 9% in 2050; see supplementary table 9). Although conducting a detailed evaluation of the implications of food price increases for consumers is beyond the scope of this study, our results suggest that avoiding stranding in the energy sector could have important implications for other sustainable development priorities.
Figure 5. Sensitivity of LAC power sector stranded asset costs to changes in key parameters. (A) Bar represents cumulative stranded asset costs for the central NDCs-to-2°C case (2031–2050). Error bars represent the range of cumulative stranded asset costs over the same period across every NDCs-to-2 °C case (n = 18). (B) Tornado diagram of stranded asset cost sensitivity to changes in key parameters. Bars represent the change in cumulative stranded asset costs (2031–2050) associated with moving from the central case assumptions (Mid Avoidance, Full Tech, Mid LUC) to the corresponding sensitivity assumption, holding all other parameters at their central case values.
Download figure:
Standard image High-resolution image
Additionally, our analysis suggests that the NDCs-to-1.5 °C scenarios are not feasible in cases with limited technology availability, in particular, without CCS technologies (supplementary figure 6). This is because, by the time the current NDCs are implemented in 2030, cumulative global CO2 emissions are already 300 GtCO2 higher than the century-wide 1.5 °C budget (supplementary figure 7). Without CCS and hence CO2 removal from bioenergy with carbon capture and sequestration (BECCS; supplementary note 5), the level of net-negative emissions needed in the second half of the century to bring cumulative global CO2 emissions back below the 1.5 °C budget by 2100 is simply not feasible in the GCAM modeling paradigm. While this finding about the importance of CCS for 1.5 °C scenarios is consistent with recent studies [55, 56], it is also important to note that all of the feasible NDCs-to-1.5 °C scenarios in this study imply a temporary overshoot of the 1.5 °C temperature target, since the emissions budget is always exceeded before being met by the end-of-century.
While limited technology availability renders the NDCs-to-1.5 °C scenarios infeasible within our modeling paradigm, the NDCs-to-2 °C scenarios were found to be feasible, albeit at higher costs. Reducing technology availability from Full Tech to No CCS increases power sector stranded asset costs (2031–2050) by $16 billion (figure 5). Despite these higher stranding costs, power sector CO2 emissions remain higher in the No CCS sensitivity cases compared to their Full Tech counterparts. Further, with CCS unavailable, power sector mitigation cannot be easily displaced to the refining sector. Instead, additional mitigation effort in LAC is shifted from the energy system to the land system, which results in food price increases of 44% (in 2050) due to increased competition for land for afforestation [57, 58]. Mitigation that cannot be shifted to the land sector is accomplished by energy efficiency and conservation, with primary energy consumption, final energy consumption, and passenger vehicle miles traveled reduced 23%, 11%, and 7% respectively in the No CCS case compared with the Full Tech case in 2050 (supplementary figure 9, supplementary table 10).
Furthermore, while changes to the role of land-use in mitigation tend to have small average impacts on power sector stranding costs in LAC (figure 5), the range of potential impacts is fairly large (supplementary figure 10). Shifting to a high role for LUC in mitigation (High LUC) can either increase or decrease stranding costs, depending on assumptions about technology availability. Increasing the role of land-use in mitigation results in a shift towards afforestation and away from bioenergy production (supplementary figure 11). With full technology availability, this decreased availability of bioenergy feedstocks limits the role of BECCS as a mitigation strategy (supplementary figure 11) in both the refining and power sectors. While increased afforestation means that less emissions reductions are required of the energy system overall, a greater share of energy system emission reductions must come from the power sector in the High LUC mitigation cases, because refining (and end-use sectors which consume a large amount of liquid fuels) have fewer mitigation options without BECCS. More carbon-intensive power plants are forced to prematurely retire, increasing stranding costs, and more low-carbon generators are installed to compensate for these premature retirements and to electrify end-use sectors with fewer low-carbon liquid fuels available. Conversely, with limited technology availability, bioenergy is a less important mitigation strategy to begin with; increasing the role of LUC in mitigation helps shift emissions reductions away from the energy system and results in lower stranding costs.
4. Discussion
Our analysis demonstrates that although more than half of LAC's electric power is generated from renewable sources [33, 34], power sector stranded assets are an important issue in LAC. Achieving the long-term goals of the Paris Agreement could result in pre-mature retirement of power sector capital worth 37–90 billion 2010 USD over a thirty-year period, depending on the decarbonization pathway. These costs represent huge potential losses for a relatively narrow group of stakeholders and coincide with substantial new capacity investment requirements.
Our study also shows that strengthening near-term mitigation effort could have important implications for minimizing stranded asset and investment costs in LAC. Even for the 2 °C temperature target, in which LAC's NDC commitments put the region closer to its least-cost 2 °C emissions pathway, stranded asset and investment costs are reduced by 27% (13.3 billion 2010 USD) and 3% (54 billion 2010 USD) by 2050 in a scenario in which the NDCs are assumed to be strengthened to follow globally cost-effective pathways. The NDCs emissions gap, and the potential for reducing investment and stranding costs, are much greater for a 1.5 °C temperature target. These findings reinforce the findings of global analyses that near-term investment decisions will have important economic implications in the mid-to-long-term [6], even in a developing region such as LAC where power-sector emissions are currently low. Finally, our sensitivity analysis demonstrates that power sector stranding outcomes are influenced by the availability of low-carbon technologies (such as CCS), the role of other sectors in mitigation (such as land-use), and political avoidance of stranded assets. Depending on how these factors affect the role of the power sector in mitigation, they could displace mitigation effort into other sectors and negatively impact consumers.
5. Conclusions
This study highlights the value of regional analyses using integrated tools with regional, sectoral, and technological detail to inform decision-making about decarbonization and explore the implications of different policy choices. Additionally, our analysis demonstrates the need for better investment planning consistent with global climate goals. Our methodology can be adapted to other sectors and regions, for example, oil refining and gas processing infrastructure. Our study also opens several interesting avenues for future research, such as exploring the extent to which it is possible to avoid stranded assets while still achieving the Paris Agreement goals, and the interaction between early mitigation action as a strategy to reduce stranded assets with other key social, technology, and policy uncertainties. Such assessments can provide valuable quantitative information about interactions between investment decisions and climate targets, which governments can incorporate into their planning processes from an early stage.
Acknowledgments
The authors are grateful for research support provided by the Inter-American Development Bank under projects RG-T2728 and RG-K1447. The views expressed in this paper are the sole responsibility of the authors. They do not necessarily reflect the views of the Inter-American Development Bank or the countries it represents.
Data Availability
The data that support the findings of this study are openly available at https://doi.org/10.25412/iop.11900196.v1.
Contributions
MB, GI, JE, HM, and AVS designed the research. MB wrote the first draft of the paper. MB performed the model simulations. All the authors contributed to writing the paper.
Competing interests
The authors declare no competing financial interests.