

Abstract
The impacts of hazard events such as extreme rainfall, heatwaves, and droughts are substantial and represent an increasing threat over India. Effective adaptations to these hazards require an in-depth understanding of their physical and socioeconomic drivers. While hazard characteristic models have been substantially improved, compelling evidence of the spatio-temporal analysis of social vulnerability (SoV) throughout India are still lacking. Here, we provide the first analysis of the SoV to disasters at a national-scale for the past two decades using a robust data envelopment analysis framework, which eliminates subjectivity associated with indicator weighting. An interesting result is that SoV has decreased over past decade, which is primarily due to an increase in literacy rate and conversion rate of marginalized groups to main working population, and a decrease in child population due to use of birth control. Contrarily, while analyzing hydro-climatic hazards over India, we notice an increase in probability of their occurrence over significantly large portions all over India, particularly in Karnataka, Maharashtra, Odisha, North-Eastern states and Telangana. The spatial pattern of increase is surprisingly similar for all three considered hazards, viz. extreme precipitation, heatwaves, and drought. Combining the information from SoV and hazard analysis, we further estimate the risk to hydro-climatic extremes. A notable observation is the synchronized increase in hazard and risk in these regions, indicating that hazards are contributing significantly to the increasing risk and not SoV. Further analyses of mortalities induced by different hazards indicate that deaths per million on a decadal-scale have either decreased or remained constant in recent decades, which suggests that mortality is decreasing despite the increasing risk of hazards over India. This also indicates an enhanced capacity for adaptation, which can be attributed to the decadal decrease in SoV observed in the present study.
Export citation and abstract BibTeX RIS

Original content from this work may be used under the terms of the Creative Commons Attribution 3.0 licence. Any further distribution of this work must maintain attribution to the author(s) and the title of the work, journal citation and DOI.
Introduction
Extreme hydro-climatic hazard events such as extreme rainfall, droughts, and heatwaves are worryingly increasing in spatial extent, intensity, and frequency in different parts of the globe [1], leading to a corresponding rise in economic losses, and human casualties [2]. These hazards are a consequence of human-induced climate change [1] and even in the face of attempts to curb the causative human activities, this trend is expected to show an alarming upsurge in the future [3]. In addition, it is startling to note that such extreme hazards seem to be occurring not in isolation but rather in sequence or simultaneously, with less time for recovery between events [4].
Brikmann [5] noted that the degree of adverse impacts caused by natural events is not only influenced by the magnitude and intensity of the hazards but also by the level of vulnerability of the affected society. For societies that experience higher vulnerability to hazards, impacts caused by the hazards will be higher. Thus prior to disaster management planning, minimizing extreme hazard impacts on at-risk populations can only be achieved by reducing vulnerability [6]. For minimizing vulnerability in order to improve disaster management strategies at national- or regional-scales, the inescapably crucial step is to develop a set of comprehensive social vulnerability (SoV) maps that can identify the populations-of-concern across large or small areas, i.e. the vulnerable hotspots for which adaptation strategies (mostly structural/non-structural developments) can be appropriately positioned. A pioneering effort to develop an index that can measure SoV at a national-scale was made by Cutter et al [7] for the entire USA. A number of other studies have been performed to map SoVs for different countries [8–12]. Figure S1 is available online at stacks.iop.org/ERL/15/014005/mmedia provides a pictorial representation of previous efforts around the globe for the social and socioeconomic vulnerability sectors. Here we have divided the literature into two segments: (i) studies conducted between 2000 to 2010 and (ii) 2010 onwards. To differentiate between these two-time periods, we have provided two different shades of color. Figure S1 mainly shows that the majority of national-scale mapping of SoVs in developed countries were already performed during the period of 2000–2010 and is still continuing 2010 onwards with improvement in indicator selection and improved methodologies. On the other hand, majority of the work in this field has taken place only very recently in developing nations.
Studies focused on mapping nationwide social and socioeconomic vulnerability (figure S1) have typically been performed for developed or economically-rising countries such as USA [7, 13], China [11], and European nations [8, 9]. A few studies have been performed for developing [10, 12] and under-developed countries [14, 15] as well. Although accurately projecting hydro-climatic extremes over India has received considerable attention, its large population remains highly vulnerable to disasters because increasing population directly increases exposure to hydro-climatic extremes, thereby increasing its risk. It is important to add that efficacy of disaster management agencies has considerably improved over time, as can be demonstrated by comparison of two cyclone events in the Bay of Bengal over Odisha during 1999 and 2014 respectively. Though, the intensity of both cyclone events were severe, the 1999 cyclone is considered to be more destructive. Nonetheless, with better forecast, disaster preparedness together with setting up of better disaster management force, the impact of the latter event, i.e. 2014, was reduced significantly. The competence of a government to manage disasters is impeded by factors that include geographical size, population size, and rapid unplanned urbanization without appropriate road and transport infrastructure. Moreover, evidence indicates that the intensity and frequency of disasters such as precipitation extremes [16], heatwaves [17], and droughts [18] are increasing over India with increasing population. Despite many studies proving that SoV has to be a priority focus in disaster management plans, a comprehensive SoV map at national-scale has surprisingly not been attempted till date for disaster-prone India. On the other hand, O'Brien et al [19] performed the nation-wide vulnerability, however, focusing on the agricultural sector in India in the decade that began in 1991. Nonetheless, the SoV to hydro-climatic extremes, which (like agriculture) is also an important theme in climate change impact assessment, barely got any attention. Further, they have followed the definition of vulnerability as provided by McCarty et al [20] in the third assessment report (AR3) of IPCC. However, the definition got updated with the preceding reports of IPCC (see supplementary information and table S1 for detailed information on the definitions).
Thus, in the context of multiple and growing stress factors, it is only prudent that we develop a comprehensive SoV map for India. Disaster management has been a rapidly evolving discipline in India, particularly over the last decade and the National Disaster Management Act (2005) provides a mandate for development of a comprehensive disaster management plan at national, state, and district levels. However, few related studies that exist have focused on mapping SoV to disasters at only the city-level [21] or basin-level [22] in India and not on a national-scale. The nation-wide SoV mapping shall provide valuable vulnerability information that can be used by the central government policy makers, regional planners, and disaster managers to define target intervention areas based on required resolution of spatial-scales [8]. In-light of these needs and goals, we have attempted to develop a fine resolution SoV map for India that considers the SoV indicators derived from Census of India (CoI) for 2001 and 2011 in order to estimate the decadal changes in SoV. The selection of these two decades is based on consistency in data availability along with the parity in indicators and spatial scales between these two decades. We further estimate the decadal changes in hydro-climatic hazards such as extreme precipitation events, heatwaves, and droughts. These data can be further utilized to produce a comprehensive set of risk (combination of hazard and vulnerability) maps of India. The main contribution of our analysis is the final product, a set of comprehensive Risk maps, which shall help in identifying potential hotspots across the country for each hydro-climatic hazard. The National Disaster Management Authority under the Government of India (GoI) can utilize this product to improve emergency response strategies and policy guidelines as well as to gather future disaster data to fine-tune the SoV and risk maps.
Data and methods
The demographic data for mapping SoV have been procured from CoI for the decades 2001 and 2011, which basically provides decadal information on different categories of populations. The vulnerability indicators developed by CoI are standardized [23, 24] mainly to make the indicators dimensionless, which will allow us to compare the different indicators at national-scale [21]. PCA is applied to these standardized vulnerability indicators to decorrelate and reduce the dimensionality. We find that the first 5 PCs are able to explain almost 75% of the variability for both the decades, and these are fed to the data envelopment analysis (DEA) framework [25, 26] to obtain vulnerability ranking for all of India. The DEA estimates relative efficiency of the units known as DMUs [21], which is 'Districts' in this case. DEA basically optimizes each observation with the objective of calculating a discrete piecewise frontier as estimated by the set of Pareto-efficient DMUs. We implement the Banker–Charnes–Cooper model [26] in the current study considering their popularity amongst all other DEA models (refer to supplementary information for detailed DEA description). In the case of hazard mapping, the hazard data was obtained from India Meteorological Department (IMD) from 1961 to 2011. The precipitation data at 0.25o resolution [27] is employed for precipitation extreme and drought analysis, whereas the maximum temperature at 1o resolution [28] is used for hazard mapping for heatwaves (refer supplementary information for the detailed description).
Results
The demographic data required for mapping SoV for India at a national-scale are obtained from CoI for the decades 2001 (1991–2000) and 2011 (2001–2010) at the district level. Table S2 provides the SoV indicators and corresponding justifications for selecting these indicators, including relevant references from previous studies that selected the same set of indicators. The decadal changes in certain exemplary indicators are shown in figure S2. The indicators considered to have a negative impact on SoV (i.e. increase SoV) such as total population, total female population, and total and female SC-ST (under-privileged population as certified by the GoI) populations, have increased in the most recent decade, whereas the child population and marginal worker population experience a decrease in most of the districts. In addition, the indicators of literacy rate for the total and female populations and total working population, which are considered to have a beneficial impact on SoV (i.e. decrease SoV) have also increased in the most recent decade in India. These decadal changes in vulnerability indicators may provide insights into the causes of decadal changes in the SoV map.
Based on this information, we perform further analyses for SoV mapping. Initially, the indicators are standardized because the units of the indicators may be different and the indicators must be dimensionless [21] for direct comparison of their impact on SoV. The standardized indicators are then fed into the DEA framework to obtain the vulnerability index. However, prior to performing the DEA, a PCA is performed for the entire set of vulnerability indicators to reduce the dimensionality of the data and decorrelate the indicators in order to improve the ranking efficiency of the DEA [21]. Figure S3 shows the percent contribution by the selected indicators to the first five PCs. The results show that most of the individual indicators contribute more than 50% to the first five PCs in both decades, thereby demonstrating the robustness of the indicator selection. The first 5 PCs are further applied in the DEA framework, which provide the general vulnerability ranking, thus allowing us to interpret the results and categorize the spatial units within a region based on vulnerability [21]. This method has advantages over other techniques, such as simple averaging, weighted averaging, and additive models.
Figure 1(a) presents the SoV for the decade 2001 calculated via the DEA. The results show that the SoV to hazards is relatively higher in the states of Karnataka, Tamil Nadu, Maharashtra, and Madhya Pradesh, and lower in the states of Odisha and Northeastern parts of India. Similar spatial patterns are observed when SoV maps are generated based on the method proposed by Cutter and Finch [13] in which the standard deviation approach is applied to classify the vulnerability ranking (figure S4). This suggests the consistency of the proposed DEA approach implemented in the present study with Cutter and Finch [13]. Moreover, the DEA shows more conspicuous spatial variability although the standard deviation approach provides a quick representation to identify the least and most vulnerable locations over India. The vulnerability map for the census decade 2011 provides a similar spatial pattern (figure 1(b)) and the map's inset pie chart does not indicate significant changes in the distribution of the vulnerability values between census decades 2001 and 2011. However, when changes in the SoV between the two decades are considered (figure 1(c)), a significant reduction in the SoV is observed throughout India except in a few districts (24% of the total districts). This reduction in SoV for the 2011-decade may be attributed to decrease in child population, significant increase in the total and female literacy rates, and increase in the total working population (mostly the conversion of marginalized workers to main workers) in India during the recent decade (figure S2).
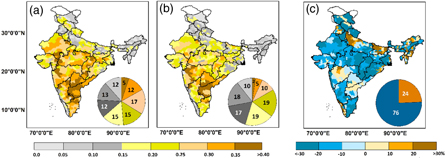
Figure 1. Social vulnerability computed through a robust data envelopment analysis (DEA) framework for the census years 2001 (a) and 2011 (b) district level demographic data, where the DEA value close to one represents the districts which are more socially vulnerable. The inset Pie charts represent the distribution of the vulnerability values. (c) shows the changes in social vulnerability between two decades. We note that almost 76% of the total districts exhibit negative changes in social vulnerability.
Download figure:
Standard image High-resolution imageTo investigate the effect of indicators on the evaluation of vulnerability, we perform a sensitivity analysis. We initially exclude the indicators that had a beneficial impact on SoV (i.e. responsible for reduction of SoV) and re-perform the analysis. Here, the SoV indicators which lead to the strongest decrease are selected based on the PCA (the indicators that had the highest percentage contribution to the first 5 PCs such as: literate population, female literate population, main working population, main working female population, household with electric facilities, good household conditions, and secondary education). Interestingly, we observe results contrasting with figure 1 in this case. It is seen that 68% of the districts have increasing SoV during the more recent decade (figure S5) when we suppressed SoV indicators which reduce SoV, as they directly or indirectly enhance adaptive capacity. This analysis indicates that improving the adaptive capacity indicators does have a significant influence on the reduction of SoV within India and also depicts that these indicators are preliminarily responsible for the reduction in SoV as is clear in figure 1(c).
Here, the vulnerability analysis is conducted at a district level. However, the Census data are also available at the tehsil level (administrative division of India at the sub-district level), which provides finer resolution demographic information. Therefore, to strengthen the district-level SoV, we also perform the vulnerability analysis at the tehsil level. Figure S6 shows the comparison between the district and tehsil level vulnerability analyses. We obtain similar results in both scenarios, wherein the SoV has been decreased significantly in the recent decade. Nonetheless, it should be noted that unlike at the tehsil level, only the first 20 indicators as provided in table S2 are available from CoI for entire India. Important indicators such as elder population, disabled population, and information pertaining to amenities are not available for all of India. Therefore, further analysis is conducted with only the district level demographic information with total 34 indicators.
Based on the vulnerability map developed for India, the decadal changes in hazards must be assessed, since overlaying these hazard maps with the SoV maps can provide complete information on the risks associated with a particular hazard. Hence, additional analyses are performed on the estimated changes in the hazards for the two studied decades. The hazards considered in our study include extreme precipitation events, heatwaves, and droughts. Figures 2(a) and (b) provide the probability of occurrence of potentially damaging hazard events for a given magnitude of extreme rainfall during the decades 1991–2000 and 2001–2010, respectively. The results show substantial changes in the probability of occurrence of extreme events between the two decades. A further analysis of the changes in the probability of occurrence of extreme events between the two decades (figure 2(c)) indicates that extreme precipitation events have increased in the most recent decade, with over 54% of the total districts showing an increase in the probability of occurrence.
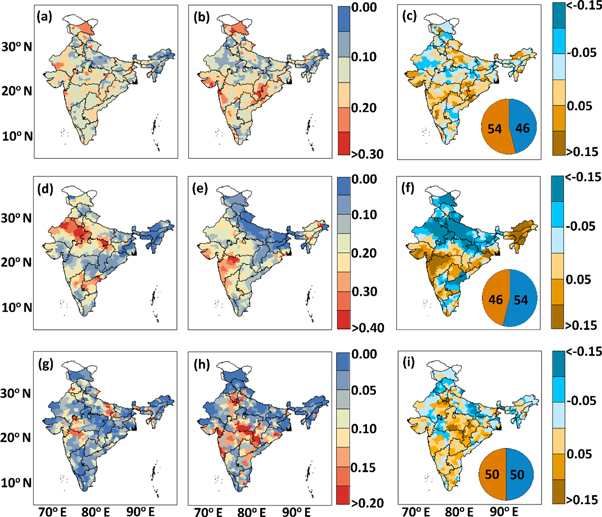
Figure 2. Probability of occurrences of potentially damaging hazard events for a given magnitude of rainfall extreme (top panel), heat wave (middle panel) and drought in terms of 3 months SPI over India for the recent two decades (bottom panel). The changes in extreme events for the respective hazards are provided on the right of each panel. The inset Pie charts indicate the percentage of total districts with positive and negative changes in the probability of occurrences.
Download figure:
Standard image High-resolution imageSimilar analyses have been performed for heatwaves (figures 2(d) and (e)) and the 3 month standardized precipitation index (SPI) to quantify the drought severity (figures 2(g) and (h)) for the two decades. Furthermore, changes in the probability of occurrences of extreme events between the two decades are analyzed for heatwaves (figure 2(f)) and droughts (figure 2(i)). Although the percentage of total districts showing an increase in the probability of occurrence is marginally less than that for extreme precipitation, spatial similarity is observed in the changes in both heatwaves and droughts with extreme precipitation. These results suggest that the probability of hazard occurrence has increased considerably in the states of Chhattisgarh (formerly a part of Madhya Pradesh), Karnataka, Maharashtra, Odisha, and Telangana (formerly a part of Andhra Pradesh), and consistent patterns are observed for all three hazards.
Based on the information from both the SoV and hazard maps, the risk throughout India is mapped by combining hazard and vulnerability maps. Here we first take the product of SoV and individual hazard to obtain the risk for both the decades and then estimate decadal change. Figure 3(a) shows the decadal change in risk for precipitation extreme. As with the changes probability of precipitation extremes (figure 2(c)), here also we notice an increase in risk dominated over the states of Chhattisgarh, Karnataka, Maharashtra, Odisha and Telangana. Similarly, we estimate the risk for heatwaves (figure 3(b)) and droughts (figure 3(c)). As with precipitation extreme risk, here also the pattern of increase is distinctively similar to the increase in respective hazards. This perhaps indicates that the risk over India is more driven by the hazards rather than the SoV. We further substantiate the results on risk by analyzing the multivariate risk maps (supplementary information). These maps help us to identify the contributor to the overall risk. Figure 4 shows for all considered hazards, the risk is majorly driven by the hazard components than that of vulnerability during the census decade 2011. To concretize this hypothesis, we further divide the risk maps into four categories: (1) decreasing vulnerability (V) and hazard (H); (2) decreasing V but increasing H; (3) increasing V and H; and (4) increasing V but decreasing H (figures 3(d)–(f)). The proposed pattern may provide guidance to decision-makers when prioritizing the action plans between V and H. For example, in higher risk regions that have increasing V and decreasing H, the governance should be directed towards reducing the SoV by improving the adaptive capacity at a local-scale. However, in higher risk regions that present increasing H and decreasing V, improving large-scale early warning/forecasting systems should be prioritized to reduce the impact caused by H. In figure 3(d), 38% of the total districts show decreases in both V and H, nearly as many districts (39%) exhibit decreasing V and increasing H trends while 8% of districts show increasing V and decreasing H, and 15% show increasing V and H for extreme precipitation events. In the case of heatwaves (figure 3(e)) and droughts (figure 3(f)), majority of the districts (36% for heatwaves and 39% for droughts) exhibit decreasing V and increasing H, which is similar to the pattern of extreme precipitation events. The spatial patterns of these maps are also remarkably similar for all of the hazards; and also, these categories show that risk is more driven by changes in hydro-climatic extremes over India, which we validated through the risk maps as well (figures 3(a)–(c)). The states of Chhattisgarh, Karnataka, Maharashtra, Odisha, and Telangana are seen to be showing increasing risk. Although the SoV has been observed to be decreasing in these regions, the increased risk is mainly caused by the increased hazards. This finding suggests that these regions are more vulnerable when increases in hazards occur, possibly in economic sectors such as agriculture as well as infrastructure facilities. Hence, in future studies, including these sectors when developing vulnerability maps will provide further insights.
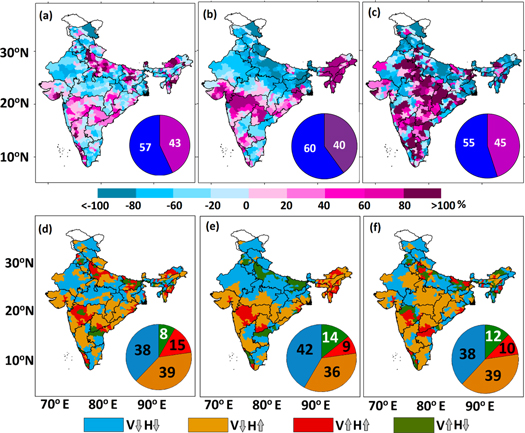
Figure 3. Decadal changes in Risk (Risk = Hazard × Vulnerability) for precipitation extreme (a), heatwaves (b) and droughts (c). Pie charts in each map indicate the % of total districts with positive and negative changes in the risk. The maps show the distributions of different categories of districts, which are provided at the bottom of the respective figures, for precipitation extreme (d), heatwaves (e) and drought (f), respectively. V indicates vulnerability and H represents the hazard in the figures. Pie charts in each map indicate the % of total districts with different categories of risks.
Download figure:
Standard image High-resolution image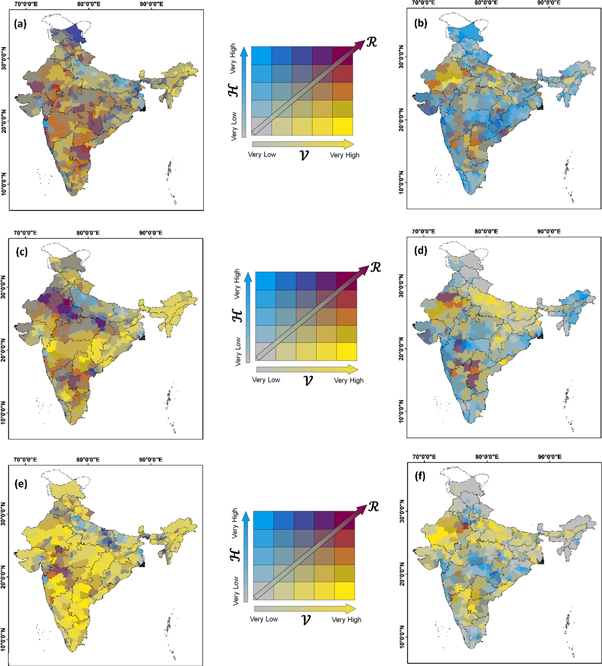
Figure 4. Bivariate risk ( ) map for the decade 2001 (a) and 2011 (b) for precipitation extreme. (c) and (d) are same as (a) and (b), but for heat waves. Similarly (e) and (f) represents the risk maps for drought. The 5 × 5 bivariate choropleth in the middle panel for each hazard shows the classification of the risk based on the hazard and vulnerability values.
Download figure:
Standard image High-resolution imageIt should be noted that we followed the definition of risk as Risk = Hazard × Vulnerability [29]. On the other hand, the IPCC Third Assessment Report, AR3 [20] described climate vulnerability as 'a function of the character, magnitude, and rate of climate variation to which a system is exposed, its sensitivity, and its adaptive capacity' [30] (see supplementary information). Considering this, we map climate vulnerability according to the definition of AR3 and validate with the risk maps as obtained from the AR5 definition. Figure S7 provides the results derived from this analysis, which shows an increase in climate vulnerability for all three types of hazards, especially in states like Maharashtra, Karnataka, Telangana, and Odisha. As can be expected, this spatial pattern of decadal change in climate vulnerability is similar to that of the decadal change in risk maps (figure 3), wherein the risk is increasing in the aforementioned states of India, further confirming the robustness of our results.
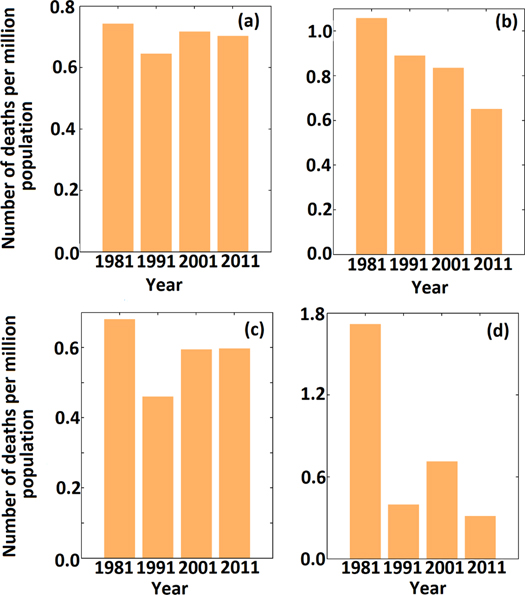
In the meantime, our results indicate that risk is increasing over certain regions of India primarily because of increases in hazards. Therefore, we analyze the mortality rate over India caused by increases in these hazards and assess how the population is managing these impacts in the context of the decade-long decrease in SoV. This analysis is performed using mortality data for different natural hazards obtained from the National Crime Records Bureau (NCRB), GoI, for the period from 1971 to 2013. Figure 5 shows the number of deaths within a population of one million over four decades for different hazards over India. The result shows that the number per million has either decreased or remained constant during the recent decades of 2001 and 2011 for heatwave hazard (figure 5(a)). Similar results are obtained in the cases of floods (figure 5(b)), cold extremes (figure 5(c)) and cyclones (figure 5(d)). On the other hand, when we analyze the interannual variability of spatially aggregated hydro-climatic extremes for all of India, such as precipitation extremes and heatwaves (figure S8), it shows a significant increasing trend. Thus, this analysis perhaps indicates that though the hydro-climatic extreme hazards are increasing in India, the impact in-terms of mortality due to these hazards did not show any further damage. Overall, this finding indicates an enhanced capability to cope with hazards, which is manifest as the decadal decrease in SoV.
Figure 5. Mortality due to different hazards over India during recent decades. Figure (a) shows the number of deaths due to heatwaves per million populations over India from the census years 1981-2011. Similar analyses are carried out for (b) flood, (c) cold extremes and (d) cyclones.
Download figure:
Standard image High-resolution image
Discussion and conclusion
The primary contribution of our study is the fine-resolution risk mapping of hazards at the national-scale and proactively laying emphasis on developing SoV maps for entire India. A literature review on vulnerability mapping for the country revealed almost no research studies to the best of our knowledge. Our results show a decline in the SoV in the recent decade, which we believe may mainly be attributed to increase in literacy rate among Indian women and also to conversion of marginalized working population to main working population. Even so, an increase in the overall hydro-climate risk in certain regions is also observed, which could be the case because of increases in the probability of occurrence of potentially damaging hazard events over a significant portion of India. Hazards are usually a large-scale phenomenon whereas vulnerability and adaptations to their effects are predominantly local phenomena [31]. We have represented the risk map as a combination of hazard and vulnerability components. For the reason that it facilitates identification of disaster-prone regions with growing risk and of the extent of individualistic contribution of hazard and vulnerability components to hydro-climate risk in such regions. Such maps hold great potential for transformative action by decision-makers to strategically prioritize specific and cost-effective risk-reduction plans based on the magnitude of hazard and vulnerability in such increasing-risk regions.
A nationwide analysis can be used to identify the spatial extent of the high hazard-risk areas; however, identifying higher risk regions requires a more comprehensive analysis at a localized scale. Our analyses revealed the states Karnataka, Maharashtra, Odisha, and Telangana to be highly prone to disaster-risk. One-size-fits-all approach does not work for disaster management efforts since disasters affect different socio-economic communities differently. Policy-makers ought to necessarily consider representatives of specific demographic groups (e.g. the minority population of Scheduled Caste–Scheduled Tribe and other marginalized communities such as the urban poor etc, which experience greater difficulties in recovering from disaster impact) from these high-risk regions while designing and implementing disaster recovery, prevention, and mitigation measures [32]. The UN Sendai Framework for Disaster Risk Reduction (UN-SFDRR), which was finalized in Sendai, Japan in March 2015, comprises a voluntary set of targets and priorities to foster increased resilience to present and future hazards and to prevent setbacks to socio-economic development caused by small and large disasters. Table S3 lists a set of priority actions to reduce effect of increasing climate-risk over India, as proposed by UN-SFDRR.
Although the present study successfully maps SoV, it has certain limitations. Indicators such as population below poverty level, number of single-parent households [23], and patterns of migration [21, 24] have not been considered in the present study, primarily due to lack of availability of valid CoI data. The main outcome of this research work may be adjudged as the first ever set of hydro-climate risk maps developed for India at a national-scale. The risk and vulnerability maps developed in the present study can be further redefined by selecting the relevant vulnerability indicators for each particular hazard. For instance, the rural population might be relevant for droughts but not for heatwaves as people living in cities are more vulnerable (particularly elder population) to urban heat island and pollution increase during warm events. Nonetheless, the data obtained by the present risk-maps can be considered as foundational and be combined with economic and infrastructure information for further marked improvement. Such improvement strategies will require active initiatives by the government to develop fine-resolution datasets that specifically focus on the infrastructural and economic aspects of the country as well as migration data based on the CoI.
Acknowledgments
We extend our gratitude to the Census of India, Govt. of India for providing the demographic dataset and also, we would like to thank India Meteorological Department (IMD) for providing precipitation and temperature datasets. The mortality data due to various hazards are procured by the National Crime Records Bureau (NCRB), Govt. of India. We thank Dr Mohit Prakash Mohanty for helping us in plotting the Multivariate Risk maps. We also thank Ms Sheeba Sekharan for her contribution in shaping the manuscript. The authors also thank the Editor and two anonymous reviewers whose valuable suggestions improved the quality and readability of the manuscript.
Funding
The work presented here is supported by Ministry of Earth Sciences (MoES), Government of India (Project reference numbers MoES/PAMC/H&C/35/2013-PC-II and MoES/PAMC/H&C/36/2013-PC-II) and Department of Science & Technology (SPLICE-Climate Change Programme), Government of India (Project reference number DST/CCP/CoE/140/2018, Grant Number: 00000000000010013072 (UC ID: 18192442)). The first author acknowledges the support by Fulbright-Kalam Fellowship (Grant 2338/FKPDR/2018).
Author contributions
SK, SG and HV designed the problem. HV, SK, SG and RM performed the analysis. HV prepared the figures with input from SK, SG and RM. HV wrote the manuscript with inputs from SK, SG and RM.
Competing interests
The authors declare that they have no competing interests related to the study performed and presented in this paper.
Data availability
The data that support the findings of this study are available from the corresponding author upon reasonable request.