

Abstract
Although buildings produce a third of greenhouse gas emissions, it has been suggested that they might be one of the most cost-effective climate change mitigation solutions. Among building materials, wood not only produces fewer emissions according to life-cycle assessment but can also store carbon. This study aims to estimate the carbon storage potential of new European buildings between 2020 and 2040. While studies on this issue exist, they mainly present rough estimations or are based on a small number of case studies. To ensure a reliable estimation, 50 different case buildings were selected and reviewed. The carbon storage per m2 of each case building was calculated and three types of wooden buildings were identified based on their carbon storage capacity. Finally, four European construction scenarios were generated based on the percentage of buildings constructed from wood and the type of wooden buildings. The annual captured CO2 varied between 1 and 55 Mt, which is equivalent to between 1% and 47% of CO2 emissions from the cement industry in Europe. This study finds that the carbon storage capacity of buildings is not significantly influenced by the type of building, the type of wood or the size of the building but rather by the number and the volume of wooden elements used in the structural and non-structural components of the building. It is recommended that policymakers aiming for carbon-neutral construction focus on the number of wooden elements in buildings rather than more general indicators, such as the amount of wood construction, or even detailed indirect indicators, such as building type, wood type or building size. A practical scenario is proposed for use by European decision-makers, and the role of wood in green building certification is discussed.
Export citation and abstract BibTeX RIS

Original content from this work may be used under the terms of the Creative Commons Attribution 4.0 license. Any further distribution of this work must maintain attribution to the author(s) and the title of the work, journal citation and DOI.
1. Introduction
Currently, the construction of new buildings is a significant source of emissions. These are caused by the processing, manufacturing, and transportation of building materials. Concrete and steel productions in particular are responsible for a large share of global emissions [1]. However, it is possible to transform this source of emissions into a tool to mitigate climate change [2]. Combined with sustainable forestry, wood construction could increase the carbon sinks of cities beside forests. Buildings can provide long-term carbon storage, especially if they are located in urban areas where there is a growing demand for real estate; and thus, old wooden buildings do not become obsolete but are retrofitted instead of being demolished or left to decay, which is often the case in shrinking rural areas.
The focus of climate action in the building sector has traditionally been on the use phase of buildings, since energy consumption in this phase has dominated the life-cycle emissions of buildings [3–10]. This emphasis on the use stage has resulted in thicker insulation, improved thermal performance of windows, and more efficient heat recovery systems. However, these changes, along with the ongoing decarbonization of energy production, means that the emissions embodied in the building materials used to construct these new energy-efficient buildings play an increasing role in the total life-cycle emissions of buildings. For example, nearly zero-energy buildings have a pre-use impact that equals roughly 50% of their overall greenhouse gas (GHG) impact [11]. Several researchers have made similar observations when comparing zero-energy buildings to conventional buildings [12–18]. In the case of low-energy buildings, embedded energy during a 50 year life cycle is estimated to account for 46% of total emissions [19]. This figure is nearly 70% for passive buildings [5].
One issue that affects the ratio of initial embodied emissions (in the pre-use phase) to operational emissions is uncertainty about future sources of energy. Because energy production methods are continuously changing, the benefits of low-energy buildings with less operational emissions might get inflated over time [20]. According to the European Commission [21], the energy produced in the EU by renewable sources between 2004 and 2017 increased from 8.5% to 17.5% and is expected to reach 20% by the end of 2020 and 32% by 2030. Sweden had the highest share of renewable energy consumption (42%), followed by Finland (41%) and Latvia (39%). Another issue is that initial embodied emissions are expelled within a very short period compared to operational emissions and are evaluated by current energy production technology. Therefore, increasing initial embodied emissions would make the short-term CO2 reduction targets of the Intergovernmental Panel on Climate Change unachievable [6, 22–24].
One way of reducing initial embodied emissions is to use building materials that can be produced with less energy and fewer emissions. Compared to buildings constructed from concrete, steel, or masonry, wooden buildings seem to expel the least GHG emissions over their life cycle [25–34]. Thus, while wooden buildings are beneficial for the planet insofar as they generate fewer emissions during manufacturing, the carbon storage of wooden buildings is an additional mitigation option in both the short and the long term. While wood is considered as an environment friendly material, one should bear in mind that unsustainable use of wood supplies might result into further loss of endangered forests. Although developed regions (Europe, Oceania and North America) have been successful of keeping their forest area stable from 1990 to 2010, developing regions (Asia, Africa and South America) have lost 135 Mha of their forest area [35].
In general, two main types of studies have been conducted to estimate carbon storage in the built environment. The first type is based on case buildings, various components of which are constructed from wood. The carbon storage of the building is estimated and applied to the country level. The second type of study estimates the growing capacity of forests, allocates part of the annually produced timber to buildings, and then estimates the carbon storage of those buildings. The latter papers are mainly published in wood and forest journals.
One example of the first type is a 2018 study by Hafner and Sebastian [36], which estimated the carbon storage of wooden buildings in Germany by 2030. Using a 50/15 scenario, whereby 55% of single-family dwellings and 15% of apartment buildings would be wooden by 2030, the authors based their estimates on wooden case buildings in Germany from studies by Hafner and Schäfer [37], and Hafner et al [38]. In another paper, recently published in the journal Nature Sustainability, Churkina et al [39] estimated the potential carbon storage of new buildings between 2020 and 2050. They based their calculations on the assumption that all new constructions would be mid-rise buildings of between 4 and 12 floors. They did not estimate the number of new buildings that would be constructed but calculated the required new construction per capita based on a projected world population increase of 2.3 billion by 2050. However, relying on a small number of case buildings may not provide an accurate estimation of the amount of wood used in construction, and assuming that future construction will consist entirely of low- and mid-rise buildings may lead to unreliable results. Basing the analysis on a single building type or very few building types incurs a high risk of considerable under- or over-estimation of carbon storage.
Heräjärvi's [40] paper estimating the potential carbon storage of wooden buildings in Finland by 2020 is an example of the second type of study. He based his study on a rough estimation of the amount of wood used in different kinds of buildings. He assumed the average amount of wood used in single-family houses, attached houses, and multi-story buildings to be 40 m3, 15 m3, and 15 m3 per dwelling unit, respectively. He calculated the carbon storage potential by applying the wood usage to the total number of construction projects in Finland. However, basing calculations of wood usage on a single figure per building type can only give a rough estimate of carbon storage.
In this study, we aim to provide a more accurate assessment of the carbon storage potential of wooden buildings. We show that the potential depends on the type of wooden building (the proportion of wood in the building's composition) and the share of new buildings that are constructed of wood. We introduce a new wood building typology to identify the potential for carbon-negative construction. Our study is based on 50 wooden case buildings of different types and structures in a variety of locations around the world, resulting in more accurate estimates than those in previous studies.
2. Methodology
2.1. Research design
We conducted a literature review to obtain a comprehensive view of the carbon storage potential of different types of buildings. Based on this review, we selected 50 case buildings from the literature, for which sufficient data relevant to the objectives of our study was available (sub-section 2.2.). We compiled information on GHG emissions and converted these to a uniform unit (sub-section 2.3.) to facilitate comparison. Using this same unit, we calculated the carbon storage of the case buildings based on the amount of wood used in their construction (sub-section 2.3.).
After obtaining the carbon storage in CO2 kg m−2, we extrapolated our results to estimate the amount of carbon storage (CO2 kg) at the European level (results section) based on projected new construction per m2 in Europe between 2020 and 2040. Four scenarios based on different percentages of wooden buildings compared to other building types were designed. We assessed each scenario based on different types of wooden buildings (sub-section 3.1.). We analyzed the results for the four scenarios and selected the best scenario as a starting point for decision-makers and a roadmap for the future construction of European buildings.
2.2. Selection of case buildings
We used two methods to select papers. First, we selected 11 peer-reviewed papers based on the knowledge of the authors. Next, on January 12, 2020, we ran a search in the Scopus database using the phrase 'carbon storage timber buildings'. This search yielded 60 results. After limiting the results to peer-reviewed journal articles, excluding conference papers, book chapters, and reports, and adding the 11 previously selected papers, we were left with 49 papers. Among screening abstracts, we excluded 11 papers, and a further 18 were excluded after studying the full articles; this left us with 20 final papers. The 20 selected papers included 50 buildings. The PRISMA flowchart used to select the case buildings can be found in the supplementary material (available online at stacks.iop.org/ERL/15/094076/media).
2.3. Life-cycle assessment review of the case buildings
Certain conversions were necessary to ensure that the results were comparable. As the study is based on gross area (GA), in cases where only net area (NA) was reported, we used a constant of 0.7 to convert NA to GA (GA = NA/0.7) in accordance with Passer et al [5] and Lylykangas et al [41]. Furthermore, since this study uses GHG emissions and some of the reviewed studies report their results as embodied energy, we applied a conversion factor of 0.266 kg per kWh to calculate the equivalent GHG emissions. This is in line with the recommendations of Junnila et al [42], and Fuller and Crawford [43].
Table 1 shows the life-cycle assessment results of the reviewed studies based on GHG emissions (kg CO2 −eq m−2). Some of the reviewed studies included the pre-use, use, and end-of-life stages, but our amounts for GHG emissions are for the pre-use phase as this research focuses on initial embodied emissions. Structural parts include all load-bearing parts (e.g. columns, beams, and floors), while non-structural components are components that have no role in the load-bearing system. Products include any parts of the building installed after construction, such as cabinets, carpets, and water fixtures.
Table 1. Characteristics and amount of GHG emissions of buildings selected for the study (Str. = Structural).
| No. | Author | Year | Building type | GA (m2) | Floors | Location | Included parts | LCA method | Studied stages | Wood type | GHG (kg CO2 −eq m−2) | ||||
|---|---|---|---|---|---|---|---|---|---|---|---|---|---|---|---|
| Str. | Non-str. | Products | Pre-use | Use | EoL | ||||||||||
| 1 | Cole and Kernana | 1996 | Office | 6160 | 2 | Canada | ✓ | ✓ | Process | ✓ | ✓ | ✓ | Timber | 320 | |
| 2 | Cole and Kernana | 1996 | Office | 4620 | 3 | Canada | ✓ | ✓ | Process | ✓ | ✓ | ✓ | Timber | 340 | |
| 3 | Winther and Hestnesa | 1999 | Detached res. | 157 | 2 | Norway | ✓ | ✓ | ✓ | Process | ✓ | ✓ | ✓ | Lumber | 100 |
| 4 | Winther and Hestnesa | 1999 | Detached res. | 157 | 2 | Norway | ✓ | ✓ | ✓ | Process | ✓ | ✓ | ✓ | Lumber | 110 |
| 5 | Winther and Hestnesa | 1999 | Detached res. | 157 | 2 | Norway | ✓ | ✓ | ✓ | Process | ✓ | ✓ | ✓ | Lumber | 130 |
| 6 | Winther and Hestnesa | 1999 | Detached res. | 157 | 2 | Norway | ✓ | ✓ | ✓ | Process | ✓ | ✓ | ✓ | Logwood | 130 |
| 7 | Winther and Hestnesa | 1999 | Detached res. | 157 | 2 | Norway | ✓ | ✓ | ✓ | Process | ✓ | ✓ | ✓ | Logwood | 230 |
| 8 | Borjesson and Gustavsson | 2000 | Apartment res. | 1679 | 4 | Sweden | ✓ | Process | ✓ | ✓ | ✓ | Timber | 50 | ||
| 9 | Fay et ala | 2000 | Detached res. | 183 | 2 | Austria | ✓ | ✓ | ✓ | Hybrid | ✓ | ✓ | ✓ | Timber | 730 |
| 10 | Lenzen and Treloara | 2002 | Apartment res. | 1679 | 4 | Sweden | ✓ | Hybrid | ✓ | Timber | 90 | ||||
| 11 | Lenzen and Treloara | 2002 | Apartment res. | 1679 | 4 | Sweden | ✓ | Hybrid | ✓ | Timber | 110 | ||||
| 12 | Lenzen and Treloara | 2002 | Apartment res. | 1679 | 4 | Sweden | ✓ | Hybrid | ✓ | Timber | 160 | ||||
| 13 | Gustavvson et ala | 2006 | Apartment res. | 1700 | 4 | Finland | ✓ | ✓ | Process | ✓ | ✓ | ✓ | Lumber | 220 | |
| 14 | Gustavvson et ala | 2006 | Apartment res. | 1679 | 4 | Sweden | ✓ | ✓ | Process | ✓ | ✓ | ✓ | Lumber | 300 | |
| 15 | Happiio and Viitaniemia | 2008 | Detached res. | 135 | 1 | Finland | ✓ | ✓ | Process | ✓ | ✓ | ✓ | Timber | 100 | |
| 16 | Fuller and Crawford | 2011 | Detached res. | 84 | 1 | Australia | ✓ | ✓ | Input–output | ✓ | ✓ | Logwood | 1000 | ||
| 17 | Säynäjoki et al | 2011 | Detached res. | 35 270 | 2 | Finland | ✓ | ✓ | ✓ | Input–output | ✓ | Timber | 1420 | ||
| 18 | Säynäjoki et al | 2011 | Detached res. | 35 270 | 2 | Finland | ✓ | ✓ | ✓ | Process | ✓ | Timber | 1720 | ||
| 19 | Säynäjoki et al | 2011 | Detached res. | 35 270 | 2 | Finland | ✓ | ✓ | ✓ | Input–output | ✓ | Timber | 2010 | ||
| 20 | Robertson et al | 2012 | Office | 14 233 | 8 | Canada | ✓ | ✓ | Process | ✓ | ✓ | ✓ | CLT + Glulam | 130 | |
| 21 | Gong et al | 2012 | Apartment res. | 5590 | 3 | China | ✓ | ✓ | Process | ✓ | ✓ | ✓ | Lumber | 190 | |
| 22 | Passser et al | 2012 | Apartment res. | 1609 | 3 | Austria | ✓ | ✓ | ✓ | Process | ✓ | ✓ | ✓ | Timber | 490 |
| 23 | Passser et al | 2012 | Apartment res. | 1381 | 3 | Austria | ✓ | ✓ | ✓ | Process | ✓ | ✓ | ✓ | Timber | 660 |
| 24 | Lützkendorf et al | 2015 | Apartment res. | 160 | 2 | Norway | ✓ | ✓ | Process | ✓ | ✓ | Timber | 320 | ||
| 25 | Takano et al | 2014 | Apartment res. | 1243 | 3 | Finland | ✓ | ✓ | Process | ✓ | ✓ | Timber | 100 | ||
| 26 | Takano et al | 2014 | Apartment res. | 1243 | 3 | Finland | ✓ | ✓ | Process | ✓ | ✓ | CLT | 150 | ||
| 27 | Takano et al | 2015 | Apartment res. | 726 | 5 | Germany | ✓ | ✓ | Process | ✓ | ✓ | ✓ | CLT + Glulam | 335 | |
| 28 | Sim and Sim | 2016 | Detached res. | 110 | 1 | South K. | ✓ | ✓ | Process | ✓ | ✓ | ✓ | Timber | 390 | |
| 29 | Hafner and Schäfer | 2017 | Apartment res. | 2033 | 8 | Germany | ✓ | ✓ | Input–output | ✓ | ✓ | ✓ | CLT | 168 | |
| 30 | Hafner and Schäfer | 2017 | Apartment res. | 723 | 4 | Germany | ✓ | ✓ | Input–output | ✓ | ✓ | ✓ | CLT | 157 | |
| 31 | Hafner and Schäfer | 2017 | Apartment res. | 1394 | 6 | Germany | ✓ | ✓ | Input–output | ✓ | ✓ | ✓ | Timber | 248 | |
| 32 | Hafner and Schäfer | 2017 | Apartment res. | 6152 | 3 | Germany | ✓ | ✓ | Input–output | ✓ | ✓ | ✓ | Timber | 239 | |
| 33 | Hafner and Schäfer | 2017 | Apartment res. | 2717 | 4 | Germany | ✓ | ✓ | Input–output | ✓ | ✓ | ✓ | Timber | 196 | |
| 34 | Hafner and Schäfer | 2017 | Apartment res. | 1257 | 4 | Germany | ✓ | ✓ | Input–output | ✓ | ✓ | ✓ | Timber | 182 | |
| 35 | Hafner and Schäfer | 2017 | Apartment res. | 1172 | 5 | Germany | ✓ | ✓ | Input–output | ✓ | ✓ | ✓ | Timber | 214 | |
| 36 | Hafner and Schäfer | 2017 | Apartment res. | 3847 | 5 | Germany | ✓ | ✓ | Input–output | ✓ | ✓ | ✓ | CLT + Glulam | 181 | |
| 37 | Padilla-Rivera et al | 2018 | Apartment res. | 2160 | 4 | Canada | ✓ | ✓ | Process | ✓ | CLT + Glulam | 135 | |||
| 38 | Padilla-Rivera et al | 2018 | Apartment res. | 2160 | 4 | Canada | ✓ | ✓ | Process | ✓ | CLT + Glulam | 148 | |||
| 39 | Padilla-Rivera et al | 2018 | Apartment res. | 2160 | 4 | Canada | ✓ | ✓ | Process | ✓ | CLT + Glulam | 141 | |||
| 40 | Kristjansdottir et al | 2018 | Detached res. | 268.5714 | 3 | Norway | ✓ | ✓ | ✓ | Process | ✓ | ✓ | Timber | 105 | |
| 41 | Kristjansdottir et al | 2018 | Detached res. | 267.1429 | 2 | Norway | ✓ | ✓ | ✓ | Process | ✓ | ✓ | Timber | 93 | |
| 42 | Kristjansdottir et al | 2018 | Detached res. | 228.5714 | 2 | Norway | ✓ | ✓ | ✓ | Process | ✓ | ✓ | Timber | 108 | |
| 43 | Kristjansdottir et al | 2018 | Detached res. | 220 | 2 | Norway | ✓ | ✓ | ✓ | Process | ✓ | ✓ | Timber | 91 | |
| 44 | Kristjansdottir et al | 2018 | Detached res. | 145.7143 | 1 | Norway | ✓ | ✓ | ✓ | Process | ✓ | ✓ | Timber | 140 | |
| 45 | Kristjansdottir et al | 2018 | Detached res. | 288.5714 | 2 | Norway | ✓ | ✓ | ✓ | Process | ✓ | ✓ | Timber | 125 | |
| 46 | Kristjansdottir et al | 2018 | Detached res. | 225.7143 | 2 | Norway | ✓ | ✓ | ✓ | Process | ✓ | ✓ | Timber | 81 | |
| 47 | Kristjansdottir et al | 2018 | Detached res. | 267.1429 | 2 | Norway | ✓ | ✓ | ✓ | Process | ✓ | ✓ | Timber | 81 | |
| 48 | Pierobon et al | 2019 | Office | 14 715 | 11 | US | ✓ | Process | ✓ | CLT + Glulam | 333 | ||||
| 49 | Pierobon et al | 2019 | Office | 14 715 | 11 | US | ✓ | Process | ✓ | CLT + Glulam | 327 | ||||
| 50 | Resch et al | 2019 | Detached res. | 146 | 1 | Norway | ✓ | ✓ | ✓ | Process | ✓ | ✓ | Timber | 404 | |
aStudies that the equivalent GHG emissions were calculated using the conversion factor
2.4. Calculation of carbon storage
To calculate carbon storage, we had to determine the amount of wood used in the case buildings in kg or m3. Most studies included the bill of materials quantity or data on the amount of wood used in the case buildings. Where minor data was missing, we used our expert judgment and based our estimations on the materials data for other case buildings. Case buildings for which a significant amount of data was lacking and for which it was impossible to determine the amount of stored carbon were excluded from the study.
The rate of CO2 sequestration of a building depends on the building's characteristics and the amount of wood used in its structural, non-structural, and installed products. The average carbon content of dried wood is 50% of the total volume [44]. To determine the weight of carbon dioxide sequestered in wood, we multiplied the weight of the carbon content by 3.67, which is equivalent to the ratio of the molecular weight of CO2 to the atomic weight of carbon. Thus, the mass (kg) of wood used in different parts of the building was multiplied by 1.84 (50% of 3.67) to determine the amount of CO2 (kg) stored in these parts. The ratio of 1.84 is very close to that recommended by other researchers, such as Hafner and Schäfer [11].
Where the volume of wood per m3 was available, it was possible to calculate the mass (kg) of wood based on its density. Table 2 presents the densities used in this study.
2.5. Definition of the scenarios
To estimate the potential captured CO2 using the amount of carbon stored by wooden buildings per m2, we considered a period of 20 years from the year 2020 to 2040. We also present the records for the last five years (from 2015). There were two variables to consider. The first was the carbon storage level of wooden buildings (sub-section 3.1.), and the second was the percentage of all buildings that were wooden. In 2015, the annual GA completion of residential buildings in Europe was 185.71 million m2, 4.9% of which accounts for wooden buildings [46, 47]. The annual rate of increase for new construction was assumed to be 0.87% [47].
Four scenarios were considered. For the first scenario, we assumed that wooden buildings would account for 5% of all buildings, thus remaining almost the same as in 2015. For the second scenario, we assumed a share of 10%, which is close to the value of 9.1% used by Hildebrandt et al [47] to represent the average increase in the number of wooden buildings from 2015 to 2030. For the third scenario, we used a higher estimate of 45%, which is between the value for the second scenario and that for the last scenario. For the last scenario, we used a value of 80%, based on an estimated 84% of North American residential buildings that had wooden structures in 2017 [48].
3. Results
3.1. Carbon storage of wooden buildings
The carbon stored per square meter of the buildings studied ranges from 23 to 310 CO2 kg m−2 (figure 1). Hafner and Schäfer's [37] case building (no. 35) had the lowest amount and can be considered a hybrid structure because only part of its structure is made of wood. Some case buildings use wood just for structural parts, while others use wood for all parts. Here, the question of what is considered a wooden building arises which has been discussed in discussion section. The wooden buildings studies can be categorized into three levels: level 100 (low), which store 100 CO2 kg m−2; level 200 (mid), which store 200 units; and level 300 (high), storing 300 units.
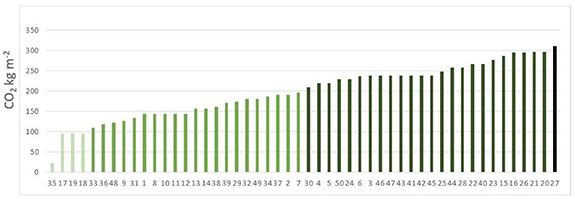
Figure 1. Calculated carbon storage of case buildings.
Download figure:
Standard image High-resolution imageAs figure 2 shows, the amount of wood used in structural, non-structural, and installed products plays a major role in determining the amount of carbon stored by the building. Neither building type nor wood type has much influence on carbon storage. Low-rise buildings, including attached and detached houses, seem to be more homogenous. This may be due to current construction practices used for these houses and their higher number of wooden components. Construction companies have less experience in higher-rise wooden buildings and the technical details needed for their design and construction. There appears to be more variation in higher-rise buildings, which is likely due to the current trend to use non-wooden components, especially for non-structural parts. The size of buildings may have a small impact, whereby larger buildings store a little less carbon on average. Wooden non-structural elements clearly increase the carbons stock of a building.
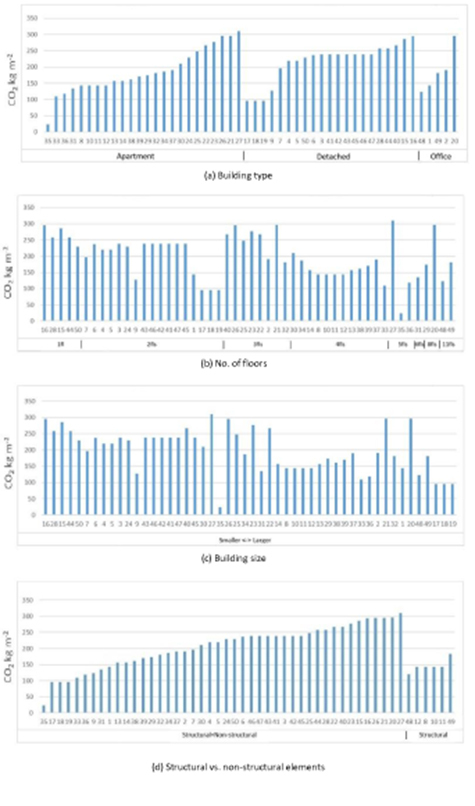
Figure 2. Carbon storage amounts for different parameters. (a) Building type. (b) No. of floors. (c) Building size. (d) Structural vs. non-structural elements. (e) Wood type.
Download figure:
Standard image High-resolution imageLocal building regulations affect the amount of wood used, which, in turn, affects a building's carbon storage. For example, strict regulations about fire safety might result in the use of thicker or extra layers of wood. In locations such as Japan, where earthquake regulations significantly influence the structural parts of buildings, greater amounts of wood are used in buildings' structures.
3.2. A typology of wooden buildings for carbon neutrality
Several authors have proposed using wooden buildings for climate mitigation, and numerous cities have committed to achieving carbon neutrality in the coming years. In this study, we propose a new typology of wooden buildings to demonstrate how carbon neutrality might be achieved through wooden construction.
Figure 3 presents the carbon storage and pre-use phase emissions of wooden buildings. The green boxes represent cases where the pre-use GHG emissions of the building are equal to or less than the building's carbon storage. The buildings to the left of the red diagonal are conceptually very interesting because they can be termed carbon-negative buildings. This means that the wood from trees used in the production of these buildings (forestation, manufacturing, and construction) actually reduces CO2 emissions in the atmosphere. The line shows where the initial embodied emissions are equal to a building's carbon storage. The buildings on this line can be termed carbon-neutral buildings. It is important to note that the GHG emissions of the buildings are taken directly from the reviewed LCA studies and not from the authors' calculations. Therefore, differences in boundary definitions and assumptions of LCA method may have influenced the locations of the buildings on the graph.
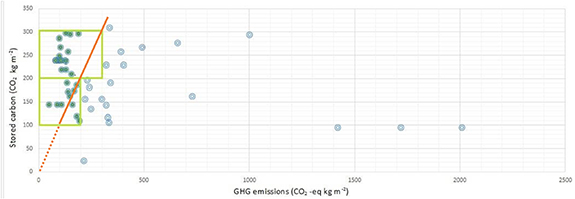
Figure 3. CO2 emissions vs. CO2 capture.
Download figure:
Standard image High-resolution image3.3. Carbon storage scenarios
This sub-section presents the results of the analyses of the four scenarios relating to wood construction in Europe. In these scenarios, wood construction is estimated to account for 5%, 10%, 45%, and 80%, respectively, of total construction in Europe for the period 2020 to 2040. For each scenario, we tested how wooden buildings with different carbon storage levels—level 100 (low), level 200 (mid) and level 300 (high)—would influence the outcome. The carbon storage levels were taken from the studied papers and are presented in kg CO2 per m2 (see figure 1).
Figure 4(a) shows the results for the 5% scenario, where the cumulative amount of captured CO2 for levels 100, 200, and 300 is 0.022 Gt, 0.044 Gt, and 0.067 Gt, respectively. The values for the 10% scenario (figure 4(b)) are 0.044 Gt, 0.089 Gt, and 0.133 Gt respectively. The cumulative values for the 45% scenario (figure 4(c)) are 0.2 Gt, 0.4 Gt, and 0.6 Gt, while those for the 80% scenario (figure 4(d)) are 0.356 Gt, 0.712 Gt, and 1.067 Gt.
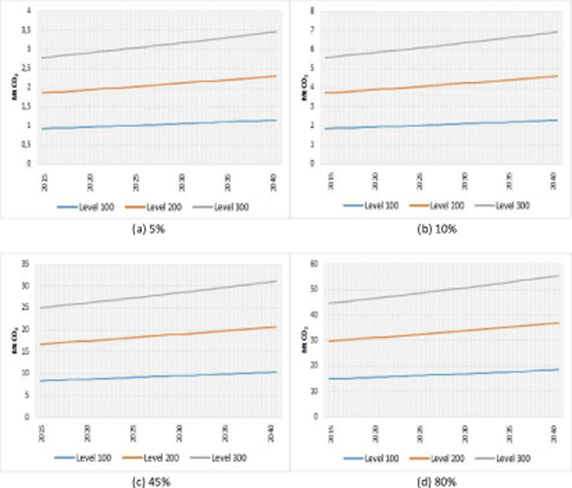
Figure 4. Annual carbon storage potential for (a) 5%, (b) 10%, (c) 45%, and (d) 80% wooden buildings of different levels.
Download figure:
Standard image High-resolution imageWhen considering the results for the various scenarios, it is worth noting that if steel and concrete were used for new buildings, with an average floor area per capita of 30 m2, the cumulative emissions for Europe during the 20 year period would be 0.195 Gt; the figure for the world would be 10.819 Gt [39].
4. Discussion
This study aims to estimate the carbon storage potential of wooden building construction in Europe from 2020 to 2040. To generate realistic estimates, we reviewed 50 case buildings from different studies conducted around the world and compiling data on the amount of stored carbon per building. We also reviewed LCAs of the case buildings and included the results in the study.
We introduced three categories of wooden buildings, with different levels of potential carbon storage. Level 100 buildings have a carbon storage capacity of 100 CO2 kg m−2, while buildings at levels 200 and 300 have a carbon storage capacity of 200 and 300 CO2 kg m−2, respectively. All the reviewed case buildings were wooden, despite of the 3-fold variance in carbon storage. Hence, the term 'wooden building' is not unambiguous. In addition, we distinguished carbon-neutral and carbon-negative wooden buildings based on a comparison of carbon capture and production. We recommend these as climate change mitigation solutions.
We considered different percentages of wooden buildings and their carbon storage levels (100, 200, and 300) as variables for future scenarios. The annual captured CO2 for the period 2020 to 2040 varied between 1 and 55 Mt for various scenarios. The captured carbon was equivalent to between 1% and 47% of European cement production in 2018 [49]. Hildebrandt et al's [47] results range from 17 Mt for 2020 to 60 Mt for 2030. Applying the results for Finland reported by Heräjärvi [40] to Europe (using a ratio of the population of Finland to that of Europe) gives a result of 37 Mt for 2020. He assumed that the share of wooden buildings would be 82% for single-family houses, 60% for attached houses, and 1.5% for apartment buildings.
Churkina et al's [39] recently published article estimated the potential worldwide CO2 capture of new buildings over the next 30 years. Europe's share accounted for 1.8% in their calculation. Using of a coefficient of 0.67 to consider the different time scale (20 years instead of 30 years) results in a cumulative captured CO2 potential of 0.011–0.102 Gt for a 10% scenario, 0.045–0.484 Gt for a 50% scenario, and 0.088–0.885 Gt for a 90% scenario for Europe. Our study yielded the following estimates: 0.022–0.067 Gt for the 5% scenario, 0.044–0.133 Gt for the 10% scenario, 0.2–0.6 Gt for the 45% scenario, and 0.356–1.067 Gt for the 80% scenario. There are three possible reasons for the differences between the results. First, Churkina et al [50] included both residential and commercial buildings to be constructed during the next 30 years while the current study is based on residential buildings only. Second, they used a living area per capita ranging from 9.2 to 79.1 m2 for their calculation and estimated a total increase in population for the whole 30 years, while we assumed an annual increase in building construction of 0.87%. Lastly, Churkina et al used a typical mid-rise building using cross-laminated timber (CLT) and glulam with a potential carbon storage per GA of 285 CO2 kg m−2 as a model, which resulted in higher quantities than those in our study. This amount is close to that of level 300 (high) wooden buildings in our study.
It should be noted that relying on mid-rise wooden buildings for the next ten years might not be efficient because of lack of experience with these buildings and lack of technical details on their construction and design. Attached and detached wooden buildings have been widely used, so construction companies have significant experience in these building types, making them a reliable solution for carbon mitigation in the coming ten years. Estimating the carbon storage of wooden buildings based on population growth might result in over- or under-estimation, especially in the case of Europe, which may experience migration from Asian and African countries in the future. In addition, house-owners in Europe may decide to demolish existing houses and build new ones instead of renovating. Therefore, new construction rate is a more reliable basis for estimations than population growth.
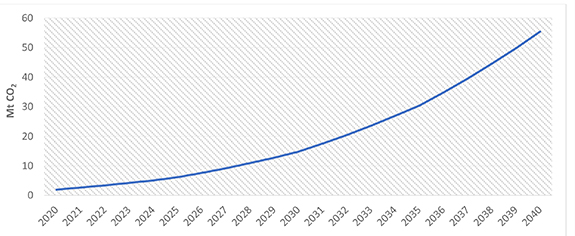
To support future decision-making, we developed a feasible scenario of carbon storage potential by the construction of wooden buildings considering both percentages of wooden buildings compared to other types of buildings and their level (figure 5). This scenario could serve as an ambitious road map for increasing the carbon storage of the European built environment. In this scenario, we assumed that wooden buildings would account for 10% of all buildings in 2020 and that this would increase to 80% by 2040. The 20 year period was divided into sub-periods of five years. From 2020 to 2025, the share would increase by 2% per year reaching 20% in 2025. The projected increases for the following sub-periods are 3% between 2025 and 2030, 4% between 2030 and 2035, and 5% between 2035 and 2040. We assumed that the carbon storage potential of wooden buildings would also increase from 100 CO2 kg m−2 (level 100 buildings) in 2020 to 200 CO2 kg m−2 (level 200 buildings) in 2030, to a maximum of 300 CO2 kg m−2 (level 300 buildings) in 2040. The annual amount of CO2 captured would then be 2 Mt for 2020, 15 Mt for 2030, and 55 Mt for 2040. Thus, the cumulative amount for this 20 year period would be 0.42 Gt.
Figure 5. Carbon storage potential for the proposed scenario.
Download figure:
Standard image High-resolution image
In general, there are two main ways of mitigating climate change and protecting the environment. One is to produce less carbon, while the other one is to capture carbon. Even replacing fossil fuels with renewable sources will never reduce the produced CO2 emissions of materials such as cement or steel to zero as producing these materials involves chemical reactions, which result in emissions [1]. There are various kinds of plans and incentives in different countries for buildings that produce fewer emissions, but none for buildings that capture carbon. Even voluntary green building certificates, such as the points-based Leadership in Energy and Environmental Design (LEED) program, focuses on producing fewer emissions rather than capturing emissions through the use of certain materials.
As the most widely used green certificate in the world [51–53], LEED allocates 13 points (12%) for material and resources used in new building construction. Among these, five points are allocated for LCA. However, as we have outlined above, LCA results vary significantly depending on the method, the assumptions, the boundary conditions, and the software used for the calculation. Therefore, it is recommended that a standard format for LCAs be established. Six points are allocated for materials, which we recommend awarding based on the categorization of wooden buildings in this study. The last two points, for construction and demolition waste management, could be awarded based on the reuse and recycling of wooden components at the end-of-life stage.
There has been discussion on whether timber construction is a viable carbon mitigation strategy since it requires harvesting forests, which are considered natural carbon sinks. The common argument is that the forests should be left untouched to allow naturally functioning carbon sinks to increase their carbon storage. However, issues arise when a forest gets old and its CO2 capture becomes equal to its carbon production. In addition, forests contain surpluses of unused wood [54, 55], which can be used to replace building materials such as concrete at a near-zero cost [26, 56, 57].
While there are opportunities for wood harvesting in the world, it should be noted that wood harvesting is only reasonable if forests are managed efficiently. Otherwise, using wood for construction will result in the disappearance of forests, which would be even worse, from a climate change perspective, than current construction practices. While the most structural timbers in Europe come from sustainably managed coniferous forests [58], the situation is risky in developing regions. Due to the probability of unsustainable use of tropical hardwoods, it is recommended to use global certifications systems like the Program for Endorsement of Forest Certification (PEFC) and Forest Stewardship Council (FSC) [59].
An efficient way of using wood sources is its plantation before usage, i.e. planted forest [60, 61]. With plantation, there will be advantages like carbon sequestration, water retention [62], and biodiversity conservation [63] beside the wood production. Compared to natural forests, intensively managed planted forests can produce up to 2 and 25 times more wood biomass per hectare [61].
5. Conclusions
The environmental concerns together with the increasing demand of building construction make it necessary to find building materials which not only produce less emissions during their production but also serve as carbon sequestration solution in order to mitigate climate change. As a widely available material in Europe, wood is a considerable option. There are two factors that affect the total amount of carbon storage provided by wooden building construction: (1) the volume of wood per area of the building and (2) the percentage of wooden buildings compared to other types of buildings, such as concrete and steel. European decision makers need a gradual plan of switching to wooden building with focus on both options.
The potential carbon storage of wooden buildings is not mainly related to the building type, wood type, or the building size but is based on the number and the volume of wooden components in these buildings. There is a carbon storage capacity equal to 1 and 47% of European cement industry CO2 emissions if new buildings construction in Europe is planned to be wooden. On the other hand, one should bear in mind that the environmentally beneficial use of wood in building construction is possible if careful attention is paid to sustainable forest management and plantation especially if the results of the current study are going to be used in places outside Europe where there is a risk of forest depletion.
Acknowledgments
This research was funded by the Ministry of the Environment of Finland, CarbonSinkCity grant (310283). The views expressed by the authors do not necessarily reflect those of the funder.
Data availability statement
All data that support the findings of this study are included within the article (and any supplementary information files).