

Abstract
It is now established that microplastics are a pervasive presence in aquatic and terrestrial ecosystems. The same is assumed to be true for nanoplastics but data are lacking due to technical difficulties associated with sample analysis. Here, we measured nanoplastics in waterbodies at two contrasting sites: remote Siberian Arctic tundra and a forest landscape in southern Sweden. Nanoplastics were detected in all sampled Swedish lakes (n = 7) and streams (n = 4) (mean concentration = 563 µg l−1) and four polymer types were identified (polyethylene, polyvinyl chloride (PVC), polypropylene, polyethylene terephthalate). In Siberia nanoplastics were detected in 7/12 sampled lakes, ponds and surface flooding, but only two polymer types were detected (PVC and polystyrene) and concentrations were lower (mean 51 µg l−1). Based on back-calculation of air mass trajectories and particle dispersion, we infer that nanoplastics arrive at both sites by aerial deposition from local and regional sources. Our results suggest that nanoplastics may be a near-ubiquitous presence even in remote ecosystems.
Export citation and abstract BibTeX RIS

Original content from this work may be used under the terms of the Creative Commons Attribution 4.0 license. Any further distribution of this work must maintain attribution to the author(s) and the title of the work, journal citation and DOI.
1. Introduction
Since the commercialisation of plastic polymers in the 1950s plastic usage has expanded rapidly, with ever-increasing yearly production, resulting in an estimate of >9300 million tons (Mt) produced globally to date [1, 2]. However, 60% of all plastics ever produced have been discarded, either to landfills or the environment [2]. Much of the 360 Mt yr−1 of newly produced plastics are used in single-use items that are disposed of within a few years of production [1, 2]. If deposited in the environment, plastics fragment to microplastics (pieces <5 mm), and then fragment further to nanoplastics (<1 µm particles), particularly if exposed to air and UV radiation [3–7]. This large plastic load has significant implications for aquatic and terrestrial ecosystem functioning, and for human health [8–11].
Microplastics have already been found in many environments, including marine waters, aquatic sediments, freshwater systems, soils, and the atmosphere. These reports span both urban and remote locations [8, 12–18]. However, the research field is still relatively young and our ability to quantify ecosystem microplastic budgets, including major pools, sources and sinks, is still under-developed [19]. Urban areas are primary sources and thus focal points for emissions [2]. Synthetic fibres and single-use products are a significant source of microplastics to the environment because microfibres can be carried by water and air and can reach remote places including wilderness areas, mountaintops, and polar regions [12, 14, 20–22]. This transport has been named the plastic cycle: 'the continuous and complex movement of plastic materials between different abiotic and biotic ecosystem compartments, including humans' [23].
Compared to microplastics, considerably less is known about the fate of nanoplastics in the environment and their abundance in different ecosystems. This is largely due to the technical difficulties associated with accurately analysing samples for nanoplastics [6, 24]. Only a handful of results have been reported to date but these limited measurements indicate the presence of nanoplastics in the ocean, in beach sediments, rivers, and high-altitude montane snow [21, 25–28]. These early results suggest that nanoplastics can be subject to long-range transport and be present in the environment at high concentrations (i.e. concentrations of the same magnitude as microplastics) [21, 27, 29, 30]. It is thought that the toxicity of nanoplastics to living organisms is greater than that of microplastics because nanoplastics can be ingested easily (even crossing cell membranes) and thus can bioaccumulate [9, 31]. Nanoplastics have been shown to have various adverse effects on organismal biology: for example, they can denature proteins by changing the three-dimensional structure of them [32] and can inhibit microbial growth and metabolism [33]. The consequences of nanoplastic ingestion on the organismal level include behavioural abnormality, inhibited development, and early mortality [11]. The effects of nanoplastics on human biology is largely unknown but it does appear that they can induce cellular responses, with immune system reactions being of particular concern [31]. Thus, more research is urgently needed to address this novel environmental contaminant, and a primary focus should be on determining the levels of nanoplastic pollution present in different ecosystems so that viable mitigation measures can be developed.
Here, we use Thermal Desorption—Proton Transfer Reaction—Mass Spectroscopy (TD-PTR-MS) to measure the mass-concentrations of nanoplastics in the surface waters from two contrasting sites; a remote tundra landscape in the far east Siberian Arctic, and a forested area close to population centres in Sweden. Our aim was to investigate the following:
- (a)How does the type and quantity of nanoplastics vary between the two sites (Siberia and Sweden)?
- (b)How does the type and quantity of nanoplastics vary between the different waterbodies within each site?
- (c)What inferences can be made about plastic sources, deposition pathways, and removal processes?
2. Results and discussion
2.1. Nanoplastics concentration and types
Sampling took place at two locations. The first was in the vicinity of the hemiboreal, forested Gårdsjön research catchment (58°03'35'' N 12°01'18'' E) in south west Sweden. Here, seven lakes and four streams were sampled in August 2017. There are no permanently inhabited dwellings and no public roads within the Gårsdjön catchment where nine samples were collected from, but two lakes that were sampled in adjacent catchments have respectively ∼50 and ∼80 dwellings nearby, and can be accessed by small public roads. The nearest small town (population 10 000) is 10 km to the west and the nearest city (population 600 000) is 40 km to the south. The second sampling location was the Kytalyk Nature Reserve in the Indigirka River lowlands in north-east Siberia (70°49'48'' N 147°29'24'' E). There are no permanent dwellings within the area, and no roads; access is via boat or snowmobile from the nearest settlement (population 2000) 30 km to the south-east, and the nearest city (population 310 000) is 1200 km to the south-west. At this site, samples were collected from three lakes, five ponds, overland flow from thawing permafrost and flooded tundra in July 2017. (figures 1 and 2). Samples were analysed for polyethylene (PE), polyvinyl chloride (PVC), polypropylene (PP), polyethylene terephthalate (PET) and polystyrene (PS).
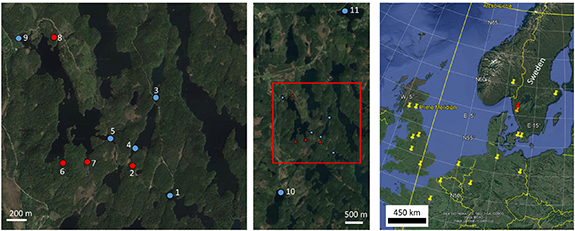
Figure 1. The Swedish sampling site. Left panel: the Gårdsjön research catchment with lake (blue circles) and stream (red circles) sampling locations marked; numbers refer to the results in table 1. Centre panel: the Gårdsön catchment (red rectangle) shown in the wider landscape, with the two extra lake sampling locations marked. Satellite images: @2021 CNES/Airbus, Landsat/Copernicus, Lantmäteriet/Metria, Maxar Technologies. Right panel: Google Earth map showing the Gårdsjön catchment (red pin) and major cities that dispersion models (figure 4) show as potential sources of atmospheric deposition. Yellow pints represent cities with urban populations >1 million. Orange pin represents Gothenburg, which has a population of 0.6 million and is the nearest city to the Gårdsjön catchment.
Download figure:
Standard image High-resolution image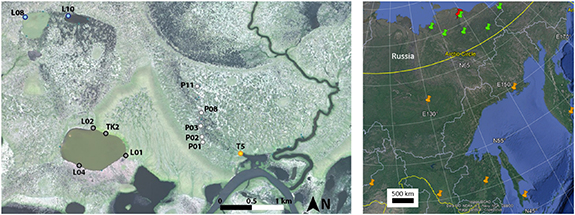
Figure 2. The Siberian sampling site in the Kytalyk Nature Reserve. Left panel: the sampling area showing small lakes (L, blue circles), thermokarst lakes (L, grey circles), thawing permafrost (TK, grey circle), ponds (P, white circles), and flooded tundra (T, yellow circle). Right panel: Google Earth map showing location of the Kytalyk Nature Reserve (red pin) in the Russian Far Eastern Federal District, with large towns throughout the region (orange pins, population 100 000–300 000) and small settlements closest to the study site (green pins, population 1400–3500).
Download figure:
Standard image High-resolution imageThe mean concentration of total nanoplastics for the Swedish sites was 563 µg l−1 (table 1). The highest concentrations were observed for PE (figure 3, mean = 272 µg l−1), which is the most common plastic in use in Europe [1]. Mean concentrations of other detected polymer types were: PP 141 µg l−1, PVC 117 µg l−1, and PET 33 µg l−1. PE was found in all samples, whereas PVC and PP were found in 7/11 samples, and PET was found in six. We did not detect PS in any Swedish samples.
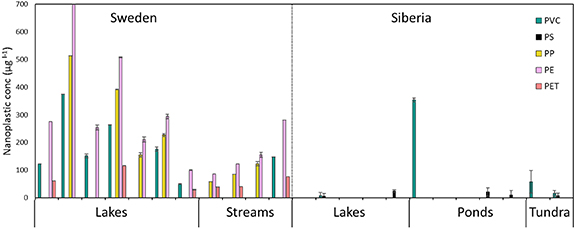
Figure 3. Nanoplastic concentrations in Swedish (left panel) and Siberian (right panel) samples. Different polymer types are represented by different coloured bars. Note that 'Tundra' is flooded tundra. Error bars show standard deviations where replicate analyses were made.
Download figure:
Standard image High-resolution imageTable 1. Overview of sampling sites, showing site type or lake area (if applicable), and the concentrations of all nanoplastics. Errors are standard deviations, for the samples where replicate analyses were performed.
| Site name | Site code | Site type/lake area (ha) | PVC (µg l−1) | PS (µg l−1) | PP (µg l−1) | PE (µg l−1) | PET (µg l−1) | Total (µg l−1) |
|---|---|---|---|---|---|---|---|---|
| Sweden | ||||||||
| Stora Bjurevatten | 10 | 30 | 122 | 0 | 0 | 276 | 61 | 459 |
| F1 | 6 | Headwater stream | 0 | 0 | 59 | 86 | 39 | 184 |
| F2 | 7 | Headwater stream | 0 | 0 | 85 | 122 | 41 | 248 |
| F3 | 8 | Headwater stream | 0 (±0) | 0 (±0) | 123 (±8) | 155 (±9) | 0 (±0) | 278 |
| Gårdsjön inflow | 5 | 3.1 | 374 | 0 | 514 | 699 | 0 | 1588 |
| Gårdsjön outflow | 9 | 31 | 152 (±7) | 0 (±0) | 0 (±0) | 254 (±9) | 0 (±0) | 407 |
| Gaffeln | 1 | 6.2 | 264 (±1) | 0 (±0) | 392 (±1) | 508 (±1) | 116 (±1) | 1280 |
| Gaffeln stream | 2 | Stream draining a lake | 148 | 0 | 0 | 282 | 77 | 507 |
| Stora Hastevatten north | 3 | 3.4 | 0 (±0) | 0 (±0) | 155 (±8) | 211 (±9) | 0 (±0) | 365 |
| Stora Hastevatten south | 4 | 5.1 | 176 (±8) | 0 (±0) | 227 (±5) | 294 (±8) | 0 (±0) | 696 |
| Västersjön | 11 | 28 | 50 (±1) | 0 (±0) | 0 (±0) | 100 (±1) | 29 (±1) | 180 |
| Siberia | ||||||||
| Lake 1, east shore | L01 | 51 | 0 (±0) | 0 (±0) | 0 (±0) | 0 (±0) | 0 (±0) | 0 |
| Lake 10 | L10 | 4.2 | 8 (±11) | 6 (±9) | 0 (±0) | 0 (±0) | 0 (±0) | 42 |
| Lake 1, north shore | L02 | 51 | 0 (±0) | 0 (±0) | 0 (±0) | 0 (±0) | 0 (±0) | 0 |
| Lake 1, south-west shore | L04 | 51 | 0 (±0) | 0 (±0) | 0 (±0) | 0 (±0) | 0 (±0) | 0 |
| Lake 8 | L08 | 14.1 | 0 (±0) | 24 (±5) | 0 (±0) | 0 (±0) | 0 (±0) | 24 |
| Pond 1 | P01 | 0.010 | 354 (±7) | 0 (±0) | 0 (±0) | 0 (±0) | 0 (±0) | 354 |
| Pond 11 | P11 | 0.006 | 0 (±0) | 0 (±0) | 0 (±0) | 0 (±0) | 0 (±0) | 0 |
| Pond 2 | P02 | 0.004 | 0 (±0) | 0 (±0) | 0 (±0) | 0 (±0) | 0 (±0) | 0 |
| Pond 3 | P03 | 0.016 | 0 (±0) | 21 (±15) | 0 (±0) | 0 (±0) | 0 (±0) | 31 |
| Pond 8 | P08 | 0.014 | 0 (±0) | 11 (±16) | 0 (±0) | 0 (±0) | 0 (±0) | 33 |
| Tundra 5 | T5 | Flooded tundra | 58 (±41) | 0 (±0) | 0 (±0) | 0 (±0) | 0 (±0) | 87 |
| Thermokarst 2 | TK2 | Thawing permafrost | 16 (±11) | 7 (±10) | 0 (±0) | 0 (±0) | 0 (±0) | 45 |
At the Swedish site we were unable to discern any empirical relationships between plastic concentrations and waterbody properties (lake surface area, catchment area, water retention time) or chemistry (pH, dissolved organic carbon concentration) but some polymer-specific patterns in spatial distribution were observed. PVC was not found in any of the three headwater streams, which also showed relatively lower concentrations of PP and PE (table 1, figure 3): mean concentrations of these two polymers were only 63% and 45% of the mean of all samples, respectively. This may indicate that trees and soil in the surrounding forest may have a role in retaining deposited plastics and limiting their subsequent transfer into streams. Intriguingly, PET was entirely absent from the chain of sampled lakes (figure 1, sites 3, 4, 5, 9) despite PET being detected in three streams that enter the lake chain (sites 2, 6, 7). This could perhaps be assumed to point towards burial of PET during lake sediment deposition, which can be an efficient sink process for microplastics in aquatic sediments [34]. Although PET is denser than water, for nanoplastics Brownian motion dominates and particles may either simply float or be subject to extremely slow vertical transport (e.g. 7 cm yr−1 for PVC) making sediment burial an unlikely sink process [35]. In lab experiments it has been shown that photodegradation is capable of fully or partially photochemically oxidising PS (and therefore potentially other polymers) to carbon dioxide or dissolved organic carbon [36]. However, the potential importance of this mechanism in breaking down nanoplastics (NPs) in our high-latitude study sites is unknown, but likely to be minor, especially considering that real-world NPs will likely be somewhat protected from sunlight by attached colloids. Another possible degradation pathway is the reaction, and breakdown, of NPs with aqueous hydroxyl radicals [6]. Spatial concentrations of PP were variable; although PP was present in much of the Gårdsjön catchment, it was not detected at the catchment outflow, nor the next lake downstream (Stora Bjurevatten) which also receives water from other lakes and rivers we did not sample. As for PET, this raises the possibility of degradation or burial of PP within lakes, but due to the aforementioned uncertainties and inefficiencies of these processes this is simply speculation, especially considering that PP is less dense than water and therefore unlikely to sink. PP was also absent from Västersjön, which is situated in an entirely separate watershed and, unlike the other sites, has a large number of dwellings in its immediate vicinity. Thus, direct local contamination is unlikely to be a pathway for PP to enter waterbodies in this area.
We detected PVC in four (mean = 109 µg l−1) and PS in five (mean = 15 µg l−1) of the 12 Siberian sampling sites—the average NP concentration was 51 µg l−1 (table 1, figure 3). No traces of PP, PE or PET were found. Both PVC and PS were present at very low concentrations (<10 µg l−1) in one lake (L10), and PS was also detected (24 µg l−1) in the adjacent, but hydrologically unconnected lake, just 200 m away. One pond had very high concentrations (354 µg l−1) of PVC (higher than any of the Swedish sites where the maximum was 264 µg l−1), whilst two other ponds had very low PS concentrations. The high-PVC pond formed following a plant removal experiment in 2007 where monitoring is ongoing [37, 38] so it may be that plastic contamination from long-term research activity has occurred. Similar contamination may explain the moderately high (58 µg l−1) PVC concentration detected in a sample taken from flooded tundra. This flood washed through the nearby research campsite and also covered some infrastructure associated with a weather station and eddy covariance flux tower [39]. Low concentrations of PVC (16 µg l−1) and PS (7 µg l−1) were also found in water draining a small thermokarst slump. The most probable explanation for the presence of nanoplastics in water directly draining from material that has previously been frozen for >50 000 years [40] is that overland flow is collecting plastics that have been deposited on the terrestrial surface rather than indicating the presence of nanoplastics within the permafrost.
Quantitative studies of NPs in the environment are rare when compared to microplastics, but some comparisons can be made with literature data which show our concentrations are of the same magnitude as other measurements. For example, a concentration of 241.8 μg l−1 was reported for PS in a UK peri-urban river [27], and concentrations of NPs in alpine snow range 10–300 μg l−1 [41] In some cases, promising analytical methods that perform well on commercial standards fail to detect NPs in environmental water samples presumably due to their low concentrations [42, 43]. At our Swedish site, the most abundant polymer was PE. Measurements from the North Atlantic Gyre also showed that PE was the dominant polymer found in microplastics but intriguingly comprised only 4% of NPs, with PVC being the most common polymer instead (PS and PET were also detected) [44]. This hints at the possibility of contrasting responses in the accumulation and degradation of different polymers between marine and inland waters. PS, PVC and PE have also been detected as NPs in sand water extracts on an island exposed to the North Atlantic Gyre [25].
2.2. An aerial origin of nanoplastics
Nanoplastics could enter surface waters at the study locations via three pathways: soil, water or air. At the Swedish site, there are no obvious local sources that could directly discharge such a variety of plastics into the soils or waters. The land use is almost exclusively forest, with exceptions of a small number of dwellings (∼50 and 80, respectively) within the catchments of Stora Bjurevatten and Västersjön. There are no agricultural fields that, if present, could contribute large inputs of PE (e.g. via agricultural PE foil). Some PET could possibly arrive via local recreational activity and associated synthetic clothing [20]; a long-distance hiking trail (Bohusleden) runs through the Gårdsjön catchment, and some local residents fish on Lake Gårdsjön. It is unlikely that these small-scale activities are responsible for the widespread and relatively high concentrations of aquatic nanoplastics. Thus, we suggest that the measured nanoplastics at the Swedish site arrive via atmospheric deposition. Supporting this is the fact that lower concentrations of PP and PE were found in the three headwater streams, alongside the complete absence of PVC. These streams are predominantly groundwater fed [45]. In forest ecosystems, it is conceivable that the high leaf surface area of the trees might act to remove nanoplastics from the air; a similar mechanism to the 'forest filter effect' [46]. Nanoplastics deposited on the surfaces of trees will then be transferred to the soil (via rainfall, litterfall, etc) [47] where some will likely be retained (either temporarily or permanently), then migrating into groundwater, and subsequently leaching into stream water [48]. This soil retention could partially explain the lower concentrations of nanoplastics, and absence of PVC, in our headwater streams. PVC is denser than PP and PE, and it could be assumed that PVC is therefore preferentially retained in the soils. However, PET is also as dense as PVC, and yet was found in the streams; we have no explanation for this discrepancy. In contrast to the headwater streams, the larger areas of the lakes provide a substantial surface for direct atmospheric deposition (but also the potential for a larger dilution effect); e.g. for the sampled lakes within the Gårdsjön catchment, lake surfaces occupy 20%–30% of total subcatchment area.
We performed dispersion modelling of nanoplastics for both sites (see the section 3.4 in the Materials and Methods) to make inferences on the origins of nanoplastics. However, the mechanics of nanoplastic dispersal are somewhat unknown, and are potentially inherently different to microplastic dispersal [35]. We therefore used different parameters to microplastic dispersion models [49], e.g. a longer atmospheric lifetime, as nanoplastics are assumed to stay airborne for longer [50]. Nevertheless, the appropriateness of our dispersion model to nanoplastic transport is uncertain, and should be considered a 'back of the envelope' attempt at understanding sources and pathways. The backward trajectory of particle movements for the Swedish site indicates that the likely sources of the nanoplastics are within north-west Europe (figure 4). This is in agreement with research demonstrating that acidified lakes waters [51] in the area were caused by moderately high levels of atmospheric acid deposition [52], the majority of which was the result of long-range pollutant transport from industry in the UK and central Europe [53]. Long-range atmospheric transport of microplastics has been demonstrated over distances of hundreds and even thousands of kilometres, and modelling suggests that nanoplastics can be transported over greater distances [12, 14, 18, 20, 54–56]. Thus, it is clear that atmospheric transport is extremely important in the global plastic cycle. The wide variety of nanoplastics measured could have come from many point sources within the footprint area (e.g. urbanised and industrially developed western Europe). However, there is a waste-to-energy plant 40 km south of the catchment, on the boundary of the prevailing wind direction and within 90% of the wind trajectory, which could be acting as a regional point source. Although waste-to-energy plants have air filters, possible nanoplastic emissions have never been investigated.
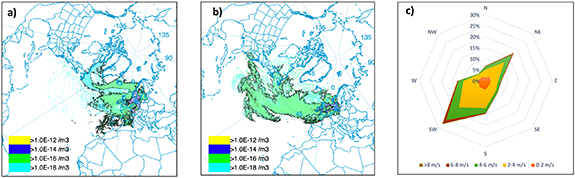
Figure 4. HYSPLIT dispersion model (ten days backwards, 200 nm particles emitted at 50, 100 and 500 m above ground) and wind rose of seasonal variation in air regimes at the Swedish site. (a) mid-December 2016, (b) mid-June 2017 (c) wind rose for the year 2016/17.
Download figure:
Standard image High-resolution imagePE is the dominant nanoplastic type at the Swedish site and was even found in the groundwater-fed streams. One explanation for this is that PE is the commonest plastic in use in Europe, and large volumes of it are used for single-use packaging material, which are subsequently disposed of. Simply opening such packaging can generate the release of microplastics [57]. After disposal, PE might fragment into micro- and nanoplastics via various natural and industrial processes (incineration, UV light-induced fragmentation, reactions with ozone and hydroxyl radicals, weathering, mechanical and biodegradation [3–7] etc). The absence of PE in the Siberian samples and in other analyses from the remote Alps [21] suggests the possible dominance of a local source. In agreement with this idea, there is a major PE producer 12 km to the west of the Swedish sites, on the boundary of the prevailing wind direction.
In Siberia only PVC and PS were detected. The Siberian site is far away from large urban areas (∼1200 km to the nearest city, Yakutsk, which falls outside of the HYSPLIT dispersion footprint, figure 5) which typically act as emission sources of atmospheric plastics (figures 2 and 5). However, some smaller cities (e.g. Norilsk, ∼2100 km to the west, population 180 000) do fall within the far reaches of the footprint. As discussed earlier, the high-PVC concentrations observed in some locations here are plausibly the result of local contamination from regular visitors to the site over several years. However, the potentially contaminated sites showed only PVC, and no PS. Because PS was found in trace amounts in other ponds and lakes, at a distance of up to 4 km from the camp, it seems likely that direct local contamination is not the source of PS. Within the wider local area there are sparsely scattered hunting and fishing camps, and a settlement with a population of ∼2000 is 30 km away. Additionally, within several hundred kilometers there are several more settlements of similar size, as well as abandoned mining stations, which could act as sources. We therefore assume that PS is transported to the site via aerial deposition; other studies have concluded that this is a viable transport pathway for plastics to reach remote sites [12, 14, 58]. The presence of PS and PVC in water draining a thermokarst slump also lends weight to the atmospheric deposition hypothesis by suggesting that plastic is deposited to both terrestrial and aquatic surfaces. Although we assume that nanoplastics at the Siberian site originate from terrestrial sources, we cannot rule out an oceanic source. Marine waters are capable of ejecting plastics through a process of bubble burst and wave action, with the ejected plastics then being available for wind transport [59, 60]. Our site is just 150 km from the coast and the dispersion models show that particles do arrive at the site from above the ocean (figure 5), and so we acknowledge that this is also a viable route for plastics to enter these waterbodies. An alternative explanation is that plastics arrive via aerial deposition following the burning of rubbish [58] at the research camp. Alongside the aforementioned flooding, this could also explain the presence of PVC in the sample taken from flooded tundra near the camp. However, several of the ponds closest (<1 km) to the camp had no detectable nanoplastics in their waters. It could be that the prevailing wind carried smoke and associated plastics away from the ponds and lakes (which are west/north-west from camp), or that the combusted material does not form nanoplastics. The presence of PS in the Siberian, but not the Swedish, samples is unexpected, but we note a recent study that found PS microplastics in Arctic snow samples, but none in urban snow [14].
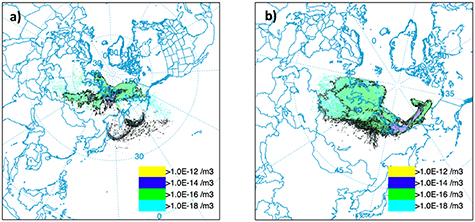
Figure 5. HYSPLIT dispersion model (ten days backwards, 200 nm particles emitted at 50, 100 and 500 m above ground) of seasonal variation in air regimes at Siberian site (a) mid-December 2016, (b) mid-June 2017.
Download figure:
Standard image High-resolution image
2.3. Conclusion
Nanoplastics were detected in every sampled stream and lake of a forested catchment in south-west Sweden. We detected PVC, PP, PE and PET in lakes with dwellings in their catchments, and in those without any habitation in the vicinity. We also detected nanoplastics in remote Siberian waters, although concentrations were lower, only PVC and PS were present, and for one lake and two ponds we detected no nanoplastics. Our data support the assumption that, although plastic particles can be carried over long distances from their source [20], concentrations at a particular location are predominantly derived from diverse regional and local sources (although measurements from potential sources are clearly needed in order to properly test this). If this assumption is correct, then atmospheric nanoplastic concentrations may be subject to sizeable spatial and temporal variation locally, regionally and globally. Therefore, our data suggest that nanoplastics could be present in a very large number of global waterbodies, including urban waters, rural waters, and even remote waters; the sources of these plastics could be deposition from distant sources in addition to local contamination, but models of long-range nanoplastic transport are currently imprecise, and need extensive refining to better identify sources. The implications of a potentially ubiquitous global nanoplastics load for aquatic ecosystem functioning remain largely unexplored, but nanoplastics have different effects when compared to larger plastic fragments [11, 31]. A full understanding of how nanoplastics affect aquatic environments is needed, alongside more concentration measurements, in order to assess the impact of this hidden anthropogenic pollutant.
3. Materials and methods
3.1. Swedish sampling
Sampling took place on 19 August 2017 in the Gårdsjön research catchment and surrounding area in southwest Sweden. The catchment altitude is 100–170 m ASL, and the climate is maritime temperate with an annual precipitation for 2017 of 1145 mm (data from SMHI's Komperöd site [61], 600 m from Lake Gårdsjön). The catchment has been extensively studied, particularly in relation to the effects of acid deposition on ecology and biogeochemistry [62, 63], and both the terrestrial and aquatic components of the system have been exceptionally well-characterised [51, 64]. It is 12 km from the coast, and thus has been subject to moderately high levels of atmospheric acid deposition [52], the majority of which is the result of long-range pollutant transport from industry in the UK and central Europe [53]. This deposition resulted in acidified lake waters [51] that have historically been managed by liming [65]. All lakes within the catchment are oligotrophic and land use is forest with Picea abies (Norway spruce) and Pinus sylvestris (Scots pine) being dominant. Soils are thin and predominantly podzols, with outcrops of bedrock, and approximately 10% peat cover [51]. At the time of sampling Swedish Meteorological and Hydrological Institute modelled runoff was 1.33 mm d−1, which is the 58% of the cumulative flow distribution (www.smhi.se/data/hydrologi/vattenforing). Stream flows were increasing on the sampling date due to an earlier rain event.
There are no settlements within the Gårdsjön catchment, and only two dwellings: one holiday cottage with no road access 70 m from Lake Gaffeln (a headwater lake) and the research cabin at the outflow of the catchment, with no permanent residents. Our project also considered two other lakes just outside the Gårdsjön catchment: Stora Bjurevatten and Västersjön. The surrounding land of Stora Bjurevatten is forested, but in the catchment, there are approximately 50 dwellings plus a negligible amount of farm land (∼10 ha), whilst there are approximately 80 dwellings scattered immediately around Västersjön at a distance of 50–200 m from the lake, as well as a small road along one shoreline. The nearest town is 10 km to the west (Stenungsund, population = 10 000) and the city of Gothenburg (population = 600 000) is 40 km to the south.
Within the Gårdsjön catchment we collected ten surface water samples: four from streams and six from lakes. These sites comprised two locations within a headwater lake (Stora Hästevatten, which is divided into two separate waterbodies by a causeway); the other headwater lake (Gaffeln) and the stream draining it; the main inflow to Lake Gårdsjön (draining these lakes plus one additional lake, Lilla Hästevatten); the other three permanent streams flowing into Gårdsjön; and the lake outflow. We also sampled the next lake downstream of Gårdsjön, Stora Bjurevatten, and one lake in an adjacent catchment (Västersjön) with the intention of extending the trophic gradient of sampling sites to include mesotrophic systems. Lake samples were collected at outflows (including the culvert separating the divided northern and southern basins of Stora Hästevatten) where access permitted; exceptions were Lake Gaffeln, where water was sampled from an accessible shoreline location approximately 100 m from the outflow, and Stora Bjurevatten where we sampled from a point on the eastern shore. The Gårdsjön inflow sample was collected next to a bridge over the short section of channel between Gårdsjön and Lilla Hästevatten and can thus also be considered representative of the outflow from this lake. The three small inflow streams (F1, F2 and F3) were sampled at established v-notch weirs and the remaining stream sample (Gaffeln Stream) was taken from the lowest point with a defined channel before flow enters a wetland downstream of Stora Hästevatten.
All analyses on the Swedish samples were originally conducted for an experiment investigating dissolved organic matter (DOM) composition and reactivity [66]. Water samples were collected by hand (wearing no gloves) and were filtered in-situ with PE syringes (note that the same type of syringe was used for treatment of lab blanks) and 0.45 µm cellulose nitrate filters (pre-rinsed with lake/stream water) and stored in 100 ml glass bottles (also pre-rinsed with filtered lake/stream water). Samples were stored in the dark at 4 °C at the research cabin, before being transported in a cool box to the laboratory where they were again stored in the dark at 4 °C until analysis.
3.2. Siberian sampling
Sampling took place on the 16th and 17th of July, 2017 in the Kytalyk Nature Reserve in the Indigirka River lowlands in north east Siberia. The site is 10–40 m ASL and the climate is Arctic, with annual precipitation of 232 mm and mean annual temperature of −13.8 °C [67]. The landscape is oligotrophic tundra with thaw-induced drained lake basins and a Yedoma ridge [40]. The site has been well studied in relation to greenhouse gas emissions, vegetation communities, and soil organic matter [37, 40, 67]. In autumn 2016 there was an additional 75–100 mm of precipitation relative to the 2009–2017 average. This resulted in the Indigirka River spring melt runoff lasting from May until mid-July 2017 compared to its usual end in June [68, 69]. Part of the study region was inundated by the Indigirka River, although this inundation only affected site Tundra 5. The other sites were impacted by the increased winter precipitation but were not inundated by the Indigirka River.
There are no settlements in the area. There is a research station/camp that has 10–30 visitors per year. The camp consists of four cabins (two for local hunters and fishing, two for research visitors) and a small educational centre associated with the nature reserve. Rubbish and human waste are disposed of by burning with petrol. Samples were collected from the shorelines of three lakes (one large thermokarst lake and two small lakes), five ponds, a surface rivulet draining from thawing permafrost, and flooded tundra (site Tundra 5). At the largest lake (51 ha), three samples were collected, each from a different shoreline, but all other sites were sampled at only one location.
Siberian samples were collected by hand (wearing no gloves) and were filtered in-situ using 0.7 µm pre-combusted GF/F (glass microfibre) filters (pre-rinsed with sample water) and stored in 15 ml PP tubes (also pre-rinsed with filtered sample water) with PE caps. Note that no PP/PE was detected in any of these samples, thus no plastic contamination occurred from the tubes. The filter housing was made of Polysulfone (which our method does not detect), PP, and silicone, and therefore no contamination occurred during filtering. Samples were stored in the dark at 4 °C at the research station before being transported in a cool box to the laboratory where they were stored in the dark at 4 °C until analysis. DOC concentrations were measured on an Aurora 1030 TOC Analyzer (OI Analytical, Texas, USA).
3.3. TD-PTR-MS analysis
For the nanoplastic analysis, aliquots of sample were filtered for a second time (i.e. they had already been filtered at 0.45 µm or 0.7 µm in the field) with 0.2 µm Polytetrafluoroethylene (PTFE) syringe filters (syringes were made of PE with rubber stoppers). The procedural blanks were exposed to the same potential impurities as the samples: i.e. the same vials and the same syringes and filters were used. Samples of filtrate (0.5 ml) were then subjected to thermal desorption proton transfer-reaction mass spectrometry (TD-PTR-MS) using the method described in Materić et al (2017 and 2020) [70]. This method provides detailed information on the molecular composition of volatile and semi-volatile DOM in the sample; it gives both the molecular weight and the concentration of molecules up to a size of ∼500 m z−1. Briefly, a low-pressure evaporation/sublimation process was used to remove the sample water, leaving behind residues of organic matter. Samples were then thermally desorbed by ramping the temperature up from 35 °C to 350 °C (at a rate of 40 °C min−1) and measured on a PTR-TOF 8000 instrument (IONICON Analytik, Innsbruck, Austria). This assures complete thermal desorption of the sample as shown in thermograms of our method paper [21]. Raw data of all the measurements in this work are available in the permanent reposition (see the SI available online at stacks.iop.org/ERL/17/054036/mmedia). During the optimisation of the system, blanks were analysed to minimise contamination: system blanks (clean vials), dry blanks (clean vials exposed to the low-pressure evaporation/sublimation process) and ultrapure water blanks (vials containing 0.5 ml of HPLC water, filtered using the same filters used for the samples, then exposed to the low-pressure evaporation/sublimation process). Following optimisation all samples were analysed, interspersed with ultrapure water blanks (procedural blanks) every 3–4 samples. The mean signal generated from the blanks was subtracted for each ionic mass detected in the samples. The detection limit was calculated as three-sigma of the ultrapure water blanks and ion signals below the detection limit were excluded. Thus only reliable ions were considered for further analysis. For the analysis of the Swedish samples, five samples were analysed in duplicate, whilst for the Siberian samples all samples were analysed in triplicate.
All the steps of the data analysis (including all the mass spectra, subtractions, detection limit calculation, and final mass spectra) are provided in the permanent repository (see the SI). Further details on the analysis are provided in Peacock et al [66], where the PTR-MS data were used to investigate the molecular composition of DOM.
Details about data analysis, plastic fingerprinting, quantification and quality control are based on our previous work [21, 41, 70–74] and are available in supplementary material.
3.4. HYSPLIT model
Hybrid Single Particle Lagrangian Integrated Trajectory (HYSPLIT) dispersion modelling was used to calculate the footprints [75]. We modelled dispersion of 200 nm particles (spherical, 1 g cm−3 density) from the study sites 240-hour backward in time, with a frequency grid of 1.0 × 1.0°. Note that 240 h is at the upper limit for the atmospheric lifetime of black carbon/PM2.5 (5–10 days) [76], and considerably greater than microplastic lifetime in the atmosphere (0.04–6.5 days) [49]. The particles were dispersed continuously at 50, 100 and 500 meters above the surface. We set the dry deposition to 0.034 cm s−1 [77, 78] and the wet deposition was kept as the default for HYSPLIT version 5.0.0 (in-cloud and below-cloud equals 8.0 × 10⁻⁵ s−1). The relevant footprints are available in the supplementary data.
Data availability statement
All data needed to evaluate the conclusions in the paper are present in the paper and in the Supplementary Data (including raw files, all the scripts and processing stages of the data analysis) and it is available in the YODA public repository: https://doi.org/10.24416/UU01-X8W0UY.
Acknowledgments
The authors thank four anonymous reviewers for their constructive comments that helped to improve the manuscript.
Funding
The Netherlands Earth System Science Centre (NESSC) research network (Grant Number 024.002.001)
Dutch Research Council (Nederlandse Organisatie voor Wetenschappelijk Onderzoek—NOW) project 'Plastic Air' (Grant Number OCENW.XS.066) and project 'Nanoplastics: hormone- mimicking and inflammatory responses?' (Grant Number OCENW.XS2.078).
Conflict of interest
Authors declare that they have no competing interests.
Author contributions
D M and M P conceived the paper. M P and M F planned and carried out the sampling in Sweden. J D planned and carried out the sampling in Siberia. F M provided wind data for the Swedish site and logistical support for the Swedish sampling. D M, M P and J D analysed the samples. D M performed the plastic fingerprinting. D M and M P wrote the manuscript with ideas and feedback from all co-authors.