
Abstract
In this paper, we will review both past and recent progresses in the generation, detection and application of intense terahertz (THz) radiation. We will restrict the review to laser based intense few-cycle THz sources, and thus will not include sources such as synchrotron-based or narrowband sources. We will first review the various methods used for generating intense THz radiation, including photoconductive antennas (PCAs), optical rectification sources (especially the tilted-pulse-front lithium niobate source and the DAST source, but also those using other crystals), air plasma THz sources and relativistic laser–plasma sources. Next, we will give a brief introduction on the common methods for coherent THz detection techniques (namely the PCA technique and the electro-optic sampling), and point out the limitations of these techniques for measuring intense THz radiation. We will then review three techniques that are highly suited for detecting intense THz radiation, namely the air breakdown coherent detection technique, various single-shot THz detection techniques, and the spectral-domain interferometry technique. Finally, we will give an overview of the various applications that have been made possible with such intense THz sources, including nonlinear THz spectroscopy of condensed matter (optical-pump/THz-probe, THz-pump/THz-probe, THz-pump/optical-probe), nonlinear THz optics, resonant and non-resonant control of material (such as switching of superconductivity, magnetic and polarization switching) and controlling the nonlinear response of metamaterials. We will also provide a short perspective on the future of intense THz sources and their applications.
Export citation and abstract BibTeX RIS

Original content from this work may be used under the terms of the Creative Commons Attribution 3.0 licence. Any further distribution of this work must maintain attribution to the author(s) and the title of the work, journal citation and DOI.
1. Introduction
Since the early days of physics, scientists have been fascinated by the interaction of electromagnetic waves with matter. Developing new sources has been one of the very important factors in exploring novel phenomena in physics and chemistry, enabling linear and nonlinear spectroscopy techniques. While such development at microwave and optical frequencies has been rapidly advanced in the last century, terahertz (THz) technology is relatively new, and has only seen significant progress in the last three decades [1, 2]. Nevertheless, the wide range of possible applications of today's THz technology is stimulating enormous attention from specialists in various fields, such as imaging, sensing, quality control, wireless communication, and basic science [3–9]. The development of this technology depends on realizing efficient and robust sources and detectors. For example, the development of terahertz time-domain spectroscopy (THz–TDS) [10] more than two decades ago opened a new chapter in THz science, initiating great efforts to develop applications to exploit the unique opportunities that THz waves offer. For example, observation of intermolecular vibrations in some chemicals and organic molecules due to the low THz photon energy (∼4 meV at 1 THz) is just one of the broad range of applications [8, 9].
With remarkable advances in THz technology, there has recently been a considerable surge in the research on intense THz sources and their applications. Nevertheless, there is an immediate need to develop nonlinear THz spectroscopy techniques and intense terahertz sources that have the potential to reveal a new category of nonlinear phenomena and explore nonlinear effects in various materials. Intense THz pulses can induce an ultrafast electric- or magnetic-field switching operation at tens of femtoseconds to picosecond timescale, which is much faster than what can be achieved through conventional electronics. The study of such nonlinear phenomena has been enabled through the development of ultrafast nonlinear THz spectrometers [11–14]. In this article, we will review the various techniques developed for generating and detecting intense THz pulses, focusing on laser-based methods. We will then describe several applications of these intense THz pulses, especially in condensed matter physics. Our review covers the evolution in the field, from the very pioneering works up to the most recent advances in the field. Thus, we hope that it would allow researchers, especially the young ones who are starting their academic career in the field, to get quickly aware of such a highly interesting topic. We also wish that this review could serve as a catalyst for researchers to come up with new and original ideas for further advances, as well as to overcome the still faced difficulties in the field.
As described in the paper contents above, our review is organized in three sections. The first section (section 2) covers the various techniques of generating intense THz pulses via optical methods based on employing ultrashort Ti:sapphire laser pulses. We also account for the merits and demerits of each technique and their possible specific applications. The second section (section 3) deals with the detection techniques, the difficulties or limitations that the researchers face when detecting intense THz pulses, and the possible ways to overcome such difficulties. We finally review in section 4 the applications of THz spectroscopy in condensed matter physics, accounting for the carrier dynamics in bulk semiconductors and in two-dimensional graphene, resonant and nonresonant THz-matter interactions and comprehensively providing many examples, and finally in controlling the nonlinear response of metamaterials in the THz frequency range.
2. Methods for generating intense THz radiation
2.1. Photoconductive antennas (PCAs)
A PCA is typically composed of a high resistivity semiconductor substrate with two electrodes fabricated on one face of the substrate. The principle of generating picosecond THz pulses with PCA was demonstrated by Auston et al [15]. In this work, they used a PCA with 10 μm gap size, which was deposited on a thin layer of silicon, biased by a DC voltage and illuminated with ring dye femtosecond laser pulses. There are several unique characteristics of THz pulses generated from PCAs, such as the strong asymmetry in the magnitude of the positive and negative components of the THz field, its quasi-half-cycle nature, and their relatively low central frequencies, typically between 0.05 and 1 THz. For studying nonlinear THz phenomena, such low THz frequencies are advantageous for generating strong ponderomotive potential, which can efficiently drive electrons in many non-perturbative phenomena [16]. Driven by such unique characteristics and stimulated by the rapid development of amplified Ti:sapphire lasers, there have been early efforts to generate intense THz pulses from PCAs. One straightforward method is to increase the aperture of the PCA, and thus large aperture photoconductive antennas (LAPCAs) have been studied to generate intense THz pulses. In fact, it is important to note that the LAPCA was the method used to generate the first laser-based intense (μJ-level) THz pulses, long before the recent attention on intense THz sources and their applications. Through their pioneering work in 1993, You et al used a GaAs LAPCA with a gap size of 3.5 cm, biased at 37 kV and illuminated with a 770 nm laser pulse at 10 Hz repetition rate, generating sub-cycle THz pulses with 0.8 μJ energy and a corresponding peak electric field of 150 kV cm−1 [17].
The strategy to increase the THz yield from LAPCA becomes apparent when analyzing its theory. The mechanism of THz generation from PCAs and LAPCAs can be described by the current surge model [18]. A femtosecond laser pulse illuminates the gap of a semiconductor crystal, exciting carriers in to the conduction band. An external bias field accelerates the carriers up to the overshoot velocity, leading to a transient photocurrent. The transient current, which varies at the picosecond timescale, radiates an electromagnetic field at the surface of the semiconductor (in reflection and transmission). From Maxwell's equations, the THz electric field in the far field is proportional to the time derivative of the transient current, which can be expressed as [19]:

Here J is the current density, Eb is the applied bias field and n is the carrier density. From equation (1), we can see that the THz peak electric field is linearly proportional to the bias field. This linear behavior between the generated THz electric field and the bias electric field has been observed experimentally by many groups using different LAPCAs [20–22]. Therefore, to generate intense THz pulses, one needs to apply the highest voltage as possible between the electrodes.
It is important to point out that LAPCAs differ from other intense THz sources that rely on nonlinear optical process, since the THz energy is extracted from the bias field and not from the laser pulse energy [18]. Indeed, an important saturation process of THz emission from an LAPCA is the screening of the bias field by the emitted THz field that occurs for relatively high excitation fluences [18], which has been observed experimentally using different LAPCAs [6–9, 20–22]. This saturation process also influences the optical-to-THz conversion efficiency η of the LAPCA, which depends on the excitation fluence and the square of the bias field, and is expressed as [23]:

Here, τ is the time duration of the THz pulse, Z0 is the impedance of free space and Fsat is the saturation fluence, which corresponds to the necessary fluence for extracting half of the maximum radiated field [23]. We can write Fsat as [20]:

Here, hν s the photon energy of the excitation wavelength, e is the electron charge and ε, μ, and R are the dielectric constant, the carrier mobility and the reflection of the semiconductor substrate at the excitation wavelength λ, respectively. From equation (2), we can extract the maximum efficiency of the LAPCA, ηmax that is obtained when the LAPCA is excited with an excitation fluence equal to the saturation fluence Fsat [23]:

From equation (4), we can see that the choice of the semiconductor crystal is crucial, since the maximum optical-to-THz conversion efficiency of the LAPCA is inversely proportional to the saturation fluence Fsat, which in turn is inversely proportional to the carrier mobility. As a consequence, the maximum THz efficiency is linearly proportional to the carrier mobility.
The above equations show that for efficient THz yield from LAPCAs, the choice of a proper semiconductor as the substrate would be crucial, as well as the ability to apply high bias voltage Eb between the electrodes. The latter is partially related to the choice of the substrate material, as well as the method for applying the bias voltage. Since the maximum laser fluence that could be used to excite the LAPCA is defined by Fsat, higher THz yield would also require LAPCAs with larger area. Next, we will look in to each of these factors, and the work that has been done to optimize the related parameters to maximize THz yield from LAPCAs.
2.1.1. Substrate material
Historically, GaAs has been the popular choice as the substrate for PCAs, due to its suitable electrical and optical properties. GaAs crystals have very high carrier mobility and a band gap of 1.44 eV, which allows it to be pumped above the band gap with Ti:sapphire lasers. However, its relatively low breakdown field (around 10 kV cm−1) when used as the substrate for LAPCA limits the maximum bias field that could be applied, thus also limiting the maximum intensity of the radiated THz pulse. It should be noted that while high (>100 kV cm−1) bias fields have been used in low-temperature GaAs PCAs [24], such high fields are only possible with small (∼10 μm) gap sizes. For LAPCAs with gaps sizes of few mm, carriers would be accelerated to energies high enough to cause damage to the semiconductor substrate. Another limitation of GaAs LAPCAs is its degradation with usage and subsequent failure [25], resulting primarily from increased temperature due to Joule heating.
Recent studies have focused on overcoming these limitations and to increase the intensity of the THz pulses from LAPCAs. One solution involves the use of a wide bandgap semiconductor with suitable thermal as well as electrical properties. For example, diamond [26], ZnO [27] and GaN [28] semiconductor crystals have been tested in the past. However, these crystals have bandgaps larger than 3.1 eV, which in turn require at least the third harmonic of a Ti:sapphire laser to excite the carriers above the bandgap, thus decreasing their attractiveness. ZnSe is another wide bandgap semiconductor crystal that has been intensively studied. Its 2.7 eV band gap allows the ZnSe LAPCAs to be pumped above the bandgap by the second harmonic (400 nm) of a Ti:sapphire laser [29] and below the bandgap via two-photon absorption with an 800 nm laser pulse [29, 30]. One drawback of ZnSe for use in LAPCA is that it has thermal properties similar to GaAs, which can lead to rapid degradation of the performance of the LAPCA with time. Recently, LAPCAs using 6H- and 4H-SiC semiconductor crystals have also been studied [31], taking notice of its superior thermal quality compared with ZnSe crystals. In this work, they have demonstrated that when the LAPCA is excited with the second harmonic of a Ti:sapphire laser, carrier excitation requires two-photon absorption for 4H-SiC crystals, while 6H-SiC crystals require one-photon absorption. This difference is attributed to the slight difference in their bandgaps, which is 3.03 eV for 6H-SiC and 3.26 eV for 4H-SiC. These studies have also shown that the 6H-SiC is a good candidate for the LAPCA substrate, resulting in 2.3 times higher THz yield under optimum conditions compared with ZnSe crystals.
2.1.2. Bias field
To generate THz pulses with large peak electric fields, simple coplanar stripline LAPCAs (with two electrodes) require large photo-excited surfaces and high-voltage sources that operate in the range of tens of kV, which is difficult to use. To avoid such difficulties, the interdigitated LAPCA is an alternative way to reduce the bias voltage (and thus the requirement for the high-voltage source), while maintaining a large aperture for illumination [32]. Figure 1 shows a schematic diagram of a typical interdigitated LAPCA. In interdigitated LAPCAs, adjacent antennas emit THz radiation with opposite polarity, and thus in the far field, they cancel each other out, resulting in zero or very low THz fields. Therefore, conventional LAPCAs have used methods to cancel out THz emission from every other antenna, such as using a shadow mask to eliminate irradiation of the excitation laser. Interdigitated LAPCAs have many advantages in comparison with simple LAPCAs. They (i) increase the THz efficiency due to the trap field enhancement near the multiple anodes [33], (ii) allow the possibility to apply higher bias fields [34], and (iii) limit Joule heating since the interdigitated structure typically uses a shadow mask that allows the illumination of less than half of the LAPCA [34, 35]. On the other hand, these structures have some limitations. For example, if the gap size is too small (below 100 μm for a GaAs LAPCA), the LAPCA works in the space-charge screening regime, which saturates the radiated field [36, 37]. The application of the shadow mask also limits the maximum efficiency of the LAPCA, since at least half of the total area is shadowed. As a consequence, when one compares the performance of a conventional LAPCA with an interdigitated LAPCA with the same effective area, the same bias field and excited with the same excitation fluence, the conventional LAPCA will radiate THz waves with a larger peak electric field [34]. Despite these limitations, the highest optical-to-THz conversion efficiency obtained with a GaAs interdigitated LAPCA with 5 μm gap size is 2 × 10⁻³ [25].
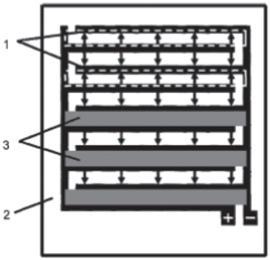
Figure 1. Schematic diagram of the THz emitting metal–semiconductor–metal structure; (1) interdigitated finger electrodes, (2) semi-insulating GaAs substrate, (3) opaque metallization shadowing one electric field direction. The electric field direction is indicated by arrows. Reprinted from [32] with permission of AIP Publishing.
Download figure:
Standard image High-resolution imageSome solutions have been proposed for increasing the performances of the interdigitated LAPCA. For example, Ropagnol et al used a phase mask instead of a shadow mask, to make full use of the total aperture of the interdigitated LAPCA [35]. The phase mask consists of replacing the shadow mask with glass plates positioned on to every other antenna. The binary phase mask results in a time-delayed excitation of the adjacent antennas, which allows subsequent antennas to produce an additive field, thus increasing the THz conversion efficiency. The other benefit of the phase mask is that the timing of THz emission from adjacent antennas could be varied by varying the thickness of the phase mask, thus allowing some simple THz pulse shaping. Another potential solution for increasing the THz conversion efficiency is the use of plasmonic electrodes. Nanoscale plasmonic contact electrodes reduce the average photo-carrier transport path, allowing the collection of a large number of carriers on a sub-picosecond time scale that contribute to increased THz emission [38]. Using this technique increases the radiated THz power by a factor of 50 compared with conventional PCAs. This structure is very promising, and a GaAs interdigitated LAPCA with plasmonic electrodes has demonstrated an exceptionally high efficiency of 1.6% [39]. However, the challenge is to fabricate such plasmonic electrodes over a large area, and to test the generation of intense THz pulses from such structures.
2.1.3. Intense THz radiation from ZnSe interdigitated LAPCA
The various techniques described above have been combined together, to demonstrate intense THz generation from LAPCA. In 2013, Ropagnol et al demonstrated the generation of THz pulses with an estimated peak THz field of 143 kV cm−1, from a ZnSe interdigitated LAPCA excited above the bandgap with 400 nm laser pulses at 10 Hz repetition rate [40]. The total surface of the antennas was 5.5 cm2, and the gap size of the interdigitated structure was 0.6 mm, which ensures operation in the THz-field-screening regime, so that the radiated THz field is not limited by space-charge-screening. A pulsed high voltage source that provides 20 ns pulses was used for biasing the LAPCA. Different masks were used with this LAPCA: (i) a traditional shadow mask, (ii) 0.65 mm and 1 mm thick binary masks, (iii) a mix of shadow masks and phase masks, obtained by exchanging some shadow plates with phase plates. These different masks have allowed the generation of various THz waveforms, from an asymmetric half-cycle pulse to a symmetric single-cycle pulse. Figure 2 shows the different waveforms generated by the ZnSe interdigitated LAPCA covered by the different masks. The maximum energy of these THz pulses was 3.6 μJ when the antenna was covered with a binary mask and biased with a field of 47 kV cm−1.

Figure 2. THz waveforms generated from a ZnSe interdigitated LAPCA excited at 400 nm (a) covered with 0.65 and 1 mm phase mask and a shadow mask and (b) covered by a combination of shadow plates and 1 mm phase plate. THz waveforms generated by the ZnSe interdigitated LAPCA excited at shows the power spectrum with a shadow mask (blue line) and the 1 mm binary mask (red line). (c) and (d) show the THz pulse shapes obtained with the 0.65 mm (c) and the 1 mm (d) binary mask on the ZnSe interdigitated LAPCA. The THz pulse shaping allows the generation of any THz waveforms comprise between an asymmetric half-cycle pulse and a symmetric single-cycle pulse. Reprinted from [40], with permission from AIP Publishing.
Download figure:
Standard image High-resolution imageFollowing this approach, Ropagnol et al further increased the surface of the ZnSe interdigitated LAPCA up to 12.2 cm2. This source generated quasi-single cycle THz pulses with energies of 12.5 ± 0.3 μJ when the LAPCA was covered with a phase mask, and half-cycle THz pulses with an energy of 8.3 ± 0.2 μJ when the LAPCA was covered with a shadow mask. Figure 3(a) shows the scaling of the THz energy and (b) the optical-to-THz conversion efficiency as a function of the optical energy, when the LAPCA is covered with the phase and the shadow mask. At low optical energy, the THz energy follows a sub-linear relationship and then saturates when the optical energy is higher than 15 mJ. Maximum optical-to-THz conversion efficiency of 2 × 10⁻³ with the phase mask and 1.1 × 10⁻³ with the shadow mask is obtained when the LAPCA is excited with 2.5 mJ, 400 nm lasers. The calculated THz field was estimated to be 331 ± 5 kV cm−1. Considering that the median frequency of these THz pulses was 0.28 THz, we estimated the ponderomotive energy of these pulses to be 15 ± 1 eV, which is higher of what can be obtained with a 1 MV cm−1 field at 1 THz [41].

Figure 3. (a) Energy and (b) optical-to-THz conversion efficiency as a function of optical energy for the radiation of THz pulses from interdigitated ZnSe LAPCA with Cr/Au contacts illuminated and biased at 42 kV cm−1.
Download figure:
Standard image High-resolution imageOne 'unsung' characteristic of intense THz sources via LAPCA is its relatively good shot-to-shot stability. There are several reasons behind this. First, THz generation from PCA is basically a linear process when pumped above the bandgap, with one laser photon exciting one carrier in the semiconductor substrate. Second, the LAPCA can be operated in the saturation regime, where THz yield is less affected by changes in the laser intensity. Therefore, instability in the driving laser has less effect on the THz output from LAPCAs, compared with THz generation techniques that make use of nonlinear optical effects. As such, it has been demonstrated that, although time consuming, clean waveforms with low noise could be obtained with intense THz sources via LAPCA, even with relatively low (10 Hz) repetition rates.
2.2. Optical rectification (OR)
OR, another widely used method for intense THz generation, is a second order nonlinear process that can take place in non-centrosymmetric media. Compared with PCAs, THz generation using OR of femtosecond laser pulses is usually much simpler, with no need for external high-voltage power supplies. In addition, OR provides broad bandwidth THz pulses, and to date it has turned into one of the most efficient approach [42, 43], giving rise to extremely high THz pulse energies as well as high electric fields.
In general, OR refers to the generation of quasi-DC polarization when an intense optical beam passes through a nonlinear medium. When using femtosecond laser pulses, the resulting change in the time-dependent nonlinear polarization in the medium may contain many frequency components, which can result in the emission of electromagnetic waves in the THz spectral range. In nonlinear optics, the electric polarization P induced in the medium can be expressed as a power series of the electrical field E:
Here,  is the nth-order susceptibility tensor of the material. The OR process is, to some extent, similar to classical emission of radiation by an accelerating/decelerating charge in a PCA, except that here the charges are in a bound dipole form and the THz generation via OR is related to the second order susceptibility of the material, given by:

Here,  is the frequency difference between two frequency components of the optical pump
  and
and  In the time domain, the temporal THz field is proportional to the second derivative of the change of this polarization with respect to time t:

Ideally, the spectral bandwidth of the generated THz waves depends only on the frequency components of the pump beam. However, in reality, in order to generate high-energy THz pulses with high efficiency, several conditions need to be fulfilled [44]. First of all, in addition to the non-centrosymmetric crystal structure, the medium needs to be transparent at all the frequencies involved, and possess a relatively high damage threshold to tolerate the high intensities of the femtosecond pump beam. Secondly, many other material properties should be carefully considered, such as absorption, diffraction, saturation and phase matching conditions. Among these, the matching between the optical group velocity and the THz phase velocity is one of the most crucial factors for an efficient OR process, determining the optimal conditions of crystal orientation and thickness. THz waves are generated at different positions in the media upon passage of the pump beam, and maximum output is expected when all the waves add up constructively, leading to continually increasing electrical field propagation along the entire interaction depth of the medium. The phase matching condition is given by the following formula [4]:

Here, k is the wave vector depending on the electromagnetic frequency and their corresponding refractive indexes. The coherence length is defined by the interaction length at which the phase change reaches  [5], during which THz waves can have a positive buildup to avoid the effects of phase mismatch:

Here,  and
and  is the coherence length. Based on these factors, one can identify several nonlinear crystals that are suitable for the generation of THz waves via OR. As a related process of OR, the performance of the electro-optic (EO) sampling technique for the characterization of THz pulses depends also on these crucial rules. Some relevant parameters of common nonlinear materials for OR are summarized in table 1 [45–47].
Table 1. Properties of common materials for OR [45–47].
| Crystal | EO coefficient (pm V−1) | Index of refraction | THz index of refraction | THz absorption coefficient ( ) ) |
|---|---|---|---|---|
| ZnTe | r41 = 4.0 (0.633 μm) | 2.85 (0.8 μm) | ∼3.17 | 1.3 |
| LiNbO3 | r33 = 30.9 | no = 2.29, ne = 2.18 (0.633 μm) | no ∼ 6.8, ne ∼ 4.98 | 16 |
| r51 = 32.6 (0.633 μm) | ||||
| LiTaO3 | r33 = r51 = 30.5 (0.820 μm) | no = 2.176, ne = 2.180 (0.633 μm) | no ∼ 6.5, ne ∼ 6.4 | 46 |
| CdTe | r41 = 4.5 (1.00 μm) | 2.84 (0.8 μm) | ∼3.23 | 4.8 |
| DAST | r11 = 160 (0.82 μm) | no = 2.46, ne = 1.70 (0.820 μm) | ∼2.4 | 150 |
| GaSe | 1.7 (0.8 μm) | 2.85 (0.8 μm) | ∼3.72 | 0.07 |
| GaAs | r41 = 1.43 (1.15 μm) | 3.61 (0.886 μm) | ∼3.4 | 0.5 |
Among the various crystals, ZnTe is one of the most widely used media for generating THz pulses, because it satisfies relatively well the phase matching condition: the group velocity of the optical femtosecond pulses generated by widely used Ti:sapphire mode-locked lasers (∼800 nm wavelength) is equal to the phase velocity of the THz radiation propagating within the crystal. For this reason, a very simple collinear experimental setup is sufficient to achieve high-energy THz radiation by using large aperture, energetic pump beams [48, 49]. However, as shown in table 1, the EO coefficient of ZnTe is relatively small compared with other materials, such as LiNbO3 and organic crystal DAST. Moreover, at high laser intensities, two-photon absorption effects become dominant, leading to an increase in the absorption of THz waves due to the generation of free carriers by interband excitation, as well as due to the depletion of the intensity of the pump beam [50]. THz generation via OR in organic crystals such as DAST is currently the most efficient approach [43], but with relatively low laser intensity damage threshold. The nonlinear crystal LiNbO3, on the other hand, has an extremely high damage threshold, and is highly transparent to lasers at 800 nm and 1 μm wavelengths, which are widely available in many laboratories. However, unlike ZnTe and DAST crystal, there is a large mismatch between the group velocity of the optical pump beam and the phase velocity of the radiated THz pulse in LiNbO3. To overcome this problem, the titled-pulse-front technique was thus proposed by Hebling et al [51], which has been well developed in the past few years. In this section, we will first give a brief review of intense THz sources based on large-aperture OR, then discuss in detail the titled-pulse-front technique in LiNbO3, as well as THz generation in DAST and other nonlinear optical crystals.
2.2.1. Large-aperture crystals
The use of large-aperture crystals for intense THz generation is an approach that can reduce saturation effects (due to effects such as two-photon absorption) and minimize damage to the crystal surface induced by the high laser intensity. In the case of 〈110〉 ZnTe crystal, the azimuthal angle dependence of THz radiation energy is essential as well. As shown in figure 4, θ is the angle between the y'-direction [001] of the lab reference coordinates and the polarization vector of the incident optical field.
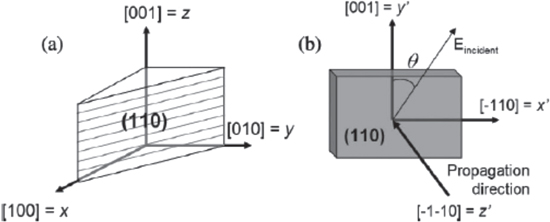
Figure 4. (a) (110) plane in xyz coordinates. (b) Orthogonal coordinates x' y' z' on the (110) plane.  is the angle between the polarization direction of the pump beam and the y'-direction. Copyright 2011 IEEE. Reprinted, with permission, from [47].
Download figure:
Standard image High-resolution imageThe emitted THz field  will be projected on to the reference plane x'y', where x' is the [-110] direction. According to the formula derived for the OR process [47]:

From equation (10), we see that the THz energy has an angular dependence with a maximum value at  corresponding to the polarization direction of the emitted THz beam at
  [47].
[47].
We show in figure 5 a typical experimental setup for large aperture ZnTe THz generation, which was built at the Canadian Advanced Laser Light Source (ALLS) facility, on a beam line providing 800 nm, 40 fs laser pulses with energies as high as 70 mJ per pulse (after the vacuum compressor) at a repetition rate of 100 Hz. The detailed description of the experimental setup is given in [49]. The THz pulse profile is detected by free-space EO sampling using a detector ZnTe crystal, and the delay between the probe pulse and the THz pulse is scanned by using an optical delay stage. The emitted THz energy was measured by a calibrated pyroelectric detector (Coherent-Molectron J4-05), and the image of the THz beam at the focus was observed using a pyroelectric IR camera (ElectroPhysics), so that the THz electric field can be estimated. The azimuthal angle dependence was also studied to verify that the intense THz radiation is generated via OR. Up to 1.5 μJ of THz energy and about 230 kV cm−1 peak THz electric field at focus was measured with this setup, with the THz spectrum covering the range from 0.1 to 3 THz, using ZnTe pumped by a 48 mJ pump beam with a conversion efficiency of 3.1 × 10⁻⁵.
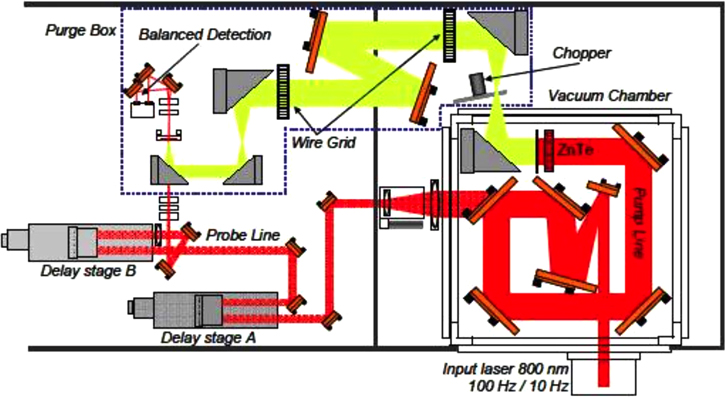
Figure 5. Experimental setup of a high-energy large-aperture ZnTe THz source. The THz waves are generated in a vacuum chamber and detected by the EO sampling technique in a purge box [49].
Download figure:
Standard image High-resolution image2.2.2. Titled-pulse-front lithium niobate source
Despite the high THz energy obtained, the conversion efficiency of the ZnTe emitter was still limited by free-carrier-induced absorption. On the other hand, with the apparent advantage of its high EO coefficient and high damage threshold, OR from titled-pulse-front lithium niobate (LiNbO3) source is now one of the most promising approach for intense few-cycle THz generation, which has been very well developed experimentally [52–54] and theoretically [55–57]. Optical-to-THz conversion efficiency of about 0.35% at room temperature has been reported with this technique, using 800 nm central wavelength pump lasers [54]. By cooling the LiNbO3 crystal down to cryogenic temperatures, energy conversion efficiencies up to 3.8% was achieved with 0.68 ps pump pulses centered at 1.03 μm wavelength [42].
Equation (11) is the phase matching condition in this crystal, which is fulfilled by introducing a tilt angle γ in the pulse front with respect to the phase front, as shown in figure 6(a)


Figure 6. (a) Velocity matching using titled-pulse-front pump beam. A tilt angle  is introduced between the pulse front and the phase front. (b) Experimental setup for THz generation by titled-pulse-front technique in LiNbO3. An optical diffraction grating is used to title the pulse front.
Download figure:
Standard image High-resolution imageThe pulse front of the optical pulse is titled typically using a diffraction grating, and a telescope is then used to image the titled-pulse at the crystal position with an appropriate demagnification ratio M. Figure 6(b) shows a schematic diagram of the setup for ultrafast THz pulse generation using a titled-pulse-front configuration, employing a single lens and a diffraction grating. Moreover, the crystal is cut at  to fulfill the phase matching condition inside the crystal. In this configuration, the angle
  is given by [47]:

Here, m is the diffraction order, N is the grating groove number density,  is the refractive index of the LiNbO3 crystal at the pump laser wavelength and
  is the diffracted angle of the incident beam on the grating.
Typical experimental setups of the LiNbO3 THz source based on the titled-pulse-front technique use an amplified Ti:sapphire laser, which delivers several mJ, femtosecond pulses at kHz repetition rates [47]. It is worth mentioning that the LiNbO3 crystal was 1 mol% Mg doped, so as to avoid the photorefractive effect in the crystal and to reduce THz absorption [58]. Typical tilted-pulse-front LiNbO3 THz sources provide peak electric fields of >200 kV cm−1 in the 0.1–2.5 THz spectral range, with conversion efficiencies of ∼10−3, which is ∼30 times higher than large aperture ZnTe sources.
Several additional methods [42, 53] have been proposed to improve the OR efficiency in LiNbO3, such as (i) cooling of the LiNbO3 crystal; (ii) optimizing the Fourier-limited (FL) pump pulse duration; (iii) reducing the imaging errors by using contact-grating setup. High conversion efficiency is the result of sufficiently long effective THz generation length, which is determined by various loss mechanisms and dispersion. Several techniques have been implemented to the tilted-pulse-front THz source to reduce such unfavorable effects, thus increasing THz output. For example, Mg-doping of the LiNbO3 crystal reduces the photorefractive effect (resulting in lower loss of the pump laser), and cooling the LiNbO3 crystal decreases phonon absorption of THz waves, thus significantly improving the conversion efficiency [42]. Another technique that has been implemented is the optimization of the pulse duration of the driving laser. In the past, relatively short (<100 fs) Ti:sapphire lasers had been used to pump the LiNbO3 THz source. However, studies have shown that a longer, optimized Fourier transform limited pulse could maximize the effective THz generation length, giving rise to higher conversion efficiencies [42, 54, 56]. Another factor that needs to be considered is the sensitivity of the conversion efficiency to the pump imaging errors, which could cause asymmetric intensity profiles as well as huge divergence of the THz beam. Several new configurations have been proposed to overcome these problems, such as using contact-grating setups [56] to eliminate imaging errors and obtain a larger pump area. More recently, optical pump pulses with elliptical beam profiles have also been suggested, so that high conversion efficiency can be preserved in the case of high optical pump energies [57].
Even after incorporating such methods, there is an ultimate limit at which the LiNbO3 crystal could be pumped, which turns out to be much lower than the damage threshold of the crystal or the grating. As the optical pump pulse propagates within the crystal and generates THz photons, a frequency redshift of the optical pump occurs, especially in cases of high conversion efficiency. Such cascaded frequency redshift can further result in a large spectral broadening of the pump beam. Even though cascading effect is responsible for conversion efficiencies that exceed the Manley–Rowe limit, the induced spectral broadening combined with the influence of self-phase modulation effect will prevent further THz generation due to phase mismatching in the presence of group velocity dispersion from material dispersion and from angular dispersion [56].
We show in figure 7 a typical experimental setup used to study these effects and improve the THz radiation energy. In this work, a high-energy 100 Hz repetition rate Ti:sapphire laser was used [54]. Using such a setup, record energy conversion efficiency up to 0.36% has been demonstrated, which saturates for >240 fs pulse durations. A combination of short-pass (f1) (Model FF01-842/SP-50, Semrock) and long-pass filters (f2) (Model BLP01-785R-50, Semrock) was placed prior to the optical compressor 1, to adjust the Fourier transform limited pulse duration. The cutoff wavelength of both filters can be tuned by changing the angle of incident laser. Optical compressor 2 was used to obtain a probe pulse (45 fs pulse width and <0.1 μJ) for EO sampling detection. The emitted THz energy was measured at the EO sampling position (D1) by a pyroelectric sensor. The measured THz energy and the corresponding energy conversion efficiency as a function of the Fourier transform limited pulse duration are shown in figure 8, while the peak intensity and the central wavelength of the pump beam were kept constant during the measurement.

Figure 7. Experimental setup for THz generation from LiNbO3 crystal using longer Fourier-limited pump pulses [54].
Download figure:
Standard image High-resolution image
Figure 8. Measured THz pulse energy and energy conversion efficiency as a function of the Fourier transform limited pulse width [54].
Download figure:
Standard image High-resolution imageTo understand the increase in the THz conversion efficiency as a function of the Fourier transform limited pulse duration due to the cascading effect, a setup as shown in figure 9(a) was built to reveal this asymmetric redshift. Figure 9(b) shows the measured normalized spectra of the pump laser, as a function of the translation detection position x. Results show that the redshift varies with the propagation distance of the pump beam within the LiNbO3 crystal, suggesting that the position and the area of the pump beam on the incident surface of the LiNbO3 crystal should also be adjusted to optimize efficiency. However, despite this high THz energy and conversion efficiency, the maximum peak electric field measured in this experiment is 720 kV cm−1, which is well below the theoretical limit. This is because the cascaded redshift effect induces spatially asymmetric extreme broadening and segmentation of the optical pulse [54, 59]. It has also been experimentally identified that free-carrier absorption of THz radiation due to multi-photon absorption of the 800 nm radiation would also limit the scaling of optical-to-THz conversion efficiencies. Therefore, further theoretical and experimental investigations at high pump intensities are essential to further increase THz output from the titled-pulse-front LiNbO3 THz source.

Figure 9. Measurement of redshifts in the pump beam. (a) Measurement geometry used to measure the redshift. (b) Normalized 2D mapping of the redshift of pump beam as a function of the detector position. The inset (i) and (ii) show two spectra extracted at two detector position [54].
Download figure:
Standard image High-resolution imageIn addition to its use with LiNbO3 crystal, the tilted-pulse-front technique can be also applied to other materials, which is significant for exploring new, highly efficient nonlinear crystals. For example, THz generation in room temperature gallium arsenide (GaAs) crystal using pump laser at a wavelength of 1.8 μm has been reported with the tilted-pulse-front technique [60].
2.2.3. DAST
As we have seen above, high THz energies with THz electric fields exceeding 1 MV cm−1 have been demonstrated from title-pulse-front LiNbO3 sources. However, the spectrum of the LiNbO3 source is typically confined around 1 THz, due to absorption at high frequencies [2] and very high THz electric field is always challenging to reach. Several novel nonlinear organic crystals [43, 61–63] have been explored for high field THz generation. These materials provide low THz absorption and much higher second-order optical susceptibility than room temperature LiNbO3. Typically, the phase matching condition of such organic materials can be fulfilled in a simple collinear geometry with pump wavelengths between 1.35 and 1.5 μm. In addition, owing to the naturally collimated emitted THz waves free of aberrations [64], tight focusing becomes much easier and thus extremely high electric field strengths can be achieved. The experimental setup of THz generation with a 4-N-methylstilbazolium tosylate (DAST) crystal is shown in figure 10(a), in which the THz waveform is characterized using the EO sampling method with a GaP crystal. The disadvantage of these organic crystals is the low laser damage threshold in comparison with mostly used inorganic crystals.
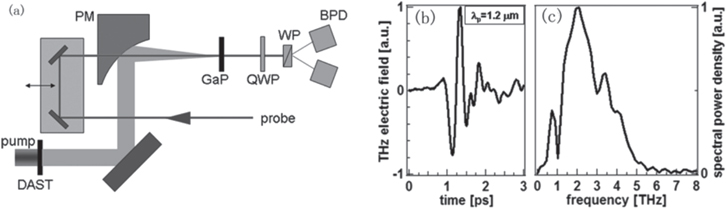
Figure 10. (a) Experimental setup for THz generation from DAST crystal and EO sampling detection with GaP. (b) Temporal profile of THz radiation generated from DAST crystal pumped by 1.2 μm beam. (c) Corresponding THz spectrum. Absorption peak at 1.1 THz is clearly seen (adapted from [61] with the permission of AIP Publishing).
Download figure:
Standard image High-resolution imageThe ionic organic crystal DAST was developed in the '90s and then attracted much attention for its large second order nonlinearity. The optimal pump wavelength that is required for phase matching of OR in DAST for THz generation is at 1500 nm. Therefore, for intense THz generation, an optical parametric amplifier (OPA) pumped by a Ti:sapphire laser is usually used to generate pump beams at this wavelength. High-quality THz beams with maximum electric field of 6.3 MV cm−1 has been demonstrated, with a conversion efficiency of 2.1% at room temperature [61]. However, the THz spectrum is inevitably distorted around 1.1 THz, corresponding to the absorption resonance from transverse optical phonon modes in DAST. The single-cycle THz pulse shape as well as its spectrum is shown in figures 10(b) and (c), where absorption at 1.1 THz could be clearly seen [61].
To solve this phonon absorption problem at 1.1 THz, one method is to cool the crystal, to suppress the vibration modes and reduce distortion. Another way is by making an appropriate modification of the crystal or by exploring other similar highly nonlinear organic crystals, such as OH1. The organic nonlinear crystal DSTMS (4-N, N-dimenthylamino-4'-N'-methyl-stilbazolium2, 4, 6-trimethylbenzenesulfonate) has very large second order nonlinear susceptibility and best phase matching condition for OR at a wavelength of 1500 nm, similar to DAST. Furthermore, DSTMS has several unique advantages, including significant reduction of phonon absorption at 1.1 THz, due to minor changes of substituents of the counter-anion to DAST. DSTMS also has favorable crystal growth characteristics [65] to fabricate large-area bulk crystals. Vicario et al [66] have recently proposed a large-size partitioned DSTMS crystal with negligible influence of the discontinuity in the whole crystal surface. This new approach opens up the avenue for further scaling up the THz field strength and energy radiated from such nonlinear organic crystals. Another promising organic crystal for THz generation is 2-[3-(4-hydroxystyryl)-5.5-dimethylcyclohex- 2-enylidene] malononitrile OH1. The velocity-matching condition for pump wavelength is in the range of 1200–1460 nm, resulting in high efficiency THz generation from 0.3 to 3 THz.
In general, Ti:sapphire lasers with central wavelength at 800 nm is not suitable for realizing phase matching condition for these organic crystals. However, by utilizing other nonlinear susceptibility coefficients, THz generation from DAST and DSTMS pumped at 800 nm wavelength is feasible, but with rather low energy conversion efficiency [67]. An OPA system is typically used to generate pump wavelengths between 1350 and 1500 nm, but the generated pump beam is always affected by drawbacks of using an OPA, such as instability and beam profiles irregularities [68]. To overcome the non-uniformity of the pump beam and the irregularity of a typical thin organic crystal, Shalaby et al have proposed an optimization method based on pump wavefront-divergence control combined with an improved imaging system to significantly enhance the generated THz beam quality [69]. Furthermore, instead of using OPA, Vicario et al have demonstrated a new approach by utilizing the direct output of a femtosecond Cr:forsterite laser at central wavelength of 1250 nm [43, 68] and peak fields of more than 42 MV cm−1 and 14 T were reached using DSTMS crystal pumped by this Cr:forsterite laser.
2.3. Air plasma THz sources
Intense THz wave can also be generated in air by photoionization with intense laser pulses. This method has the advantage of being able to use laser intensities that are higher than the damage threshold of nonlinear crystals or PCAs, since the nonlinear medium is an induced-plasma in air. The first demonstration of this technique was performed by Hamster et al [70, 71]. In these studies, the authors focused femtosecond laser pulses with energies up to 50 mJ to ionize gas molecules. They linked the emitted THz transient to the ponderomotive forces at the focus of the intense laser beam. Those forces cause only the electrons to be accelerated and expelled from the focal point, whereas the inertia of the positive ions prevents them to move regarding the ultrashort laser pulse duration. As a result, the expulsion of charges leads to intense and broadband THz radiation.
Later, Löffler et al [72, 73] used electrodes to apply a DC bias voltage at the position of the focused laser beam, and vertical to the direction of laser propagation. The DC electric field accelerates the electrons of the plasma and leads to increased coherent THz pulse amplitude along the plasma. This technique is called the DC-bias method. Nevertheless, the electrical breakdown in air caused by the high bias voltage limits the scaling up of the THz field.
At the same period, Cook et al [74] proposed another method to generate higher THz fields, based on the combination of the fundamental pulse laser (ω) and its second harmonic (2ω). Called the second harmonic bias method [75], this enhanced the amplitude of the THz field by forty times compared with the single-color technique [70]. We show in figure 11 a schematic diagram of the experimental setup used with this technique. An 800 nm femtosecond pulse from an amplified Ti:sapphire laser is focused into a gas to form plasma. A second harmonic generation crystal, typically beta barium borate (β-BBO), is placed before the focal point to generate 400 nm wavelength light [74–81]. Since the THz generation process is sensitive to the relative phase between the two colors, this phase difference can be adjusted by translating the crystal position and making use of the dispersion of air, or by using phase shifting glass plate. Early works on this technique demonstrated maximum THz fields reaching 150 kV cm−1 [79], and broad bandwidths reaching 75 THz [80].
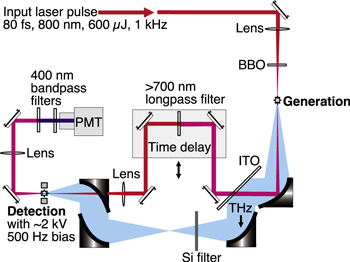
Figure 11. Schematic diagram of the experimental setup for coherent THz generation based on air plasma and air biased coherent detection (ABCD) that will be presented in the next chapter. Reprinted from [144] with the permission of AIP Publishing.
Download figure:
Standard image High-resolution imageOriginally, the mechanism was described as four-wave OR with a third-order nonlinear process [74–78] χ(3)(ΩTHz: 2ω + ΩTHz, −ω, −ω), where ΩTHz is the frequency of the emitted THz wave. Following the four wave mixing theory, the THz field is proportional to:

Here, φ is the relative phase difference between the fundamental and the second harmonic frequencies. However, the third order nonlinearity emerging from either bound or free electrons in the plasma due to the ponderomotive or thermal effects is too small to explain the observed THz field strength [75]. Furthermore, the existence of an intensity threshold for THz generation has been reported.
To explain the intense THz emission from second harmonic biased air-plasma sources, a semiclassical photocurrent model has been developed [79–81]. This model describes the intense THz radiation as the result of bound electrons undergoing rapid tunnel ionization, when the Coulomb barrier is suppressed by the symmetry-broken two-color laser field. The resulting free electrons and the positive charged ions form plasma. The electrons freed by the laser field can form a directional transverse current. Since the laser pulses are on the femtosecond time scale, this current surge can emit THz frequencies. In this case, the radiated THz field depends on the electron current density inside the plasma, given by  where
where  is the electron charge,
  the electron density and
  is the velocity of those electrons. The THz field generated by the pump laser field can be described to be proportional to the derivative of the current density, that is

Here, is the electron mass and
  the laser electric field, composed of two colors,
  and
and  with parallel polarization. In this case, the laser field can be defined as

Here, φ is the relative phase difference between the two colors of the laser. The electron density is calculated as the sum over the N ionization states of the gas molecules

Here,  is the density of the
  times ionized gas molecules, defined as

Here,  is the ionization rate of the ith ionization state. Wi depends only on the laser field, as the ionization takes place through photoionization. Depending on the femtosecond laser parameters, THz yield and spectrum are numerically simulated by taking into account tunneling ionization and laser-induced electron motion [80, 81]. This first step allows the calculation of the electron density
  Then, the THz field can be calculated from equation (14). Kim et al obtained good agreement between their simulated model and their experiment results [80].
In 2009, a third model has been developed to explain in even more detail the intense THz generation from air-plasma [82]. The model includes two steps to explain the THz generation process. The first step consists of the treatment of the ionization process quantum mechanically by numerically solving the time-dependent Schrödinger equation, which describes the formation and the acceleration of electron wave packets. The second step, when the laser–atom interaction is solved, describes the interaction between the electron wave packets and the surrounding gas. This part can be treated analytically. The electrons are scattered by the gas atoms, thus disrupting their original trajectories, giving rise to coherent Bremsstrahlung emission at THz frequencies. The complete description of this model has been developed in past works [82, 83]. However, the physical mechanisms behind the generated THz is still debated, as the last two models fit well the experimental results, but the full treatment of the spatio-temporal dynamics behind THz generation through air plasma is much more complicated, requiring to take in to account nonlinearity effects induced by the plasma [84].
The most recent improvement in high-intensity THz air-plasma sources is the increase in the longitudinal length of the plasma. This has been realized using laser filamentation, which is known to occur due to nonlinear effects, such as optical Kerr effect, defocusing due to the plasma itself, nonlinear losses and dispersion [85]. The extended length of the plasma leads to coherent build-up of the THz radiation, and can reduce drastically the divergence of the conical THz beam profile [86, 87]. A full description of this phenomenon has been proposed [88, 89] based on the transient photocurrent model [79, 81]. The most recent theory about laser filamentation, which has been confirmed by experimentations, tends to prove that the THz emission on the propagation axis is due to neutrals a purely Kerr effect when the photocurrent produced by plasma contributes to the intense conical THz emission without Kerr nonlinearity contribution [90].
The first demonstration of THz generation from air filaments was realised with a one-color laser filament by D'Amico et al [91]. This was then followed by the first use of two-color laser filaments, consisting of multiple plasma filaments with a coherent superposition of the TH waves [92, 93]. Wang et al [94] reported higher THz field intensities by using chirped rather than Fourier transform limited pulses. Astigmatism of the two-color laser focused beam by tilting the lens has been reported by Zhang et al [95]. Clerici et al [96] were able to generate 4.4 MV cm−1 THz fields by optimizing the femtosecond wavelength. They demonstrated a 30 times higher THz emission by using 1800 nm lasers, compared with 800 nm lasers. More recently, single-cycle THz pulses exceeding 8 MV cm−1 have been demonstrated, covering the spectrum from 0.1 to 10 THz [97], which were obtained with an amplified femtosecond laser delivering 800 nm, 15 mJ, 30 fs pulses.
2.4. Relativistic laser–plasma sources
High-intensity short-pulse laser–plasma interaction [98, 99] at relativistic intensities [100] is considered to be very good tabletop sources of highly energetic electrons, protons, ions [101], as well as photons with high and low frequencies, ranging from hard x-rays [102, 103] to THz and even down to GHz frequencies [70, 104–112]. The first demonstration of intense THz pulse generation from high-intensity laser–plasma interaction at relativistic intensities from both gaseous and solid targets was reported by Hamster [70]. Substantial research has also been carried out on intense THz pulse generation through air breakdown filament generation. However, THz pulse generation from high intensity ultrashort laser–plasma interaction at relativistic intensities (≥1018 W cm−2) still lacks extensive studies. Advantages of intense THz pulse generation via this technique are manifold.
- (1)THz pulses generated by this interaction are generally highly energetic, and since there is no known upper limit in the driving laser intensity that can be used, intense THz pulses could be generated by scaling up the laser intensity. Milli-Joule THz pulse energy with GW THz pulse power can easily be generated by already existing high power laser system [113].
- (2)Electromagnetic pulses generated by this mechanism are ultra-broadband in nature, with wavelength ranging from the microwave to the infrared. It has already been demonstrated that 75% of the total THz pulse energy remains in the region over 10 THz in the spectrum [114]. Thus, frequency selective components or filters will be required for employing such radiation in THz applications. In such a purpose, metallic structures of slit or aperture arrays can be used [115].
- (3)Such broad bandwidth would allow THz pulse durations that are shorter in nature compared with that generated via conventional THz generation techniques. Gopal et al [110] determined the THz temporal profile by EO sampling technique using GaP crystal, which has spectral response up to 6 THz. Their measurement shows that the THz energy is confined within a duration of ∼570 fs (FWHM).
- (4)THz emission from high-intensity laser–plasma interaction can also provide a simple and elegant method to measure the wakefield produced for particle acceleration. Presently, only few experimental techniques exist to extract any direct information about such wakefields.
High-intensity laser–plasma interaction is rich in physics, and numerous physical processes are involved during and immediately after the interaction [96, 97] of which several may result in intense THz pulse generation. Several experimental attempts have been performed to generate high-power THz pulses by this mechanism [70, 105, 106, 109–113]. Further, several theoretical attempts and computer simulation have also been performed to explain THz pulse generation via laser–plasma interaction at relativistic intensities [104, 107, 108, 111, 116].
Laser–plasma interactions excite electrostatic plasma oscillations named plasma wakefield oscillations [117, 118]. The frequencies of the low-density plasma oscillations excited by 800 nm driving laser lay in the THz domain. For example 1018 cm−3 electron density oscillates at 9 THz frequency. High-intensity short-pulse lasers could excite large amplitude plasma wakefields, as high as 100 GV m−1 even within underdense plasma [116, 119] with electron densities of ne ∼ 1018 cm−3. These wakefield oscillations are used for particle acceleration in laser driven particle accelerators [117, 119]. Normally, this high amplitude electrostatic wakefield oscillation does not convert to electromagnetic radiation, because of the difference in dispersion relations. A small fraction of an electrostatic plasma oscillation near the plasma frequency ωp can radiate an electromagnetic wave at the same frequency by inverse mode conversion [99, 104]. As this radiation is emitted near the critical surface, it is strongly absorbed by the plasma, unless the plasma thickness is on the order of a skin depth. As such, the net radiation is zero. However, when satisfying certain conditions, this electrostatic wakefield oscillation can convert in to electromagnetic oscillation, which is described below in details. The amplitude of the wakefield oscillation increases with laser intensity, and thus the THz pulse energy generated by this technique also scales up with laser intensity.
2.4.1. THz pulse generation via Cherenkov wake emission in magnetized plasma
Yoshii et al have proposed a mechanism for THz generation in which short pulses of GHz to THz frequencies are generated by the interaction between a laser wakefield and a static magnetic field, through a mechanism named Cherenkov wake radiation [104, 120]. Normally, electrostatic wakefield oscillation does not convert to electromagnetic radiation in cold plasma. However, the situation is completely different in the presence of transverse magnetic field. The wakefield then has both electrostatic  and electromagnetic
  components in the magnetized plasma. Furthermore, the magnetized wakefield has nonzero group velocity. This enables the wake to propagate through the plasma and couples radiation into the vacuum at the plasma vacuum boundary. This phenomenon is called Cherenkov wake radiation, and emits electromagnetic pulses with frequency close to the plasma frequency, whose radiation amplitude is (ωc/ωp) times the amplitude of the wakefield amplitude. GW level THz power generation has been predicted by using the wakefield excited using currently available laser systems and the appropriate transverse magnetic field. Yugami et al have experimentally observed this electromagnetic emission in the THz and GHz frequency domain, in a low density magnetized plasma [105]. However, the observed conversion efficiency was small, due to not satisfying experimental conditions favorable for THz generation.
2.4.2. THz pulse generation via linear mode conversion
It has been found from numerical simulations by Sheng and his group that intense radiation around the plasma frequency can be produced from the wakefield in inhomogeneous plasma, although the mechanism involved yet to be solved. One possible explanation could be linear mode conversion [116]. It is well known that an electromagnetic wave can convert into an electrostatic wave through linear mode conversion, which leads to the resonance absorption of light in inhomogeneous plasmas [98, 99]. Similarly, linear mode conversion from the laser wakefield to electromagnetic pulses can occur in inhomogeneous plasma under certain conditions. The energy conversion efficiency from the driving laser pulse to the THz pulses scales as (ω/ω0)3, where ω and ω0 are the angular frequency of the generated THz pulse and driving laser. The THz pulse energy conversion efficiency also depends on the laser intensity and the plasma density scale length [107, 108, 116].
2.4.3. THz pulse generation via three-wave parametric decay
Singh et al have proposed a different mechanism for intense THz pulse generation. In this scheme, the high-intensity driving laser propagates perpendicular to the background magnetic field. This laser wave decays in to a large amplitude upper hybrid wave and a low frequency THz wave via nonlinear parametric decay process [112]. Various laser and plasma parameters were optimized and an efficiency of about 1.4 × 10⁻² has been predicted.
2.4.4. THz pulse generation via coherent transition radiation
Intense THz pulses can also be generated from relativistic electron beams, either by bending the electron beams in an external magnetic field or by sending the e-beam through medium boundaries with discontinuities in the dielectric constant. This technique has been successfully used in electron accelerators to generate high average power THz pulses [121, 122]. High-intensity laser–plasma interaction also produces relativistic electrons with more than nC charge per pulse, and is suitable for intense THz pulse generation. An experimental attempt by Leemans et al has generated THz pulses with energies of 3–5 nJ pulse−1 within a collection angle of 30 mrad and in the spectral range of 0.3–3 THz, which scales up with electron charge [106, 123]. 1.5 nC electron bunches with relativistic energies are produced by the interaction of the high-intensity laser with helium gas jet inside a vacuum chamber and THz pulses are generated when these electrons pass through a 5 μm thick metal coated nitrocellulose foil, which is placed 30 cm from the gas jet.
2.4.5. High-intensity laser–plasma interaction on metal surface
High-intensity THz pulse generation via high-intensity laser-solid interaction has been demonstrated experimentally by Li et al [109, 112], using maximum peak laser intensities of ∼5 × 10¹⁸ W cm−2. The THz pulse energy peaks at an incident angle of 67°, and THz generation is explained by transient surface current produced during laser plasma interaction [109, 112]. It was also found that the THz pulse energy scales up with incident laser intensity and strongly depends on the preplasma scale length [114] or laser contrast ratio and follow a power scaling law ETHz ∼ (Iλ2)1.0. Figure 12 [112] shows that the THz pulse energy scales up with laser intensity. THz pulses are detected by a pyroelectric detector and for 67° incident angle. The solid angle for THz collection was 0.07 sr.
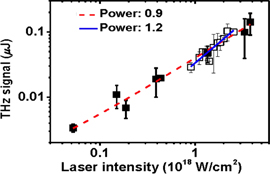
Figure 12. THz pulse energy with incident laser intensity [112].
Download figure:
Standard image High-resolution imageElectron currents are generated during high intensity laser plasma interaction via various absorption mechanisms that are responsible for THz pulse generation. Hence it is expected that THz pulse generation will be closely related to absorption mechanism. THz pulses generated by this mechanism are expected to be ultrabroadband, ranging GHz to infrared. The generated THz pulses are also polarized in the plane of incident laser irrespective of the polarization of the incident laser.
2.4.6. THz pulse generation via laser-foil target interaction
Sagisaka et al and Gopal et al have reported intense THz pulse generation via the interaction of high-intensity laser with foil targets [110, 113, 124]. Sagisaka et al proposed the antenna mechanism for THz emission, whereas Gopal et al mentioned that a fast decaying current at the rear side of the foil is responsible for the THz generation. In the antenna mechanism for THz pulse generation, THz pulses are generated by electrons moving along the target surface. This electron current could be either oscillatory or highly energetic, so that they can escape from the target. Figure 13 [124] explains the antenna mechanism. The laser–plasma interaction generates a time dependent surface current. This current has a lifetime equal to the ratio of half of the target size to the velocity of electrons, which generates THz pulses. The polarization of the generated THz pulses is similar to that of the TM mode. In the laser incidence plane, the TM mode is seen as a p-polarized wave. The total THz pulse energy can be estimated by the following equation

Here, B is the magnetic field generated by the laser–plasma interaction and r is the electron displacement length. According to the antenna mechanism, the spectrum of the THz emission is determined by the target size. However, no clear experimental evidence was found to show that the target size has any impact on the THz spectrum [109].
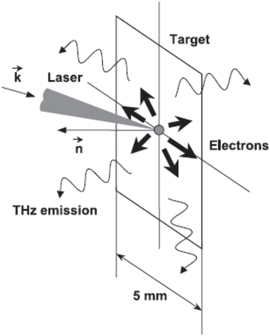
Figure 13. Oscillatory or transient electron currents along the target surface which is responsible for THz. Where k and n are the wave vector of the laser pulse and the unit vector along target normal. Reprinted with permission from Springer. Copyright 2008.
Download figure:
Standard image High-resolution imageIn summary, the various techniques of intense THz generation have been accelerated by advances in Ti:sapphire laser technology. Table 2 summarizes the various techniques reviewed above and provides a comparison among them in terms of the merits and demerits of each technique. As an intense short laser pulse is a common requirement, we included in our table only additional requirements that differ among the various techniques.
Table 2. Summarized comparison between the THz generation techniques and the advantages and disadvantages of each technique.
| Optical rectification | LAPCAs | Relativistic laser–plasma | Air-plasma | |
|---|---|---|---|---|
| THz radiation properties |
|
|
|
|
| Advantages |
|
|
|
|
| Disadvantages |
|
|
|
|
LAPCAs generate asymmetric quasi-half-cycle THz pulses at low THz frequencies. These pulses can result in large ponderomotive potential, due to their relative low peak electric field. LAPCAs are the only THz source that covers efficiently THz frequencies below 0.5 THz. As a consequence, this source may be used for example to induce strong resonance in materials that have resonances at low THz frequencies. However, its strongest applications should be in the non-resonant control of matter where electron acceleration has strong effects. Indeed, the large ponderomotive potential of the THz pulses from LAPCA could accelerate electrons to kinetic energies that may induce various effects, such as bleaching, ionizations, field emission and high harmonic generations. In the future, the main challenge would be to increase the peak electric field of LAPCA THz sources above 1 MV cm−1, by adding for example plasmonic structures to the large interdigitated structure, and by overcoming the thermal problems of LAPCAs to allow the use of amplified Ti:sapphire laser with higher repetition rate.
Intense THz generation by OR benefits from its simple experimental configuration, as well as its high conversion efficiency. As a result, this technique has been widely used in THz spectroscopy and imaging systems with high repetition rate. THz generation from LiNbO3 and organic crystals is still far from their limits, and many efforts have been made to further increase the THz field and energy. Meanwhile, it is of great interest to develop other potential nonlinear mediums with superior properties for THz generation.
Air-plasma generation for intense THz pulses based on two-color laser field has been studied and developed since 2000, with some recent strong improvement using the laser filamentation method. The air-plasma generation technique was developed on one hand for potential imaging applications, like in security imaging, where the use of THz waves was impractical, due to strong attenuation by water vapor after propagation through air for a long distance. On the other hand, the nonlinear THz spectroscopy profits significantly from this technique, covering a wide THz band compared with other THz generation techniques. A study of carrier dynamics in graphene has been done by air plasma generation [125], which offer an interesting field of application for condense matter physics regarding the large THz band covered.
Intense THz pulses generated by high-intensity femtosecond laser–plasma interaction are still in its early stage of research, and knowledge on the characteristics of these pulses is limited. It has been predicted in numerical simulations and also seen in the experiments that they produce high THz pulse energy and electric field. There is also the possibility to further increase the THz yield, which could open many new areas in THz science. This THz generation technique is new compared to other THz generation techniques. Since high-power, low repetition rate lasers are used, single-shot THz detection techniques should be used for the complete characterization of these THz pulses.
3. Intense THz detection
3.1. Conventional techniques for coherent THz detection
3.1.1. Photoconductive antenna
PCA described in section 2.1 was also the first technique developed for coherent terahertz wave detection [126]. The mechanism of THz detection by PCAs is similar to THz generation from PCAs, but is an inverse process without the bias voltage. In PCA detectors, a femtosecond probe laser pulse illuminates the gap of a PCA and excites carriers in to the conduction band. However, PCA detectors do not have any external bias field. Instead, the THz field to be measured accelerates the carriers, leading to a transient photocurrent inside the PCA detector. The measured photocurrent I(t) depends not only on the incident THz electric field, but also on the transient surface conductivity σs(t) [127]:

The time dependent conductivity implies that the current cannot flow instantaneously in response to the THz field. The photocurrent is a convolution of the THz field with the conductivity. As a consequence, the characteristics of the laser pulse and the semiconductor substrate will affect the detected THz waveform. In order to limit the effects of conductivity, materials with short carrier lifetime (such as low-temperature grown GaAs (LT-GaAs) and doped GaAs) are usually selected [128–130]. LT-GaAs has a carrier lifetime that is shorter than 0.5 ps. For increasing the maximum detected bandwidth, one should also combine a substrate with short carrier lifetime and an optical pulse with short duration. For example, the detection of THz pulses with frequencies up to 30 THz from a doped GaAs PCA has been reported, by using a 15 fs laser pulse for the probe [131]. More recently, THz pulses with bandwidths extending up to 100 THz have been demonstrated with an LT-GaAs PCA and a 10 fs optical probe [132].
Another factor that influences the bandwidth of the detected THz pulse is the geometry of the PCA. Currently, there are four kinds of PCAs that are mainly used for THz detection: strip-line, bowtie, butterfly and logarithmic antennas. These PCAs each have different characteristics. For example, the butterfly PCA will be very efficient for detecting low THz frequencies, while a strip-line PCA will be very sensitive for detecting high THz frequencies. Another factor that will greatly influence the detected signal is the dimension of the PCA. For example, a smaller gap size will allow the detection of higher frequencies and larger amplitude signals, while longer electrodes will increase the amplitude of the detected signal but will be more sensitive to low frequencies [133].
3.1.2. EO sampling technique
Free-space EO sampling technique utilizes the linear Pockels effect in an EO crystal together with a femtosecond optical gating pulse, to probe the electric field of the THz pulse [127, 134, 135]. The Pockels effect induces birefringence in the nonlinear crystal, which is directly proportional to the THz electric field. By measuring the birefringence, or the change in the polarization state of the probe beam, the THz electric field strength can then be determined. A typical schematic diagram of the balanced measurement using this technique is shown in figure 14.

Figure 14. THz detection using EO sampling technique with balanced detection.
Download figure:
Standard image High-resolution imageWithout the THz pulse, a linearly polarized optical probe pulse traverses the EO crystal without experiencing birefringence, which then passes through a quarter-wave plate and becomes circularly polarized. A polarization-state analyzer, such as a Wollaston prism, is then used to separate the orthogonal polarization components, and each is sent to one of the photodiodes of a balanced detector. The detector connected to a lock-in amplifier, measures the difference signal  from the two photodiodes, giving zero reading without the THz pulse. On the other hand, when the probe pulse and the THz pulse co-propagate through the EO crystal in time, the THz field induced birefringence rotates the polarization of the probe pulse, making it elliptical, thus introducing a signal imbalance between
  and
and  This difference between the two signals can directly give the electric field amplitude information of the THz pulse [127] by using the following equations:

Here


 is the total intensity of the probe beam and
  is phase retardation between the two polarization components. Note that in these equations, an approximation of
  is used, and thus a linear relationship between the THz electric field and the signal is seen in equation (20). Therefore, the dynamic range (DR) of the EO sampling technique is limited. For the detection of intense THz radiation, to assure linearity of the measurement, several high-resistivity float-zone silicon plates are often used to reduce the THz field to an appropriate value. However, dispersion and wavelength-dependant absorption of such plates would modify the THz waveform, thus complicating the correct measurement of intense THz waves using conventional EO sampling [136].
The entire THz waveform can be mapped in time by employing an optical delay stage to scan the time delay between the femtosecond probe pulse and the THz pulse. The quasi-DC THz electric field approximation used above is reasonable for femtosecond optical probe pulses. However, for an ultra-short THz pulse with broad spectrum, temporal walk-off due to velocity mismatch between the probe pulse and the THz pulse should be considered carefully. THz detection sensitivity will increase as the crystal thickness increases, but the corresponding detection bandwidth will decrease because of this walk-off. For this reason, the thickness of the EO crystal should be chosen properly. Thinner crystals are used for broadband detection, such that velocity matching can be fulfilled. In addition, phonon absorption is also a crucial factor that limits the detection bandwidth. For example, phonon absorption at 1.6 and 3.7 THz and the transverse optical phonon at 5.31 THz in commonly used ZnTe crystal typically limit its use to low THz frequency detection [137]. As such, other EO crystal alternatives like GaP and GaSe are generally better choices for broadband detections. Thus, the selection of the detection crystal and optimizing the detection scheme requires a good understanding of the THz optical properties of the crystal material, such as its linear dispersion and absorption [138] in the THz frequency range.
3.1.3. Limitations for measuring intense THz radiation
Advances in tabletop, intense, few-cycle broadband THz sources have pushed the achievable peak THz electric fields from the sub-MV cm−1 level to well into the several MV cm−1 regimes [40, 49, 53, 139]. Such intense THz fields are of great interest, since they enable studies of fascinating nonlinear phenomena in materials within the THz frequency range, at picosecond and even sub-picosecond timescales. High-intensity THz sources and their detection methods are the main tools that are driving such technology to boom. As we have seen in the previous sections, coherent detection of such intense THz electric fields is currently performed by various methods [134, 140]. However, these conventional techniques for THz detection have several challenges when trying to detect intense THz fields.
For example, with the EO sampling technique, if the THz electric field is intense enough, a phase difference of more than π/2 will be introduced to the optical probe beam, which leads to reversal in the intensity modulation of the probe pulse. This in turn leads to ambiguities in the measured THz field, hence posing a limitation in detecting intense THz electric fields using conventional EO sampling technique [141]. This limitation is known as over-rotation. Over-rotation poses several other restrictions in THz detection via the EO sampling technique. For example, higher spectral resolution in THz-TDS requires longer temporal scans, which could be achieved by using thicker EO detection crystals. Moreover, using thicker EO crystals result in measurements with higher signal-to-noise ratio (SNR), due to the longer interaction length in the crystal. However, using a thicker crystal increases the chance for over-rotation, since the birefringence introduced in the detection crystal is proportional to both the THz electric field and the thickness of the crystal. The increased availability of robust high-intensity THz sources and the urgent need to characterize their peak electric fields and waveforms has become a challenge for conventional EO sampling techniques. This is because high power THz measurements require high DR detection techniques, where DR is defined as the ratio of the maximum measurable signal to the standard deviation of the noise signal. Conventional EO sampling has achieved DR of only a few hundred.
PCA detectors are not commonly used for detecting intense THz pulses, despite their quality. One reason for this is that the PCA detector is very sensitive to the ambient electro-magnetic noise, which could be relatively high when using high-energy amplified laser systems. However, the major disadvantage of using PCA for the detection of intense THz pulse is the possible presence of nonlinear effects in the semiconductor substrate induced by the intense THz field [142], thus leading to incorrect interpretation of the detected signal.
In this section, we will review two methods of coherent THz detection that are especially well adapted to intense THz sources, the air-based THz detection technique, and the spectral-domain interferometry (SDI) technique. We will also review single-shot THz detection techniques, which are useful when the repetition rate of the THz source is limited.
3.2. Air-based THz detection techniques
Similar to THz generation methods, THz waves can also be detected with the help of laser-induced air plasma techniques. Currently, there are three techniques that have been developed. First, we will review THz air breakdown coherent detection (THz-ABCD) or THz air bias coherent detection (also THz-ABCD) technique, and then we will describe the THz radiation enhanced emission of fluorescence (REEF) technique. Finally, we will introduce the THz enhanced acoustic (TEA) technique, which also uses air for THz detection.
3.2.1. THz-air-breakdown coherent detection/THz-air-biased coherent detection (THz-ABCD)
Compared with THz generation in air, this process is well described by a four-wave mixing model with the generation of a second harmonic field, which depends on the THz pulse shape [143, 144]. The interaction of the fundamental laser field ω and the THz pulse can be described by the following equation:

Here, 
 and
and  are the electric field amplitude of the second harmonic 2ω, the fundamental ω and the THz waves, respectively. The term
  is the third-order susceptibility of air. From this equation, one can see that the second harmonic electric field is proportional to the THz electric field. However, in practice we measure the intensity or power of the second harmonic, but not its electric field. From equation (23), we see that the intensity of the second harmonic
  is proportional to the intensity of the THz wave
  The consequence is that the measured signal would be proportional to the square of the THz field, and thus phase information cannot be extracted, resulting in an incoherent measurement. To realize coherent measurements, the authors have devised a clever method, to mix a local oscillator at the 2ω frequency
  This local oscillator interferes with the second harmonic induced by the THz field, as expressed in the following equation:

Here,  is the second harmonic local oscillator, which is provided by the second-harmonic component of the white light in the laser-induced air plasma. The second cross term in this equation is the key term for coherent THz detection. The local oscillator
  depends on the probe beam intensity. In the case of low probe energy, the first term of this equation is dominant, leading to
  which results in incoherent detection. With probe intensity higher than the air ionization threshold, the local oscillator becomes sufficiently strong and the second term of equation (24) becomes dominant, and thus
  which leads to coherent detection. As the probe intensity has to be high enough to break down the air for coherent detection, this technique was first named THz air breakdown coherent detection (which is also THz-ABCD in short) [143].
Later, Karpowicz et al [144] applied an AC bias voltage at the focus point of the collinear THz and optical beams, as shown figure 11 (see section 2.3). The AC bias voltage was synchronized with the laser repetition rate. The bias voltage breaks the symmetry, providing an additional source of second harmonic, which could be used as the local oscillator  The THz field induced second harmonic (TFISH)
  and the AC bias second harmonic
  can be written as

Here,  is the bias electric field. Then equation (24) becomes:

In practice, the first and third terms of equation (26) can be eliminated when the AC bias voltage is synchronized with the lock-in amplifier. Only the cross term is measured, thus resulting in  and allowing coherent measurements. This method has the great advantage to reduce the probe power needed to generate the second harmonic and detect the THz pulse. Furthermore, the SNR has been improved by one-order of magnitude [144] compared to the method without AC biasing [143], and the DR is larger as well. Finally, another important feature of THz-ABCD is that the THz bandwidth is only limited by the optical pulse duration. Ho et al [145] demonstrated a continuous measurable spectral range covering from 0.2 to over 30 THz, with the help of sub-35 fs laser pulses from a Ti:sapphire amplified laser.
3.2.2. THz-radiation-enhanced emission of fluorescence
The second method developed to detect intense THz field in air is based on plasma fluorescence emission. The interaction of the THz pulse with the induced-laser plasma can generate TFISH, but also enhances the fluorescence emission of the plasma. Liu et al [146] used this latter effect for the first time to coherently detect intense broadband THz fields, and named it THz radiation-enhanced emission of fluorescence (THz-REEF). Compared with the other well-developed detection techniques, this method has an omnidirectional emission pattern. One can notice that this technique can be used for plasma characterization as well [147]. Its first demonstration has been realized with a single-color optical probe beam that results in an induced-fluorescence enhancement  which is proportional to the THz intensity, as described by the following equation [146]:

Here,  and
and  are the electron relaxation time and the THz pulse duration, and
 and
and  are the electron density, charge and mass, respectively. The term
  is the time delay between the THz pulse peak and the laser pulse peak,
  is the phase delay caused by the plasma formation. From equation (27), we see that the time-resolved signal extracted from REEF cannot be directly used for coherent detection of the THz pulse. To realize coherent detection using REEF, Liu et al applied an external bias field parallel to the THz field on the plasma as a local oscillator, allowing the THz waveform to be retrieved [148].
Another solution to realize coherent detection is to apply an AC bias voltage at the common focus point of the THz pulse and the laser pulse, as proposed by Dai et al [148]. This bias voltage field is applied parallel to the THz field onto the plasma as a local oscillator  If this AC bias voltage is synchronized at the half of the laser repetition rate, the measured component of the enhanced fluorescence signal can be expressed as:

Following this approach, the THz field can be retrieved through  with
with  being the vector potential of the THz pulse.
Finally, Lui et al [149] demonstrated an 'all-optical' technique for THz wave remote sensing with a two-color laser-induced air plasma. This is based on symmetry-broken laser fields in order to control electron momentum, which leads to coherent measurement of the THz field  They reported a THz detected signal enhancement by one order of magnitude [149], compared with the first THz-REEF demonstration [146].
3.2.3. THz wave enhanced acoustics
The third THz detection method in air plasma, named TEA, is based on photoacoustic emission from laser-induced plasma. Focusing a femtosecond laser pulse with high peak energy in air provokes an instantaneous heating of this focus point and produces a shock wave that relaxes into an acoustic wave. The addition of a THz field into the laser-produced plasma induces an acceleration of free electrons. The collisions of these electrons with the surrounding molecules lead to higher heating of the plasma and enhancement of the local pressure where the acoustic wave is generated [150]. This variation of acoustic pressure, measured with a microphone, permits to reconstruct the THz pulse. Unlike THz-REEF, where the induced fluorescence enhancement is measured, the theory behind the plasma behavior in the presence of a THz field is the same for TEA, which considers the acoustic pressure variations [151–152]. Furthermore, coherent detection can be realized with asymmetrically ionized gases obtained with two-color laser pulses [152, 153].
3.3. SDI technique
To overcome the limitations associated with the coherent detection of intense THz radiation, another new method has been developed recently, which uses SDI. In conventional SDI, a broadband light source, with bandwidth  and central wavelength
  is used to illuminate a reference surface and a sample in a Michelson-type interferometer configuration. The signals from the reference and sample are recombined in the interferometer, and are spectrally dispersed onto a CCD camera using a diffraction grating. At the CCD camera plane, this interference signal can be written as

Here,  is the wave number,
  is the phase constant, L is the optical path difference (OPD) between the reference signal and the sample signal, and Ir and Is are the intensities of the reflected signals from the reference and sample surfaces, respectively. Interference is recorded using a CCD camera and rescaled from wavelength space to wave-number (k) space, and then Fourier transformed to obtain the corresponding FFT spectrum. The instantaneous phase difference between the two signals is calculated using the relation [154]

Here,  and
and  are the Hilbert transform and the interference signal intensity of equation (29) at an OPD of L. The change in the OPD over time can be traced by monitoring the phase change in equation (30). In general, the SDI technique has been proven to measure phase changes in the micro-radian range in various applications [154–156].
The SDI technique in THz electric field measurement is a novel emerging technique that has been recently demonstrated [141, 157]. The new SDI technique for THz detection has proven to overcome the limitation of over-rotation commonly observed in EO sampling detection techniques when measuring intense THz electric fields. Further, it also simplifies the experimental set-up by eliminating the lock-in amplifier and polarizing optics in the optical probe beam path. The schematic diagram of a typical experimental setup for SDI THz detection is shown in figure 15.
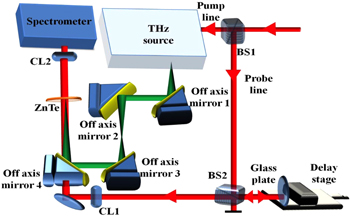
Figure 15. Schematic diagram of the experimental set up for SDI. BS: beam splitter, CL: planoconvex cylindrical lens [157].
Download figure:
Standard image High-resolution imageIn the SDI technique, the laser beam (λ = 800 nm, 40 fs) is split by the beam splitter (BS1) into a probe beam and a pump beam. The pump beam is used to generate the THz pulse, using methods such as the tilted-pulse-front technique with a LiNbO3 crystal [51]. The beam splitter (BS2) splits the probe beam into two equal parts. The reflected part of the beam is sent to a 0.3 mm thick glass plate. The two surfaces of the glass plate each reflect about 4% of the incident beam. Half of the probe beam that is reflected from the glass plate is transmitted through the beam splitter (BS2). The reflected signal from the glass plate comprises two pulses, one reflected from the front surface, and the other reflected from the back surface of the glass plate. Using a cylindrical lens (CL1), these two pulses are focused onto a 0.5 mm thick 〈110〉 ZnTe detection crystal, overlapping with the focused THz beam. A cylindrical lens (CL2) is used to collimate the optical probe beam, which is then sent to a spectrometer. The spectrometer consists of a grating (600 groves mm−1), a cylindrical lens CL3 (f = 100 mm) and a 2D CCD camera (PixeLINK, PL-B953, 760 × 1024 pixels). The presence of the THz electric field will induce birefringence in the ZnTe crystal due to the Pockels effect. The thickness of the glass plate is chosen so that this birefringence is experienced by the back pulse, but not by the front pulse. Using the spectrometer, interference fringes are observed due to the phase difference between the two optical probe pulses, which is proportional to the THz electric field.
In the SDI technique, the maximum measurable OPD depends on the depth range of the system. The depth range for a Gaussian profiled spectrum can be written as [141]:

Here, Np is the number of pixels of the CCD camera, λo and Δλ are the central wavelength and the bandwidth of the optical probe beam, respectively. Applying the parameters of the system (i.e. Np = 1024, λo = 790 nm, and Δλ = 40 nm) to equation (31), once could calculate a theoretical depth range of 3.51 mm. This large depth range is the reason why we could observe easily the interference between the front and the back probe pulses separated by the thickness of the glass plate (which corresponds to a temporal separation of 3 ps). Since a change of 2π in phase corresponds to a change of one wavelength in OPD, then a depth range of 3.51 mm corresponds to an OPD equivalent to 8898π at λo = 790 nm. This measurable phase difference of the SDI technique is 18 000 times larger than what could be measured with conventional EO sampling, where the maximum measurable phase change is π/2.
As with other conventional techniques, the THz waveform is measured in the SDI technique by varying the delay time between the THz pulse and the optical pulse using an optical delay line. The THz pulse is temporally overlapped with the optical pulse reflected from the backside of the glass plate. The THz electric field will change the refractive index of the ZnTe detection crystal through the Pockels effect. The delay between the reflected pulses from the back and front sides of the glass plate is large enough (3 ps) so that the front pulse will pass through the ZnTe detection crystal without experiencing the effect of the THz electric field, hence introducing a phase difference between the two optical probe pulses. This phase difference is proportional to the THz electric field. Thus, the THz electric field waveform can be reconstructed by changing the delay between the THz and the probe pulses.
We show in figure 16 the THz electric field obtained with SDI (solid red line) and conventional EO sampling (black dashed line) techniques. From the power spectra shown in the inset, one can observe that the SNR of SDI is still inferior to that of the EO sampling technique. Two major sources of noise are observed in the SDI method when used in intense THz detection, which are noise from the spectrometer's CCD camera and noise due to mechanical vibrations in the setup. The former could be mitigated by using a high DR CCD camera, while the latter could be mitigated by employing self-referencing [157]. In the self-referencing SDI method, the focal spot of the optical probe and the THz beams are overlapped on the ZnTe detection crystal as shown in figure 17. The optical probe beam is line focused to a length of approximately 4 mm, whereas the diameter of the THz spot is approximately 0.8 mm. The THz electric field is maximal at the center of the focused beam, and it decreases while moving towards the edges of the beam. Thus, the optical probe beam will experience maximum phase change at the center of the THz spot, which decreases as we move away from the center. At both ends of the optical probe beam, there will be no effect of THz electric field on the probe. Although the phase change along the optical probe beam would be proportional to the THz electric field, the phase change due to mechanical vibrations present in the system will be the same along the full length of the optical probe beam. Thus the mechanical vibration noise of the system can be mitigated by subtracting the phase measured at the edge of the optical probe beam from the phase values of the rest of the optical probe beam.

Figure 16. THz waveform obtained with the SDI technique (red solid line) and with EO sampling (black dashed line). The inset shows the corresponding spectra of the THz fields obtained with both techniques [141].
Download figure:
Standard image High-resolution image
Figure 17. Optical probe beam and THz focal spots on ZnTe detection crystal [157].
Download figure:
Standard image High-resolution imageWe show in figure 18 the THz electric field measured with conventional SDI and with self-referencing SDI. We see that the SNR has been enhanced by six folds by employing self-referencing SDI method [157].
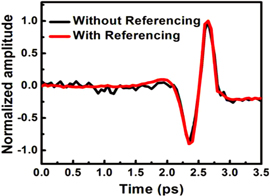
Figure 18. THz electric field measured with the SDI method (black solid line) and with the self-referencing SDI method (red solid line) [157].
Download figure:
Standard image High-resolution imageAn improvement of this detection technique has been recently proposed and demonstrated, where the probe beam is sent through an SDI using a polarization maintaining fiber [158]. The fiber is used to introduce a fixed OPD between the two cross-polarized pulses. Then, a common polarization direction is selected (by using, for example a polarizer), to allow these two pulses to interfere in the SDI. Using the interference signal between the spectral components of these two pulses, one can measure the THz electric field as a change in the phase difference introduced by the THz pulse. It has been shown that the new technique results in increased contrast of the measured interferences, resulting in higher stability and higher SNR comparable to EO sampling.
3.4. Single-shot THz detection technique
Another challenge for measuring the electric field of intense ultra-broadband THz pulses is that they typically require high-power lasers, whose repetition rate is often limited. Such high-power lasers have relatively high shot-to-shot fluctuations compared with higher repetition-rate lasers, which is also reflected in the shot-to-shot stability of intense THz pulses, especially for techniques using nonlinear optics. Therefore, it would be difficult to use THz field measurement with conventional scanning probe techniques, which often require several minutes to hours of stable THz output, depending on THz field, laser repetition rate and scanning step. Moreover, intense THz pulses may also be ultra-broadband (bandwidth 0.1–200 THz) in nature, thus requiring measurements to cover this whole spectrum [159]. Therefore, a single-shot ultra-broadband measurement technique is required in many cases for the accurate characterization of these intense THz pulses. Such single-shot THz measurement techniques would also be highly useful for some experiments that involve irreversible processes.
As we have seen in section 3.1.2, EO sampling is an efficient technique for THz field detection. However, in time-domain EO detection, the temporal waveform is reassembled by a sequential plot of the signal versus the time delay, which requires long data acquisition, and is not suitable for many applications. As explained earlier, the recently developed TFISH generation and THz-ABCD methods are able to detect ultra-broadband THz pulses, but they require a temporal delay and hence are not single shot [148]. One solution has been demonstrated by Jiang et al [5], in which they use a scheme for single-shot THz field detection by using a linearly chirped optical probe pulse and EO sampling. A THz pulse and a linearly chirped optical probe laser co-propagate inside an EO crystal, and the THz field is encoded onto the frequency spectrum of the optical probe, which is then decoded using a spectrometer. Shan et al [160] has used a non-collinear method for single-shot THz measurement, where a THz pulse and an optical probe interact in an EO sample at an angle. By using this non-collinear scheme, the temporal coordinate of the THz pulses are converted to spatial coordinate by using the relation  where
where  is the angle between the two beams. For the successful use of this technique, a complete knowledge of the spatial profile of the THz pulses is required.
Later Kim et al [161] have developed a scheme where they have used a technique similar to Jiang et al [5], except they have captured the complete spectrograph and used an algorithm developed by Yellampalle et al [162] to reconstruct the THz pulse in time and space in single-shot, and with high resolution. The resolution of the measurement is limited by the spectral bandwidth of the optical probe pulse. Later, this scheme has been successfully used by van Tilborg et al [163] to determine the THz waveform of a broadband THz pulse (up to 6 THz) generated when a femtosecond electron bunch from a laser driven electron accelerator exit the plasma-vacuum boundary. Another single-shot THz pulse measurement technique introduced by Kim et al [164] uses two-dimensional EO imaging with dual echelon optics. In this work, the temporal delay of the probe beam used in EO sampling is introduced by dual echelon optics. Figure 19 shows the typical structure of the dual echelon optics. The incoming probe pulse is split into many incrementally delayed beamlets by dual echelon optics, which is then used for single-shot EO sampling. The work of Minami et al [165] should also be mentioned here, which uses an echelon mirror (instead of the transmitting echelon optics) consisting of fine steps that introduces temporal delay in different parts of the spatial profile of the probe beam.
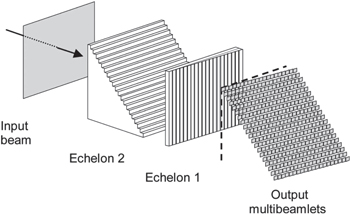
Figure 19. Schematic of dual echelon optics [164].
Download figure:
Standard image High-resolution imageDespite the extensive efforts in developing single-shot techniques for coherent THz detection, there are several challenges associated with their usage, such as:
- (1)The spectral response of the EO crystal used in the measurement. The spectral response of widely used EO crystals, such as ZnTe and GaP, have spectral response up to 3 THz and 7 THz, respectively. By using thin (∼100 μm) organic EO crystal DAST, these schemes can be extended up to 16 THz.
- (2)Pulse duration of the probe beam. The temporal resolution of the measurement depends on the pulse duration of the probe beam. However in some cases, using interferometric techniques and computer algorithm [162], it is possible to increase the temporal resolution even shorter than the actual probe pulse width [161, 166]. In this case the resolution of the measurement is limited up to the transform limited pulse width of the probe beam allowed by its spectrum [162].
In conclusion, many THz detection techniques make use of the inverse process of those used for THz generation. In contrast to inducing effects in a medium to generate THz pulses, the THz radiation to be detected results in effects that are proportional to the THz electric field strength. Technical difficulties in THz detection, such as over-rotation effects and small DRs when detecting intense THz radiation by conventional photoconductive detector and EO sampling have been overcome by developing the SDI technique. However, further efforts for increasing the DR, SNR, and detecting broader THz spectra with the SDI technique are still required. Similarly, single-shot detection has been making progress rapidly over the past ten years, but still needs efforts for overcoming difficulties associated with the spectral range of the detected radiation and with the detection temporal resolution. This is expected to motivate researchers for exerting efforts to introduce more advances in detecting intense THz radiation and to overcome the current technical difficulties.
4. Applications of intense THz radiation in condensed matter physics
The advent of intense THz sources has attracted great interests from researchers in various fields, to explore their potential applications in areas including biomedicine [167], condensed matter physics [11, 168], imaging and security [83] and communication [169]. The field is rapidly expanding, with many new and exciting results surfacing recently. In this section, we will review some of the applications in exploring carrier dynamic properties of condensed matter.
4.1. Nonlinear THz spectroscopy of condensed matter
With the development of new and increasingly intense THz sources, researchers have been provided with new tools to study nonlinear THz field-induced carrier dynamics in condensed matter. Various techniques of ultrafast time-resolved THz spectroscopy (TRTS) have been developed, and examples of their applications will be reviewed here.
4.1.1. Optical-pump/intense-THz-probe (OPITP) experiments
In OPTP experiments, the material sample is first pumped with laser pulses in the visible to the near-infrared range, and then its photo-induced dynamics is probed by THz pulses. In semiconductors, photoexcitation of electrons from the valence band into unoccupied states in the conduction band takes place linearly only when the exciting photon-energy exceeds the bandgap energy. On the other hand, the photoexcitation of carriers in zero-bandgap graphene from the valence band to the conduction band requires the photon energy of the pump beam to exceed twice the Fermi-level energy of the graphene sample; otherwise the interband transition will be blocked (Pauli blocking effect) [170–172]. After photoexcitation of the material sample in OPTP experiments, the THz probe field then reveals the transport dynamics of the free carriers (holes in the valence band and electrons in the conduction band), through transmission and/or reflection measurements. In OPTP experiments, the THz probe beam is sufficiently weak so that the THz interaction is in the linear regime. However, by using OPITP spectroscopy, new and interesting phenomena are beginning to evolve, such as the nonlinear THz-induced carrier dynamics of various materials. Here, we review two materials that have been studied by the OPITP technique, namely bulk GaAs semiconductor and two-dimensional graphene.
Su et al [173] employed intense THz probe field to study the nonlinear transport properties of photoexcited carriers in GaAs. The GaAs sample is pumped optically with 800 nm, 30 fs Ti:sapphire laser pulses with a pump fluence of 8 μJ cm−2, while the induced dynamics has been probed coherently at the peak of a single-cycle intense THz pulse generated by OR in 〈001〉 ZnTe crystal [49]. The OPITP response of the sample was measured through transmission of the intense THz probe field, as shown in figure 20. Two THz probe field levels have been studied, with peak field strengths of 4 (low) and 173 kV cm−1 (high).

Figure 20. Schematic of OPITP spectroscopy with a noncollinear configuration The sample is placed at the focus of intense THz beam that probes the photo-induced effects by the optical pump beam.
Download figure:
Standard image High-resolution imageAfter the photoexcitation, the 4 kV cm−1 THz probe field experienced transient absorption that resulted in reduction in the THz field amplitude transmitted through the GaAs sample as a function of the delay time between the pump and probe pulses, as shown in figure 21(a). Remarkably, the induced THz absorption is found to decrease when the THz probe field is increased, indicating that a nonlinear THz field-induced effect has taken place. This phenomenon has been attributed to THz absorption bleaching due to THz field-induced intervalley scattering of the photoexcited electrons from the high-mobility Γ-valley to the low-mobility L-valley of the conduction band, as shown schematically in figure 21(b). Thus, the intense THz probe field experiences less absorption due to this reduction in the carrier mobility via the intervalley scattering process. The authors have developed a simple intervalley scattering based Drude model and extracted the carrier dynamic parameters, such as the carrier population in the two valleys, scattering times, and the THz photoconductivity of the photoexcited GaAs sample, which reproduced the experimental transmission measurements, as shown in figure 22.
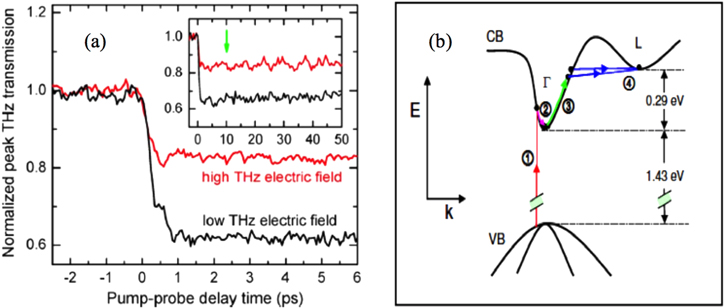
Figure 21. Normalized transmission of the peak THz pulse electric field at low (black line) and high (red line) THz fields as a function of delay time with respect to an 800 nm, 50 fs, optical pump pulse. The inset shows the corresponding long-term dynamics and the delay at which spectroscopy was performed (green arrow at 10 ps), (b) diagram showing the carrier dynamics through the band structure of GaAs under OPITP scheme. Reprinted figure with permission from [173]. Copyright 2015 by the American Physical Society.
Download figure:
Standard image High-resolution image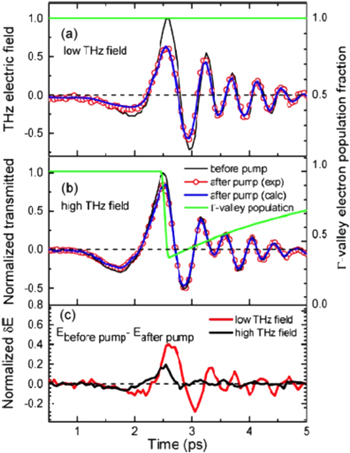
Figure 22. Transmitted THz waveforms measured 10 ps before and after photoexcitation. (a) Low and (b) high THz probe fields. The blue lines represent the best fit obtained using the dynamic intervalley electron- transfer model. The green line shows the fraction of electrons in the Γ-valley according to model calculations (adapted from [27]), and (c) Experimental THz electric field difference (ΔE), as obtained from (a) and (b) (adapted from [173]) with permission. Copyright 2015 by the American Physical Society.
Download figure:
Standard image High-resolution imageSharma et al [142] extended this study to account for the effect of increasing the photoexcited carrier density on the THz-field induced nonlinearity. The optical pump fluence has been varied from 2 to 40 μJ cm−2, leading to a change in the photoexcited carrier density from 1 × 10¹⁷ to 10.6 × 1017 cm−3. The carrier dynamics has been probed at two THz field levels with peak field strengths of 9 kV cm−1 (low) and 133 kV cm−1 (high). The THz field-induced absorption bleaching αb (the nonlinearity) is expressed as

Here,  and
and  are the THz electric field transmitted through the photoexcited (pump) and unexcited (ref) sample, and Thigh and Tlow are the normalized transmission at the high (133 kV cm−1) and the low (9 kV cm−1) THz peak fields, respectively. Figure 23 shows the dependence of the THz field-induced nonlinearity on the photoexcited carrier density. The trend is divided into two regions; at low carrier densities, the induced nonlinearity increases with the carrier density, which reaches a maximum at a carrier density of 4.7 × 1017 cm−3, while at higher densities, we see a reduction in the induced nonlinearity with the carrier density. The authors have used the intervalley scattering model to interpret this trend and attributed it to variation in the inter- and intravalley carrier scattering rates with increasing carrier density. Below 4.7 × 1017 cm−3, absorption bleaching increases with increasing the carrier density as long as more carriers can undergo intervalley scattering from the Γ- to the L- valley. Above this carrier density, the increase in the carrier density leads to an increase in the electron–hole scattering that suppresses the carrier kinetic energy in the Γ-valley and in turn reduces the intervalley scattering to the L-valley, leading to a reduction in absorption bleaching with increasing carrier density.

Figure 23. The carrier density dependence of the experimental (black squares with error bar) and simulated (red line) THz absorption bleaching for 800 nm photoexcited GaAs. The effect of eh scattering is incorporated by varying the intravalley scattering time in the simulation [142].
Download figure:
Standard image High-resolution imageAnother example of a highly interesting application of OPITP spectroscopy is to reveal the carrier dynamics of graphene. Graphene, a monolayer of carbon atoms covalently bound in a hexagonal honeycomb lattice structure, has shown unique quantum properties exemplified by relativistic massless Dirac-fermion physics [174–178]. The band structure of graphene has shown a zero-bandgap and an energy spectrum described by a linear dispersion relation, i.e.  where
where  is the Fermi velocity,
  is the momentum and
  is the reduced Planck's constant, and k is the wave vector. Since its first successful preparation in 2004 [174], graphene has attracted great interest to study its exceptional properties. Within five years just after the first preparation of graphene, more than 5000 publications on graphene have appeared [179].
Using the LiNbO3-based THz source [47] available at the multi-kHz beam line of the ALLS facility at the INRS-EMT, Hafez et al [180, 181] performed various experiments of nonlinear THz spectroscopy of graphene. Using OPITP spectroscopy with highly n-doped monolayer epitaxial graphene (with a high Fermi level of ∼350 meV) on SiC, the effect of increasing the free carrier density on the THz nonlinear transmission of graphene has been studied. The graphene sample has been pumped optically by 800 nm, 40 fs laser pulses and the induced dynamics has been probed by the peak field of intense THz pulses, as shown schematically in figure 24.
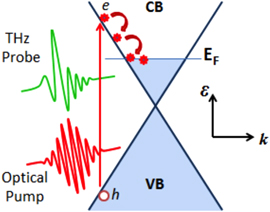
Figure 24. Graphene band structure under OPITP scheme with electron–hole generation due to photoexcitation of the graphene sample and hot-carrier effect due to heat transfer from the hot photo-induced carriers to the cold carriers.
Download figure:
Standard image High-resolution imageAfter photoexcitation and probing with a fixed THz probe field, a transient enhancement in the THz transmission (defined by a positive THz differential transmission ΔT/T0) has been observed, as shown in figure 25(a). This observation was attributed to suppression in the photoconductivity of the graphene sample after photoexcitation, due to the increase in the carrier scattering rate. After the response peaks, a subsequent relaxation takes place over a picosecond timescale due to carrier cooling via optical phonon emission and carrier recombination. Interestingly, with increasing THz probe field, the authors have observed a reduction in ΔT/T0, leading to a reduction in the overall increase in the THz transmission after photoexcitation. Figure 25(b) shows the THz peak field transmission as a function of the peak field strength after photoexcitation, relative to that before photoexcitation. Before photoexcitation, the increase in the THz field itself induces transparency in graphene, giving rise to increase in transmission, indicating a nonlinear response of graphene to the THz field. Photoexcitation led to a further increase in transmission. However, the relative increase in transmission after photoexcitation is decreased when the THz field is increased. This observation has been attributed to the combined effects from both the THz field and the optical pump fluence on the graphene photoconductivity.
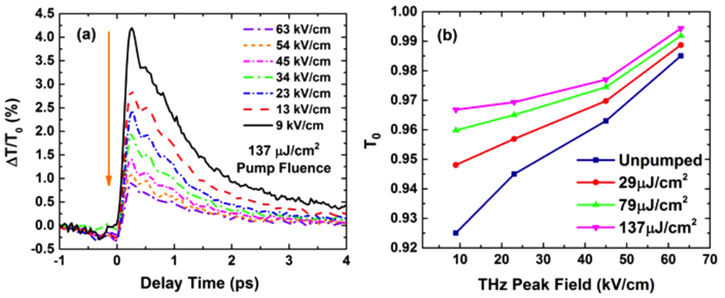
Figure 25. The dependence of OPITP response of the graphene sample on the THz peak field: (a) the transient differential transmission ΔT/T0 of the THz peak field as a function of the pump/probe delay time at a fixed pump fluence of 137 μJ cm−2 while the THz field is varied from 9 to 63 kV cm−1, and (b) maximum value of the transmission at the peak of the THz probe field as a function of the THz peak field amplitude with no pump and for three different pump fluence levels (Adapted with permission from [181]. Copyright 2015 by the American Physical Society.).
Download figure:
Standard image High-resolution image4.1.2. THz-pump/THz-probe experiments
THz-pump/THz-probe (TPTP) spectroscopy using an intense THz pump beam, is an efficient but quite challenging technique for exploring the nonlinear THz properties of materials. The TPTP technique is commonly used in studying impact ionization [181] and intervalley scattering in doped semiconductors [182].
Blanchard et al [183] performed TPTP experiments to study the effective mass anisotropy of hot electrons in non-parabolic conduction bands in n-doped InGaAs. For most III–V semiconductors, the conduction band energy at the Γ point is considered to be isotropic (i.e. spherically symmetric so that  but non-parabolic (i.e. the curvatures of the band along kx and ky are different). This nonparabolicity leads to an anisotropy in the electron effective mass [i.e.
 ![${m}_{x}({\bf{k}})\ne {m}_{y}({\bf{k}})].$](https://content.cld.iop.org/journals/2040-8986/18/9/093004/revision1/joptaa269aieqn81.gif) However, this mass anisotropy only appears away from the Γ point, and thus requires intense electric field to drive the electrons to sufficiently high k points to observe this effect. Thus, a polarization-dependent TPTP experiment has been implemented for this purpose. Figure 26 illustrates the TPTP scheme for exploring mass anisotropy in n-doped InGaAs. A strong THz pump pulse accelerates the conduction band electrons in the x direction, which are then probed by another weaker THz pulse polarized either in the x (collinear, CL in plane A) or y (cross-linear, XL in plane B) direction. The anisotropy of the electron effective masses induced by the THz-pump pulse was expected to yield distinctly different THz-probe responses for the CL and XL configurations, because the measured THz-probe signal is supposed to be proportional to the corresponding component of
However, this mass anisotropy only appears away from the Γ point, and thus requires intense electric field to drive the electrons to sufficiently high k points to observe this effect. Thus, a polarization-dependent TPTP experiment has been implemented for this purpose. Figure 26 illustrates the TPTP scheme for exploring mass anisotropy in n-doped InGaAs. A strong THz pump pulse accelerates the conduction band electrons in the x direction, which are then probed by another weaker THz pulse polarized either in the x (collinear, CL in plane A) or y (cross-linear, XL in plane B) direction. The anisotropy of the electron effective masses induced by the THz-pump pulse was expected to yield distinctly different THz-probe responses for the CL and XL configurations, because the measured THz-probe signal is supposed to be proportional to the corresponding component of  .
.
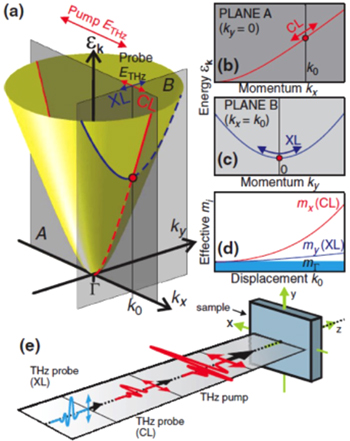
Figure 26. (a) Schematic of an isotropic, non-parabolic conduction band with an electron excited in the kx–ky plane to  (b) Schematic dispersion relation for the electron along kx within plane A and (c) along ky within plane B. (d) The corresponding effective masses mx and my together with the Γ-point mass mΓ (shaded area). (e) Polarization dependent TPTP configuration. The large electric field of the THz-pump pulse drives electrons high in the band along the x-axis. The polarization of the THz-probe pulse can then be set to monitor carrier motion either parallel (collinear, CL). or perpendicular (cross-linear, XL) to the THz-pump pulse polarization. Reprinted figure with permission from [183]. Copyright 2011 by the American Physcal Society.
Download figure:
Standard image High-resolution imageIn the experiment, a sample of n-doped In0.53Ga0.47As epilayer (carrier concentration of ∼2 × 1018 cm−3) on a 0.5 mm thick [100] semi-insulating InP substrate has been pumped at the focus of an intense THz beam (∼200 kV cm−1 peak field) generated by OR in a large-aperture ZnTe crystal. The experimental setup was constructed on the 100 Hz ALLS THz facility [49]. A smaller ZnTe crystal is used to generate the weaker probe THz beam (∼2 kV cm−1 peak field) that overlaps non-collinearly with the pump beam at the focus on the sample surface, as shown in figure 27(a). We also show in figure 27(b) the temporal waveform of the incident THz-pump beam and (c) the waveform of the THz-probe beam at various delay times between the main positive peaks of the THz-pump and THz-probe pulses. The amplitude of the transmitted THz-probe waveform was found to increase when it overlaps the THz-pump pulse at zero relative time delay, while the phase is relatively unchanged.
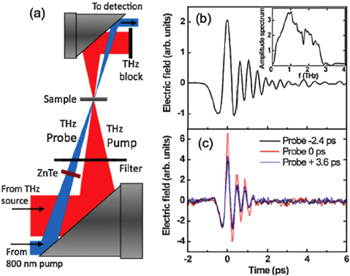
Figure 27. (a) Schematic of the experimental setup, (b) electric field profile of the THz-pump beam emitted by the ZnTe optical rectification source. Inset: amplitude spectrum of the THz pulse, and (c) electric field profile of the transmitted THz-probe beam at various delay times between the main positive peaks of the THz-pump and THz-probe pulses. Reprinted figure with permission from [183]. Copyright 2011 by the American Physcal Society.
Download figure:
Standard image High-resolution imageFigure 28(a) shows the normalized transmission of the main peak of the THz-probe pulse. The presence of the THz-pump pulse results in an increase in transmission of the probe pulse. The blue shaded area shows the transmission change for XL polarizations of the pump and probe beams, while the red line shows the same measurement for the CL polarizations. The CL case yields a much larger amplitude oscillation than the XL case (blue area) indicating that the TPTP method can indeed access the mass anisotropy.
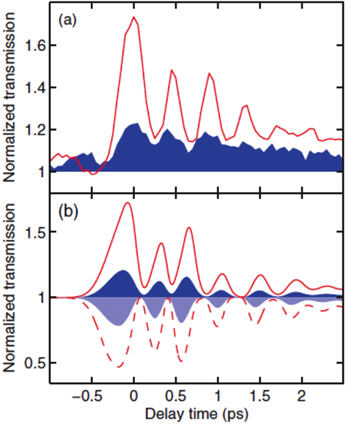
Figure 28. Measured (a) and calculated (b) normalized peak transmission of the THz-probe pulse as a function of the pump–probe delay time. The solid red lines and the blue shaded areas show the results for CL and XL TPTP configurations, respectively. The dashed red line and the light-blue shaded area in (b) represent corresponding calculations omitting radiative back-coupling effects. Reprinted figure with permission from [183]. Copyright 2011 by the American Physcal Society.
Download figure:
Standard image High-resolution imageA microscopic model was developed, based on coupling the equation of motion of carriers in intense THz field to a wave equation describing the propagation of the field through the n-doped InGaAs film. The transmission of the weak THz-probe field in the presence of the intense THz-pump field was computed, assuming an initial Fermi–Dirac distribution at 300 K and taking into account the effect of back coupling due to reflection effects. The results are shown in the upper part of figure 28(b), showing good agreement with the experimental results in figure 28(a). The solid line in figure 28(b) shows that the transmission is strongly enhanced for CL polarization due to increased effective mass, while the XL case (the blue shaded area) produces a much smaller effect since the effective mass is changed only moderately (see figure 26(d)). On the other hand, omitting the back coupling in the simulation resulted in a behavior opposite to that observed in the experiment, as shown in the lower part of figure 28(b). Thus, a complete understanding required the inclusion of the complex self-consistent back-coupling effects.
Hwang et al [184], performed TPTP experiments with monolayer CVD graphene and observed THz field-induced transparency. The THz generation was based on OR in a LiNbO3 crystal. The crystal was pumped with two laser beams produced by splitting the incoming laser beam from an amplified laser source, to generate the THz-pump and the THz-probe beams with field strength ratio of 20:1. The two THz beams were focused collinearly onto the graphene sample and EO sampling detection was performed on transmission through the sample. In the experiment, two graphene samples on two different substrates; namely 1.4 mm thick fused silica 1.4 mm thick and high resistivity 1 mm thick silicon, were examined. The two samples were hole-doped with an approximately equal Fermi level of ∼−270 meV.
Figure 29 shows the THz field-induced transparency in graphene. Figure 29(a) shows the spectral transmission for various THz field strengths as a function of frequency, indicating induced transparency that increases with increasing THz pump fluence. The inset of figure 29(a) shows the THz time and frequency profiles measured in the experiment. Figure 29(b) shows the power transmission of the entire THz pulse plotted versus THz fluence. The average power transmission increased from 54% at low fluence to 79% at the highest THz fluence (corresponding to 73% and 89% average field transmission), and was fit to a saturable power transmission function.
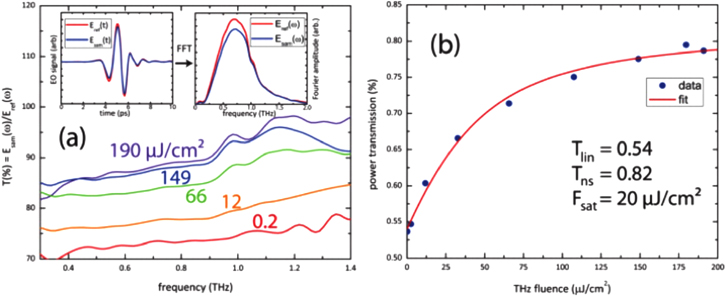
Figure 29. (a) THz field spectral transmission of CVD graphene on fused silica at different fluences. The transmission increases as the THz field strength increases. (b) THz power transmission integrated over the entire THz pulse versus THz fluence. The fit is to a saturable transmission function. Reprinted with permission from [184]. Copyright 2013 American Chemical Society.
Download figure:
Standard image High-resolution imageFigure 30 shows the time-resolved collinear-TPTP response of the two tested graphene samples. A transient change in transmission is measured as a function of the pump–probe delay time. The unreliable signal at t = 0 was due to temporal overlapping of the pump and probe pulses inside the LiNbO3 crystal. However, the back-reflection of the THz pump pulse from the substrate−air interface, upon its return to the graphene layer, was sufficiently intense to produce a significant change in probe pulse transmission. Thus, the second signal from each sample in figure 30 occurs when the pump−probe delay time matches the THz round-trip time (roughly 20 ps) in the substrate. Through the second signal components, we observe THz field-induced transparency in the graphene samples, defined by a transient increase in the differential transmission ΔT/T0. The response then exponentially decays with relaxation times of 1.7 ps for graphene on fused silica and 2.9 ps for graphene on silicon, using a single exponential decay fit.
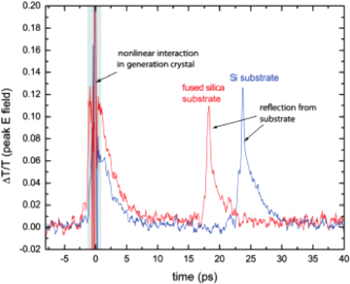
Figure 30. TPTP peak field scans for graphene on fused silica (red) and silicon (blue). The EOS delay was set so that the optical readout pulse was temporally overlapped with the peak of the transmitted THz probe pulse, and the THz pump−probe time interval was varied. The large signals at time zero may have contributions from the nonlinear interaction of the optical pump pulses that were temporally overlapped in the THz generation crystal. The second signals are due to reflections of the THz pump pulse in the sample substrates; the time delays are consistent with the THz refractive indices in fused silica and silicon. Reprinted with permission from [184]. Copyright 2013 American Chemical Society.
Download figure:
Standard image High-resolution imageThese observed THz field-induced transparency in graphene has been interpreted to be due to suppression in the intraband THz photoconductivity of graphene as a result of increasing the carrier scattering rate with increasing THz pump field. The effect of the intense THz pump beam results in thermalizing the carrier distribution. Thus, both the carrier and lattice temperatures increase with increasing THz field, leading to an increase in the optical-phonon population and in turn increase in the carrier-phonon scattering rate that suppresses the carrier mobility.
4.1.3. THz-pump/optical-probe (TPOP) experiments
In TPOP experiments, the material sample is pumped with intense THz pulses, and the THz field-induced dynamics is probed by a very low power optical beam. In a very interesting study employing TPOP experiment, Tani et al [125] revealed ultrafast THz field-induced carrier dynamics in hole-doped monolayer CVD graphene. The graphene sample was pumped with intense broadband THz pulses generated by air-plasma THz source providing intense THz pulses with peak electric field strength up to 300 kV cm−1. The induced THz dynamics was probed by a weak optical beam. In this work, the THz field-induced change in the optical-probe transmission of the graphene sample was defined by the normalized differential optical density 

 where ODref is the optical density of graphene at 800 nm without THz pulse excitation, and ODex is that with THz pulse excitation. The value of −ΔOD/ODref corresponds to the population occupation at the energy of an 800 nm transition. After THz pulse excitation, ΔOD/ODref immediately becomes negative (that is, graphene becomes transparent in the NIR region under THz pulse excitation) followed by a subsequent relaxation over a sub-picosecond time scale, as shown in figures 31(a) and (b). The large induced transparency was attributed to electron filling or hole depletion of the corresponding energy levels due to THz field-induced impact ionization.

Figure 31. THz induced normalized differential optical density as a function of time delay with peak electric fields of (a) 170 kV cm−1 and (b) 300 kV cm−1: experiment (circle) and simulation (solid line). The relaxation time is obtained by a single exponential fit (dashed line). (c) and (d) calculated carrier density as a function of time delay for the two THz field levels analogous to (a) and (b). Dashed lines represent initial carrier density. Reprinted with permission from [125]. Copyright 2012 by the American Physical Society.
Download figure:
Standard image High-resolution imageUsing a theoretical model based on the semi-classical Boltzmann equation, incorporating THz field-induced impact ionization (II) and Auger recombination (AR) into the scattering term, the experimental results have been reproduced, as depicted by the solid lines in figures 31(a) and (b). The II process creates an extra electron–hole pair while losing the kinetic energy of another electron or hole, while the AR process reduces the number of carriers. The observed large induced transparency indicated that efficient carrier multiplication by II prevails over AR under the high THz field condition. The carrier density calculations presented in figures 31(c) and (d) show that for a peak THz field of 300 kV cm−1, the number of carriers is increased by almost five times compared with the initial number of carriers. The calculations qualitatively reproduce the field dependent relaxation time, which confirm the longer relaxation time at higher excitation density, which was attributed to the hot phonon effect.
In summary, various techniques of THz spectroscopy along with intense THz sources have been employed to explore the carrier dynamics of condensed matter in the THz frequency range. The selection of a technique for a certain study depends on the nature of the dynamics to be explored. With OPTP spectroscopy one can study carrier dynamics of free carriers generated by photoexcitation, especially in undoped semiconductors. It can also reveal information about the interaction of hot photoexcited carriers and cold carriers in doped semiconductors. On the other hand, pumping with intense THz fields and probing with a weaker optical or THz field can reveal nonlinear THz effects such as impact ionization in doped semiconductors. Such THz spectroscopic techniques have a great advantage of being noninvasive.
4.2. Resonant and non-resonant control of material
In this section, we review works on intense THz field-matter interaction processes involving resonant and non-resonant excitations. THz resonant interaction with material refers to low frequency excitations with excitation energies corresponding to the THz photon energy. Molecular rotations, crystal lattice vibrations, and free carrier acceleration induced by THz fields are typical examples of resonant interaction. On the other hand, excitations with energies much larger than the THz photon energy, such as impact ionization, are classified as non-resonant. Some of these effects have been already reviewed in section 4.1. There is also an excellent review [13] on these topics. Here, we will focus on other examples, including electron field emission, ionization of Rydberg atoms, THz high-harmonic generation (HHG) by dynamical Bloch oscillations (BOs), switching effects in superconductors, and magnetic and polarization switching, which are quite novel and highly interesting applications of THz control over material properties.
4.2.1. THz-induced electron field emission
Intense THz pulses can generate and accelerate ultrashort and ultrabright electron bunches from a metal surface [185–187], analogous to earlier microwave [188] and femtosecond laser [189–192] field emission. In the THz regime, the electron emission is induced by acquiring energy from a local enhanced THz field that enables modulation of the metal work function Φ (Schottky effect), and allows electrons to tunnel through such a potential barrier. The intense field can further provide kinetic energy, producing an accelerated electron beam. The process is thus considered a nonperturbative nonlinear THz field-metal interaction. The THz local field enhancement can be achieved by a metal nanotip [185, 186] or micro antenna [187].
Hernik et al [186] demonstrated THz-induced field emission from a sharp tungsten tip (10 nm in diameter, biased at 40 V) for local THz fields exceeding 20 MV cm−1, and using a time-of-flight (TOF) electron spectrometer for detection. Figure 32(a) shows the field emission map acquired by scanning the tip through the THz focal plane and recording the electron yield. Figure 32(b) shows the generated electron energy spectra for two local THz field strengths of 31 and 53 MV cm−1, with a sharp cutoff that blue-shifts by increasing the THz field strength.

Figure 32. THz-induced field emission from a tungsten nanotip (10 nm diameter, 40 V bias); (a) field emission map obtained by scanning the tip and recording the electron yield through the THz focal plane, and (b) photoemission spectra for two THz exciting fields of 31 and 53 MV cm−1. The dashed lines represent numerical simulations based on a THz field-induced particle acceleration model [186].
Download figure:
Standard image High-resolution imageIwaszczuk et al [187] demonstrated THz-induced electron field emission from a gold nanoantenna on high resistivity silicon in a nitrogen purged environment. It has been shown that the generated photoelectrons ionize the nitrogen molecules surrounding the sample, giving rise to the generation of UV radiation. The incoming THz beam has a peak electric field of 200 kV cm−1 and a peak intensity of 0.1 GW cm−2, illuminating one side of the substrate first, and the emitted UV radiation detected on the other side. The emitted UV spectrum (photon energies 2.7–5 eV) has been found to consist of emission lines of excited N2 and singly ionized  as shown in figure 33. The process is described by a four-step model, consisting of (i) electron field emission, (ii) electron ballistic acceleration, (iii) excitation and ionization of N2 molecules and (iv) UV emission.

Figure 33. Intensity spectrum of UV light generated from excited N2 and singly ionized  by the effect of THz-induced field-emission from gold nanoantenna. The Numbers between brackets on the plot refer to the initial and final vibrational states [187].
Download figure:
Standard image High-resolution imageFurther, Wimmer et al [185] and Hernik et al [186] independently, demonstrated THz control of electron dynamics using OPTP spectroscopy. Optical pump at 800 nm induced nonlinear photoelectron emission from biased metal nanotips, which is gated and streaked by locally enhanced THz fields. The effect of the THz field, with polarization parallel to the tip line, resulted in enhancement in the photoemission-streaking maximum, caused by a THz field-induced reduction in the work function.
4.2.2. Ionization of Rydberg atoms
The Rydberg state of an atom or molecule is an electronically excited state. The most important property of Rydberg states is the large orbital radius, and hence dipole moment. As a result, Rydberg atoms have typical properties such as small binding energy, high state density and long lifetime, which make them easy to ionize under the action of an external electric field [193–195]. Working with Rydberg atoms is very interesting for studying the different ionization mechanisms. For example, different mechanisms dominate the ionization process if we excite the Rydberg atoms with radio frequencies, micro- and THz waves. The first example of nonlinear nonresonant control of matter by intense THz pulses was the ionization of Na atoms in a Rydberg state by asymmetric half-cycle THz pulse generated by GaAs LAPCA in 1993 [193]. The threshold electric field required to ionize a Rydberg state with effective quantum number n is found to scale as n−2 for states with n > 13, in contradistinction to the n−4 threshold scaling for static field ionization and high order multiphoton ionization. Bensky et al [194] studied the process of ionization of Na Rydberg atoms with intense quarter cycle circularly polarized THz pulses. However, it was found that the ionization probability is remarkably insensitive to the time-varying polarization of the THz field. Recently, the ionization of atoms in a low Na Rydberg states,  by a low frequency, long single-cycle THz pulse was demonstrated [195]. Figure 34(a) shows the THz field dependence of the ionization probability for
  Working in that regime revealed three surprising results: (i) the adiabatic ionization occurred for higher field threshold, which scales as n−3, as shown in figure 34(b), (ii) it has been found that the electrons originating from the most tightly bound Rydberg states left the atoms with the highest energies, and (iii) the kinetic energy of electrons largely exceeds the limit of
  where Up is the ponderomotive energy of the pulse.
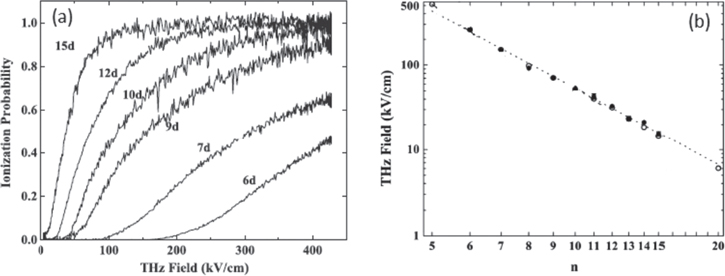
Figure 34. (a) THz field dependence of the ionization probability for Na Rydberg states,  and (b) the field threshold as a function of n; filled circles for the experimental data, dotted line for the best fit n−3/96 and open circles for classical model simulations (adapted with permission from [195]. Copyright 2014 by the American Physical Society).
Download figure:
Standard image High-resolution image4.2.3. THz HHG by dynamical BOs
In solids, the electronic transport of free carriers under the action of a static field is described by the Drude model. The Drude model is still valid until the carrier moves ballistically between scattering events. A description as free carriers is well justified if the carriers stay close to the lower band edge. If the field is large enough that the carriers in a crystalline solid reach the edge of the Brillouin zone before scattering takes place, Bragg reflection occurs and the electron traverses the Brillouin zone again, causing the electron to oscillate in the real and reciprocal space [196–203]. This effect is well known as BOs. For a crystalline structure with a lattice period d, in an electric field E, the carrier can oscillate with a period  The first experimental observation of BO has been verified in semiconductor superlattices using optical excitations [197].
In the THz frequencies, Schubert et al [203] reported intense (72 MV cm−1 peak electric field, and central frequency at 30 THz) THz field-induced BOs in a bulk crystal of GaSe semiconductor, leading to THz HHG up to the 22nd harmonic order, as shown in figure 35(a). The effect is thus nonlinear and nonresonant. Proper detection techniques of EO sampling, InGaAs diode array and a Si CCD camera have been employed to detect this wide range of the whole spectrum. The THz field dependence of the generated harmonics, the 13th order for example, is shown in figure 35(b). The intensity scales initially asymptotically as  (dashed line) and then a slower increase as
  is observed for higher fields (dotted line), confirming the nonperturbative nature of HHG. The experimental observations have been justified quantitatively by considering BOs combined with coherent interband excitations, i.e., accounting for nonresonant excitation of interband polarization and intraband acceleration of electronic wavepackets throughout the Brillouin zone. In contrast to the three-step model for HHG in atoms, the THz acceleration of electrons in a periodic lattice potential in a crystalline solid is dominated by Bragg reflection. The model also accounted for the generation of even harmonics by assuming THz field-induced dynamical band mixing including three valence and two conduction bands (see figure 35(c)), incorporating the broken inversion symmetry of GaSe.
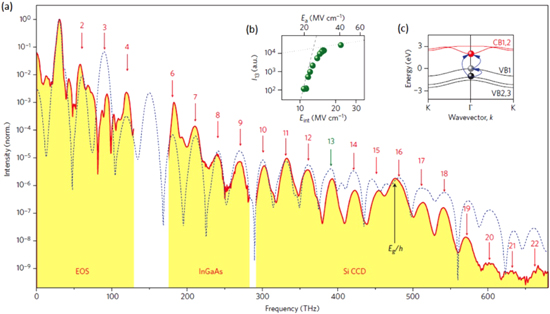
Figure 35. (a) Higher harmonic spectrum generated from a GeSe single crystal via intense THz excitation. Proper detection techniques of EOS, Proper detection techniques of EO sampling, InGaAs diode Array and a Si CCD camera have been employed to detect this wide range of the whole spectrum. (b) The THz field dependence of the 13th order harmonic. Ea (the top scale) is the THz field in air and Eint (the bottom scale) is the internal field obtained from Ea after accounting for the reflection at the sample surface, and (c) Model electronic band structure of GeSe including three valence bands and two conduction bands and electronic excitations from the valence to the conduction bands. Reprinted by permission from Macmillan Publishers Ltd: [203]. Copyright 2014.
Download figure:
Standard image High-resolution image4.2.4. Switching of superconductors
It has been reported a few years ago that intense THz fields can lead to a breakup of Cooper pairs in superconductors, providing a switching from superconductor to normal metal properties [13, 204–206]. Matsunaga et al [204] studied ultrafast dynamics of the BCS state in a conventional NbN superconductor (with a BCS gap of 2Δ(0) = 5.2 meV (1.3 THz)) after impulsive injection of quasiparticles (QP) at the edge of the BCS gap by using intense THz pulses and employing TPTP spectroscopy. Rapid THz field-induced switching off of superconductivity was observed within the duration of a single-cycle THz pulse with a peak electric field exceeding 50 kV cm−1 and a spectrum located at the BCS gap region. At that pump level, high-density QPs as much as 1020 cm−3 were estimated. The temporal evolution of the probe THz field Eprobe transmitted through the NbN sample and the pump–probe change ΔEprobe as functions of the pulse gating time tg and the pump–probe delay time tpp is shown in figures 36(a)–(c), for a pump THz peak field of 100 kV cm−1 at 4 K. Figure 36(d) shows the temporal evolution of the peak of ΔEprobe (tg = 0) as a function of tpp for various THz pump peak fields. At low THz pump field, a rapid transient increase in ΔEprobe with a peaklike signal is induced after pump as a result of Cooper pair breakup via direct photoinjection of QPs, leading to a change in the BCS state. Although the effect is linear and resonant, the switching from superconductor to normal metal phase requires high density of photoinjected QPs, which in turn requires high THz field. In addition, the THz field effect is highly distinguished from that induced by optical pump that generates hot electrons with excess energy transferred to the creation of high-frequency optical phonons, which in turn cause the pair breaking [204, 205]. The transient change becomes constant after tpp = 1.6 ps, indicating that the BCS state reached a quasiequilibrium state. As the THz pump field increases, the peaklike signal disappears and the transient change shows a steplike signal and the rise of ΔEprobe becomes earlier. The origin of the former effect is not clearly understood, while the latter effect was attributed to a change in the BCS state induced by the precursor part of the THz pump pulse before the main peak in the high pump regime. Moreover, the decay time of ΔEprobe was found to increase by increasing temperature and THz pump field.
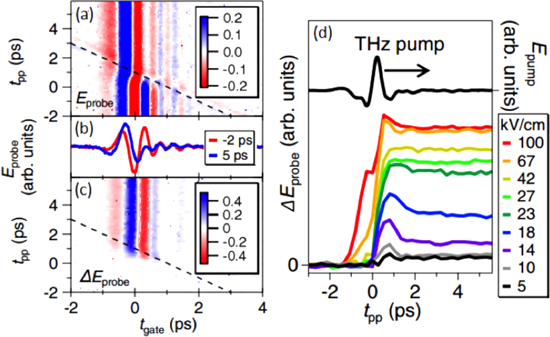
Figure 36. TPTP response of BCS NbN superconducting film; (a) color map of the THz probe field Eprobe as a function of the gate time tgate and the pump–probe time tpp at 4 K, (b) THz probe pulses transmitted through the sample before and after intense THz pump with 100 kV cm−1 peak electric field, (c) the change in the THz probe field as a function of tgate and tpp, and (d) time resolved change in the THz probe field as a function of the pump–probe delay time tpp, for various THz pump fields. Reprinted figure with permission from [204]. Copyright 2012 by the American Physical Society.
Download figure:
Standard image High-resolution imageIn contrast to the above study with NbN superconductor in which the BCS gap was analogous to the THz photon energy, Glossner et al [206] reported Cooper pair breakup in high-temperature YBa2Cu3O7−δ [∼20 meV gap energy] induced by intense THz field with photon energies much lower than the superconducting gap energy of the material. The process is thus nonlinear and nonresonant. Figure 37 shows THz pulses transmitted through a 45 nm YBa2Cu3O7−δ O thin film on 500 μm (LaAlO3)0.3(Sr2AlTaO6)0.7 (LAST) substrate and normalized to the peaks of the corresponding THz pulses transmitted through bare LAST substrate, at various temperatures below and above the critical temperature [TC = 80 K] and various incident THz fields with peak electric fields up to 30 kV cm−1. For a fixed THz field, we observe reduction in transmission as the temperature reduces below TC, i.e. by reaching the super conductor phase. Interestingly, the low-temperature transmission increases and a time shift is observed by increasing the exciting THz field (the upper two panels of figure 37) indicating suppression in the superconductivity of the material, while no field-induced change is observed for T > TC. These observations provide further control of THz response of metamaterials on superconducting substrate, which will be discussed in the next section.

Figure 37. THz pulses transmitted through the YBCO sample normalized to the peak of the corresponding pulses transmitted through the bare LAST substrate, at various temperatures below and above TC and various incident THz fields up to E0 = 30 kV cm−1 [205].
Download figure:
Standard image High-resolution imageIn contrast to THz field-induced Cooper pair breakup, Dakovski et al [207] demonstrated THz field-induced charge density wave (CDW) in an underdoped single crystal YBa2Cu3O6+δ (TC = 75.2 K and doping level p = 0.133), demonstrating that low photon energy fields can induce pronounced coherent, collective excitations in the superconducting state. In their experiments, intense THz pulses with peak electric field of ∼400 kV cm−1 is used to pump the sample, while the induced excitations have been probed by an 800 nm beam of 100 fs pulse duration, by employing reflection measurements via TPOP spectroscopy. Figures 38(a) and (b) show THz field-induced transient optical reflectivity at low temperatures, for two cases of the optical probe polarization with respect to the a and b axes of the sample. The transient peak is followed by coherent oscillations, closely following the THz pulse intensity profile, which have been Fourier analyzed in figures 38(c) and (d). The sign of the transient reflectivity was found to be dependent on the relative orientation of the optical probe beam with respect to the sample axes, while the polarization of the THz pump beam did not show any effect. For optical probe polarization parallel to the b-axis, only one single mode of 1.8 THz is observed, similar to observations obtained by 800 nm optical pump [207, 208]. For the probe beam polarization parallel to the a-axis, two additional modes at 0.6 and 2.7 THz are observed. The THz field-induced effects are thus resonant. The 1.8 and 2.7 THz modes match CDW oscillations measured by x-ray scattering, while the 0.6 THz mode still needs more investigations.
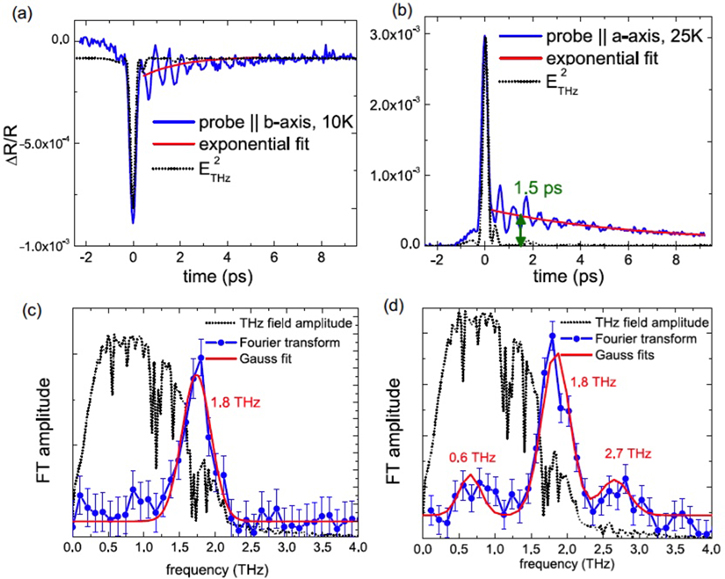
Figure 38. THz field-induced transient optical probe reflectivity as a function of the pump–probe delay time for two cases of optical probe polarization (a) parallel to the b-axis of the sample at 10 K and (b) parallel to the a-axis of the sample at 25 K, and (c) and (d) the corresponding Fourier analysis [207].
Download figure:
Standard image High-resolution imageFigure 39 shows the temperature dependence of the THz field-induced transient reflectivity and the coherent oscillations. As the temperature increases, the coherent oscillations diminish and vanish at temperatures close to the transition temperature TC, consistent with the behavior of the CDW transition. Moreover, a change in the sign of the transient reflectivity is induced by increasing temperature above TC.
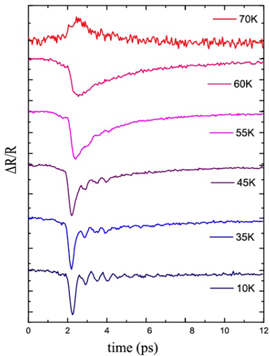
Figure 39. Temperature dependence of the THz field-induced transient optical reflectivity [207].
Download figure:
Standard image High-resolution image4.2.5. Magnetic and polarization switching
The magnetic field is an excellent way to control the quantum-mechanical spin S of an electron. Since S is associated with the magnetic dipole moment, it couples to B through the Zeeman Hamiltonian γ S · B, where γ denotes the gyromagnetic constant [209]. A direct control of spin is provided by a time dependent magnetic field that exert a Zeeman Torque given by γ S × B, which leads to spin precession [210]. In antiferromagnets, the spin precessions, called magnon, occur at THz frequencies. With the development of intense THz sources, it is now possible and very promising to manipulate and control the spin by intense THz electromagnetic transient in antiferromagnets. A THz pump-optical probe experiment was tested onto NiO [209, 210], whose magnon resonance is located at 1 THz [211]. NiO was chosen because the Heel temperature is set at 523 K, allowing all the experiments to be at ambient temperature, and also because it is considered to be a centrosymmetric medium, which allows the driving of spin dynamics only by the THz magnetic field. Figure 40 shows the trace of the incident magnetic THz transient (a), Faraday rotation as a function of the pump–probe delay time with a period of 1 ps (b), the spectrum of the THz pulse and the spectrum of the Faraday rotation induced by the intense THz pulse into the NiO substrate (c) and the Faraday rotation as a function of the pump–probe delay time for a double pulse excitation with the second pulse in (d) or out (e) of phase with the spin precession induced by the first intense THz pulse.
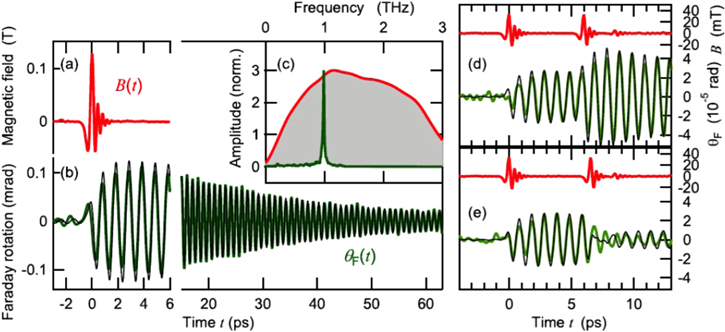
Figure 40. Magnetic field of an incident single pulse (a) and its induced Faraday rotation (b) as a function of pump–probe delay time and their respective Fourier amplitude spectra (c). Double pulse excitation with the second pulse in (d) or out (e) of phase with the spin precession induced by the first intense THz pulse. Reprinted by permission from Macmillan Publishers Ltd: [209] copyright 2013.
Download figure:
Standard image High-resolution imageThe intense THz transient was generated by OR of 5 mJ, 800 nm, 100 fs laser pulse in a large aperture ZnTe crystal and focused onto a Twin domain, which is in the order of 100 μm. The peak electric field and peak magnetic field were estimated to be about 0.4 MV cm−1 and 0.13 T, respectively and cover a spectral range from 0.1 up to 3 THz. The induced spin precession was measured by measuring the Faraday rotation of the 8 fs probe pulse. When using single pulse excitation, the authors observed that the Faraday rotation oscillates with a period of 1 ps corresponding to a narrow spectrum centered around 1 THz. The maximum amplitude is reached at 3 ps, which then decays exponentially with a time constant of 39 ps. Following the idea introduced by Yamaguchi et al [212] who have induced quasiferromagnetic and quasiantiferromagnetic spin precession in a YFeO3 crystal using a double THz pulses excitation with an adequate time delay, and taking advantage of the long life time of the spin procession, Pashkin et al [209] controlled (switch on–switch off) the spin precession with a succession of two excitation pulses with different time delay between them. If the second pulse arrives 6 precession cycles after the first pulses, the two torques induced by the two pulses will be in phase, which induce an almost two times stronger Faraday rotation, resulting from a two times stronger spin precession. However, if the second pulse arrives 6.5 precession cycles after the first pulse, the torques will be out of phase, which switches off the spin precession.
Control of magnetization dynamics is also possible in ferromagnetic material. However, since the resonant modes are typically lower than 100 GHz, intense THz magnetic transients allow nonresonant control of the spin [213]. The biggest advantage of THz wave over optical pulse is that the former induces an adiabatic process, thus avoiding cooling, which in general limits the speed of the magnetization manipulation [214]. Recently, Vicario et al [215] studied off-resonant magnetization dynamics induced by an intense THz pulse in a 10 nm thin cobalt film. They showed that the magnetization variations were phase locked to the THz magnetic transient. Before the THz excitation, the magnetic moment was driven to saturation by applying an external magnetic field. The THz pulses were generated via OR in an organic crystal excited with a 1550 nm laser pulse. The THz pulse was 1.5 cycles and the magnetic peak field was 0.4 T. A 50 fs, 800 nm optical probe sampled the magnetization dynamics via the magneto-optical Kerr effect (MOKE).
Figure 41 shows the THz magnetic transient, the MOKE signal and the signal obtained with the simulations as a function of time (a) and their respective spectrums (b). The simulations were calculated using the Landau–Lifschitz–Gilbert formalism. We observe that the magnetism dynamics are phase locked with the magnetic transient with a phase shift of 50 fs corresponding to a quarter of a cycle. As a consequence, the two spectra show good agreement. This was the first time that such fast magnetic dynamics was induced by an exciting pulse. The speed of the magnetization dynamics was the fastest ever observed. This phenomenon is possible because the photon energy of the THz waves is at least 3 orders lower than the photon energy of an optical pulse, which limits the heating of the substrate.
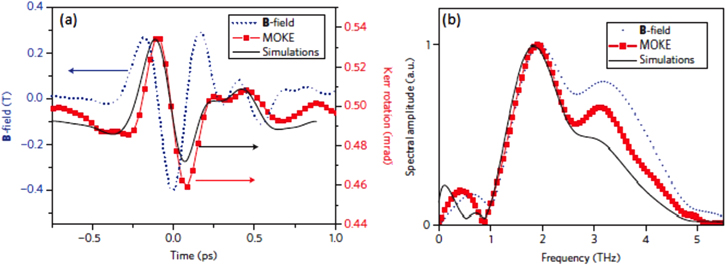
Figure 41. Magnetic THz transient, MOKE signal and simulations signal as a function of time (a) and their respective THz spectrums (b). Reprinted by permission from Macmillan Publishers Ltd: [215] copyright 2013.
Download figure:
Standard image High-resolution imageAs extremely high THz magnetic field is required for inducing magnetic switching effects, using metallic structures that can enhance the THz magnetic field could be essential. Engineered structures such as metamaterials, which will be discussed in the next section, could be of a great importance. To the best of our knowledge, no applications based on employing metamaterials in THz magnetic switching effects are reported to date.
4.3. Controlling the nonlinear response of metamaterials
Metamaterials are structures engineered to exhibit tailored electromagnetic properties, such as negative refraction [216, 217], sub-differential limited imaging [218], and electromagnetic cloaking [219], which are all exciting functionalities that are not available in natural materials. The structure is basically composed of sub-wavelength metallic resonators held together in a dielectric. The electromagnetic properties of metamaterials are derived mainly from these resonating elements rather than from atoms or molecules, compared with conventional materials. The precise shape, geometry, size, orientation and arrangement of these metallic resonators control the amplitude, direction, polarization, wavelength, and phase of the electromagnetic waves interacting with the metamaterials. Due to their customizable characteristics, metamaterials have also become versatile tools in THz research and development. The information obtained from THz metamaterials can be beneficial to the study of optical metamaterial, as THz radiation maintains quasi-optical behaviors. Additionally, THz measurement techniques, particularly THz-TDS, offer information that is unavailable from other spectroscopic modalities. Thus, the broadband amplitude and phase detection together with the flexible configuration of the system permits the full characterization of metamaterial properties.
Controlling THz metamaterials dynamically is highly desirable, and indeed thermal [220, 221], electrical [222, 223], and optical [224–226] schemes have been proposed to achieve some degree of active control. As the control of light with light is a major goal in contemporary photonics, it would be a significant advance if one could design THz devices that have strong nonlinear response to the THz field itself. Such nonlinear metamaterials offer another degree of freedom in order to achieve dynamically controlled devices. In this section, we will summarize techniques used to control the nonlinear response of THz metamaterials.
As THz metamaterials, split ring resonators (SRRs) on n-type GaAs and semi-insulating (SI) GaAs have been used. For example, Fan et al [227] demonstrated the possibility of sweeping the effective permittivity from negative to positive values by increasing the incident field strength. Figure 42 shows the linear THz amplitude transmission of a metamaterial sample, referenced to the bare n-type GaAs substrate. The LC resonance is at ∼0.75 THz and is strongly damped, as expected, since carriers in doped GaAs short the SRRs. The inset of figure 42 shows the structure and the dimensions of the SRR used in this study.
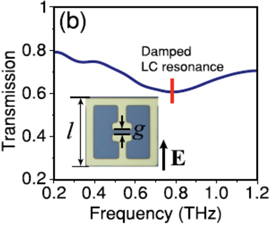
Figure 42. The linear spectral THz field transmission of the SRR array on doped GaAs at low fields. The inset shows an image of the SRR with the length l = 36 μm, and the gap g = 2.2 μm. Reprinted figure with permission from [227]. Copyright 2013 by the American Physical Society.
Download figure:
Standard image High-resolution imageFigure 47 shows the nonlinear response of the metamaterial when the THz field is varied from 24 to 400 kV cm−1. As the incident field is increased to 160 kV cm−1, the LC resonance becomes more pronounced, leading to a decrease in the resonant transmission (∼0.73 THz) from 65% to about 30%, as shown in figure 43(a). This was attributed to a decrease in the conductivity due to THz field-induced intervalley scattering. The off-resonance transmission at low frequencies increases (for example, from 80% to over 90% at 0.4 THz). This indicated a field-induced reduction in the conductivity of the entire n-type GaAs film. Thus, for THz field from 24 to 160 kV cm−1, the nonlinearity does not depend strongly on the in-gap field enhancement. However, above 160 kV cm−1, the trend described above in the field-dependent transmission at the resonant frequency is reversed. As can be seen in figure 43(b), the transmission increases with a further increase in the THz field. This indicates a reversal of the underlying trend in conductivity, that is, an increase in conductivity in the gaps as the field is increased above 160 kV cm−1. Notably, the off-resonance transmission at lower frequencies (<0.5 THz) remains almost unchanged, which implies a local conductivity increase solely in the capacitive gaps of the resonators. This response was attributed to THz field-induced impact ionization. Figure 43(c) shows the simulation results assuming THz-field induced intervalley scattering to interpret the response in figure 43(a) for THz field ranging from 24 to 160 kV cm−1, while the response in figure 43(b) was simulated in figure 43(d), assuming THz-field impact ionization for THz fields above 160 kV cm−1.
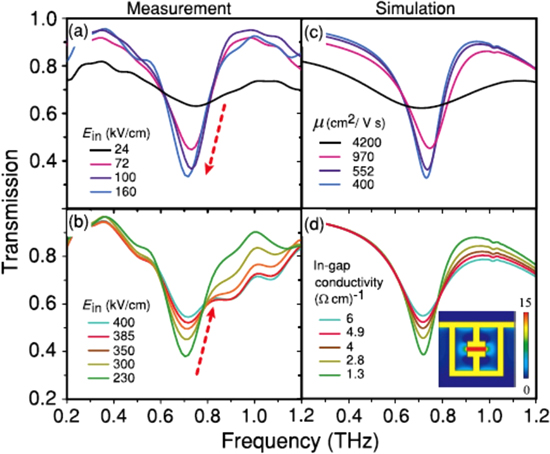
Figure 43. (a) and (b) Experimental spectral THz field transmission for various incident peak electric fields. (c) Simulated transmission of the SRR array on doped GaAs film at a constant carrier density of 1 × 1016 cm−3 and a good matching with the experimental is achieved by the varying carrier mobility μ. (d) Simulated transmission on doped GaAs for various in-gap conductivities with constant μ and the carrier density is modified according to impact ionization simulations. The inset in (d) shows the simulated on-resonance field enhancement, highlighting that the largest enhancement occurs within the SRR gaps. Reprinted figure with permission from [227]. Copyright 2013 by the American Physical Society.
Download figure:
Standard image High-resolution imageIn contrast to doped GaAs, semi-insulating GaAs (SI-GaAs, carrier density 1 × 107 cm−3) with its low conductivity of 1 × 10⁻⁸ (Ω cm)−1 yields a distinct SRR resonance and THz field enhancement even at low incident field levels. The inset of figure 44 shows the SRR unit cell used to fabricate arrays on SI-GaAs. The size and period of the SRR resonators were the same as the resonators on the doped GaAs, thereby maintaining the resonance roughly at the same frequency. A smaller SRR gap (1.3 μm) was used to increase the field enhancement, given the difficulty in initiating impact ionization on SI-GaAs due to the small initial carrier density.

Figure 44. (a) Experimental spectral THz field transmission for various incident peak electric fields for SRRs on SI-GaAs. The top inset shows an image of the fabricated metamaterial unit cell with a gap size of 1.3 μm. The bottom inset shows the long-time dynamics from TPTP measurements of the 0.8 THz metamaterial resonance. The red region is where impact ionization is expected. The transmission dips noted by the green arrows are due to carrier mobility saturation from etalon reflections of the THz-pump field in the substrate. (b) Simulated transmission for various in-gap conductivities. The dashed curve is the predicted response if the entire lateral area of the GaAs substrate (to a depth of 0.5 μm) has a conductivity of 20 (Ω cm)−1. The inset shows the simulated on-resonance field enhancement. Reprinted figure with permission from [227]. Copyright 2013 by the American Physical Society.
Download figure:
Standard image High-resolution imageFigure 44(a) shows the experimentally measured transmission of metamaterials as a function of frequency for various values of Ein. At the lowest field (100 kV cm−1), the response is still in the linear regime with a characteristic dip in the transmission at the LC resonance frequency. As the incident field increases, the metamaterial transmission increases and broadens with negligible change at lower frequencies. Even at the highest incident fields (Ein = 400 kV cm−1), no nonlinear transmission changes were detected on bare SI-GaAs. Similar to the nonlinear high-field results (>160 kV cm−1) on n-type GaAs, the results of figure 44(a) suggest a large increase in the in-gap conductivity, indicating a carrier density increase via impact ionization.
Further evidence for carrier generation by impact ionization was provided by TPTP measurements of the long-time dynamics of the 0.8 THz metamaterial resonance, as shown in the bottom inset of figure 44(a). The transmission at the 0.8 THz resonance increases from 20% to 70% in the impact ionization regime (red region) and persists with little decay over the measurement time window. There are also three dips (noted by green arrows in the figure) in the transmission at 0.8 THz due to carrier mobility saturation of the generated carriers in the capacitive gaps due to etalon reflections of the THz-pump field in the SI-GaAs substrate. Simulations based on carrier generation via in-gap THz field-induced impact ionization have provided a good match with the experiment, as shown in figure 44(b).
Al-Naib et al [228] performed a thorough investigation of Si-based ultrafast nonlinear THz metamaterials. The structure consisted of an array of gold concentric ring resonators (CRRs) deposited on an optically pumped high-resistivity Si wafer, as shown in figure 45. In the experiment, OPTP spectroscopy was used. Two pump fluences of 5.3 and 14.6 μJ cm−2 have been tested, while the THz probe field was varied between 0.4 to 90 kV cm−1. Without optical pumping the Si substrate, the structure resonates at 0.7 THz. The calculated electric field at the resonance frequency is depicted in figure 45(b), assuming a linearly polarized excitation as shown in the inset of figure 42(a). On resonance, the field is enhanced by approximately a factor of ten near the outer concentric circle of the resonator.
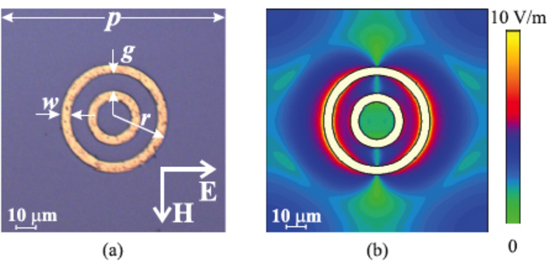
Figure 45. (a) An image of the CRR unit cell, with a lattice constant of p = 125 μm, an outer resonator radius of r = 30 μm, a resonator width of w = 5 μm, and a gap of g = 10 μm. The axes on the figure indicate the orientation of the exciting THz field. (b) Simulated spatial electric field at the resonance. Reprinted figure with permission from [228]. Copyright 2013 by the American Physical Society.
Download figure:
Standard image High-resolution imageFigure 46 shows the low field (∼0.4 kV cm−1) transmission (linear response) of the metamaterial sample with and without optical pumping. With optical pumping at lower pump fluence (5.3 μJ cm−2), two effects have been observed: blue shift of 69 GHz in the resonance frequency and reduction in the quality (Q) factor. The former was attributed to pump-induced change in the imaginary part of the conductivity of Si, which modifies the capacitance of the resonator, while the latter was attributed to an increase in the real part of the conductivity, which increases the losses in the system. When the optical pump fluence is increased to 14.6 μJ cm−2, the Q factor decreases further so that the position of resonance became difficult to be seen. In addition, the bare Si substrate has also been tested. Optical pumping of Si leads to reduction in its THz transmission due to increased absorption by the optically generated free carriers. Similar to GaAs in section 4.1, the reduction in transmission after pump was found to decrease (absorption bleaching) as a result of intervalley scattering in the conduction band when the THz field increases.
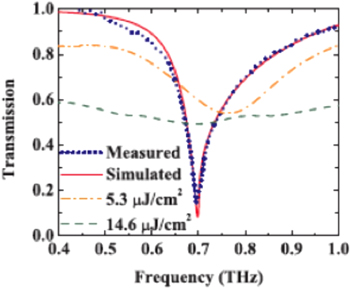
Figure 46. The measured and simulated linear spectral transmissions of the metamaterial sample without and with optical pump at two pump fluences of 5.3 and 14.6 μJ cm−2. Reprinted figure with permission from [228]. Copyright 2013 by the American Physical Society.
Download figure:
Standard image High-resolution imageFigure 43 shows the nonlinear response of the metamaterial sample at an optical pump fluence of 14.6 μJ cm−2, when the THz field is increased up to 90 kV cm−1, normalized to the un-pumped Si (figure 47(a)) and optically pumped Si (figure 47(b)). In figure 44(a), we observe that the increase in the THz field leads to a narrowing of the response with a significant increase in transmission away from resonance, while the increase in transmission at resonance is small. This is a clear indication of the enhanced field due to the resonators as the field is increased. In contrast, normalizing to the pumped Si in figure 47(b) shows significant change in transmission from 84% to 61% at resonance, while the transmission away from resonance does not change with increasing the THz field from 0.4 to 90 kV cm−1. Interestingly, they observe in both cases that the resonance is redshifted back to the original point after it was blue shifted after pump in the linear case in figure 46. This indicates that there is saturation in the nonlinearity near the resonance due to the high confinement of the field.
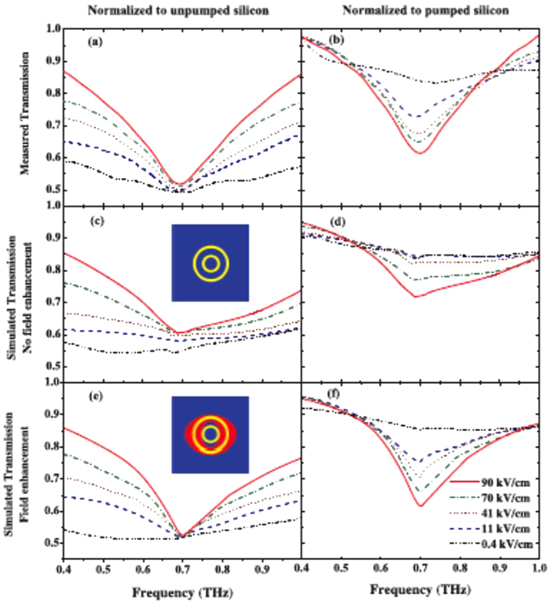
Figure 47. Experimental spectral transmission measured using (a) the unpumped and (b) pumped silicon wafer as a reference at five different THz levels. Simulated transmission amplitude using the unpumped (c) and pumped (d) silicon wafer as a reference, without considering any enhancement from the metamaterial resonators, and using the unpumped (e) and pumped (f) silicon wafer as a reference, with considering field enhancement in the metamaterial. The two insets in (c) and (e) show non-enhanced and enhanced field areas. Reprinted figure with permission from [228]. Copyright 2013 by the American Physical Society.
Download figure:
Standard image High-resolution imageThe experimental results have been simulated through combining a frequency domain solver in CST Microwave studio that models the resonance behavior as a simple parallel RLC circuit with a modified thin film model based on THz field-induced intervalley scattering for treating the photoconductivity of the pumped Si substrate under intense THz field. The simulation results showed a good matching with the experiment when field enhancement by the resonators is taken into account, indicating that the nonlinear response is highly enabled by the field enhancement in the metamaterial resonators.
Using superconducting metamaterial composed of SRRs made of superconducting niobium nitride (NbN) on MgO substrate, Zhang et al [229] reported nonlinear response exemplified by a decrease in the resonance transmission dip by increasing the THz field strength, as shown in figure 48. A change of ∼90% in the resonance transmission is observed for a change in the THz field from ∼1.9 to 30 kV cm−1. The response was attributed to THz field-induced breakup of Cooper-pairs, leading to increase in the real part of the photoconductivity and a decrease in the imaginary part with increasing THz field strength. However, it has been found that the nonlinear response becomes less pronounced, as a result of suppressing the superconductivity, when the temperature is increased towards the critical temperature Tc, as shown in figure 48(c). It is further noticed that the rise in temperature itself leads to attenuation of the LC resonance and showed a stronger impact on the transmission spectra in comparison to the field-induced nonlinearity.
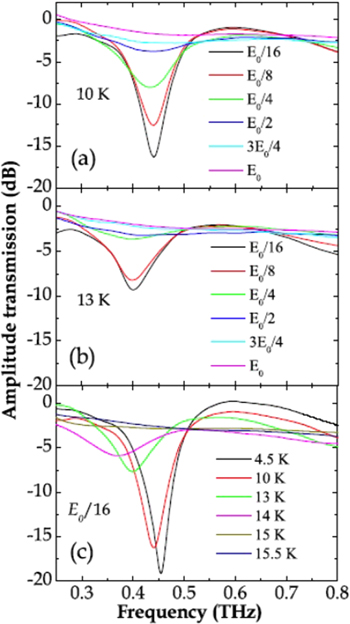
Figure 48. The spectral transmission of NbN metamaterial for various incident THz electric fields at (a) 10 K and (b) 13 K, respectively. (c) The measured transmission for various temperatures at low incident terahertz field of E0/16. Reprinted from [229], with the permission of AIP Publishing.
Download figure:
Standard image High-resolution imageIn a similar study, Grady et al [230] reported nonlinear THz response from metamaterial SRRs made of high Tc (∼90 K) superconductor YBa2C3O7−δ (YBCO) on LaAlO3 (LAO) substrate. The sample has shown LC resonance at ∼0.5 THz and dipole resonance at ∼1.2 THz. Both resonance dips were found to decrease with increasing the THz field, as shown in figure 49, which is similar to the above study by Zhang et al. It has also been found that the resonance frequency red-shifts at low temperatures and blue-shifts at temperatures close to Tc when the THz field is increased.
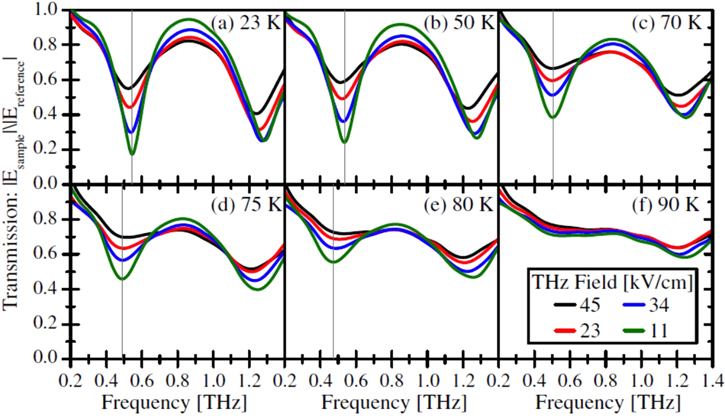
Figure 49. THz field strength dependent transmission through the metamaterial relative to an LAO reference substrate at several temperatures from 23 to 90 K, with the thin vertical lines indicating the resonance frequency at 11 kV cm−1 [230].
Download figure:
Standard image High-resolution imageTime-resolved collinear TPTP measurements have been performed for investigating the dynamics of the metamaterial response. The transmission spectrum as a function of the pump–probe delay time is shown in figure 50. A transient increase in the LC resonance transmission (that is, a reduction in the dip) and a redshift have been observed when the pump and probe pulses overlap, which is followed by a bi-exponential decay with time constants of 2.1 fs (fast decay) and 23 fs (slow decay). In contrast to the THz field-induced breaking up of the Cooper-pairs in the NBN superconducting metamaterial suggested by Zhang et al [229], Grady et al [230] finds this arguable, especially with the high Tc = 90 K considered here, which requires a large change in temperature to be induced by the THz field to break the Cooper-pairs. Instead, the total THz field-induced current is assumed to include two contributions from the normal Drude current due to population of normal carriers and from an accelerative superconducting current due to the population of superconducting electrons (Cooper-pairs). A critical intrinsic depairing current above which the kinetic energy density exceeds the condensation energy has been assumed. Thus, the increase in the THz field-induced currents with increasing the THz field above this critical depairing current leads to a decrease in the Cooper-pair density and in turn decreases the LC resonance transmission dip.
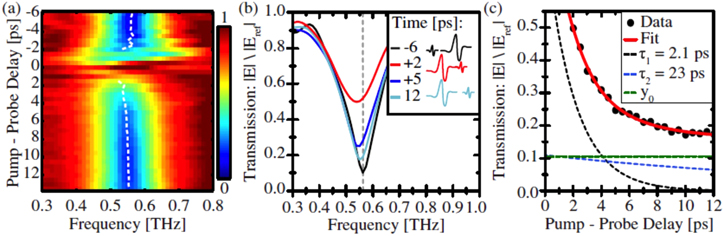
Figure 50. (a) Two-dimensional color map of TPTP spectral transmission of the sample at 23 K as a density plot where each horizontal slice is a spectrum at a given pump–probe delay. The white dashed line indicates the resonance frequency, (b) Spectral transmission at various pump–probe delays before (negative) and after (positive) pump, and (c) transmission at the metamaterial resonance as a function of pump–probe delay with a bi-exponential fit. The two components of the exponential decay and offset are indicated separately with dashed lines [230].
Download figure:
Standard image High-resolution imageIn metamaterial gold SRRs on vanadium dioxide (VO2), Liu et al [231] reported THz field-induced insulator-to-metal transition (IMT), in analogy to temperature induced transition. Figure 51(a) shows the dimensional structure of the metamaterial SRRs used in this study, with 76 μm lateral dimension, 100 μm periodicity and 1.5 μm capacitive gap. Linear THz-TDS of temperature induced IMT showed a 340 K transition temperature, above which the LC resonance transmission at 0.41 THz starts to disappear, as shown in figure 51(b). The nonlinear response of the SRRs has been tested at 324 K for in-gap THz fields ranging from 0.3 to 3.3 MV cm−1, as shown in figure 51(c), showing that the LC resonance transmission increases with increasing THz field. This was attributed to increase in the VO2 conductivity in the SRR gaps. A redshift is also seen in the 1.0 THz dipole resonance.

Figure 51. (a) An image of metamaterial SRRs deposited on VO2/sapphire, (b) temperature-dependent low-THz field spectral transmission of SRRs on VO2 LC and dipole resonances, and (c) field dependent nonlinear transmission of SRRs on VO2 at 324 K, for in-gap fields ranging from 0.3 to 3.3 MV cm−1. Reprinted by permission from Macmillan Publishers Ltd: [231], copyright 2012.
Download figure:
Standard image High-resolution imageAdditional time-resolved measurements following TPTP have been performed to account for the induced dynamics. Figure 52 shows the temporal evolution of the THz spectral transmission, showing that the 0.41 THz LC resonance transmission increases, whereas the 1.0 THz dipole resonance exhibits a redshift. The response was modeled by a two-step process in which the electric field reduces the Coulomb-induced activation barrier for carrier motion, i.e. the Poole-Frankel (PF) effect, increasing the free carrier density. This PF-effect-induced increase in density along with THz field-induced carrier acceleration leads to Joule heating through electron-lattice coupling. This in turn results in a temperature increase that drives the VO2 into the insulator-to-metallic transition. For 1 MV cm−1 in-gap field, 20 K increase in the lattice temperature has been estimated, which is sufficient to induce the IMT.
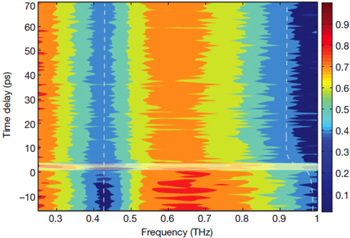
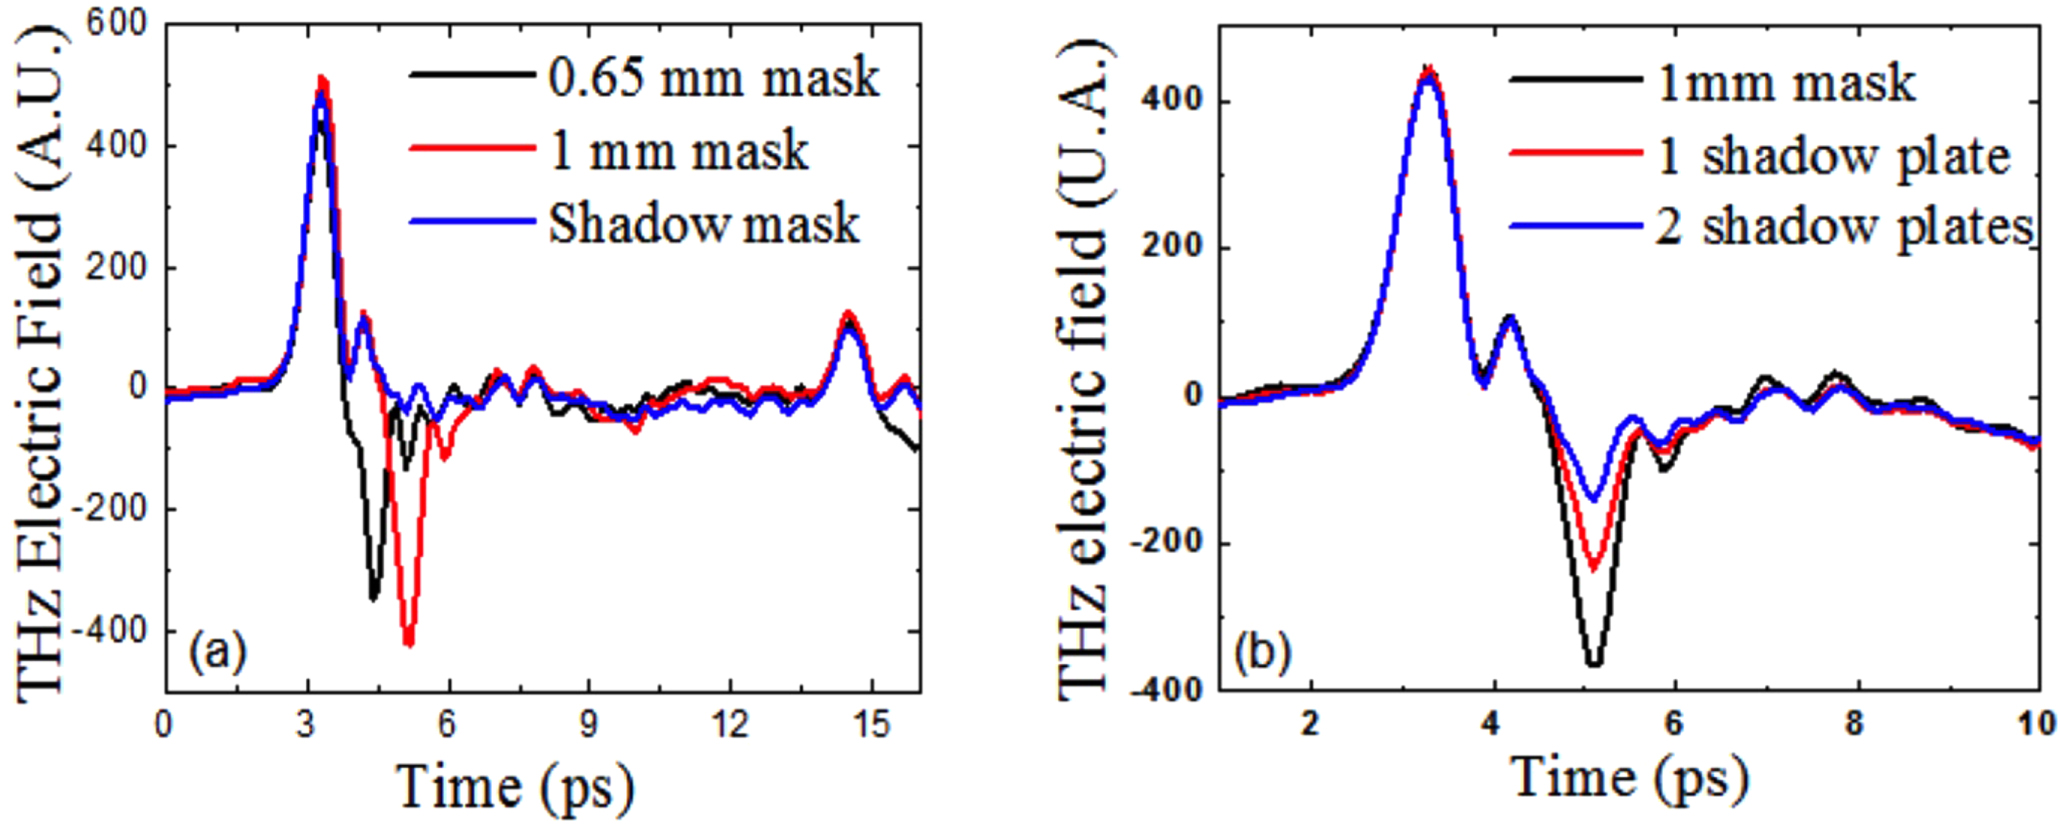
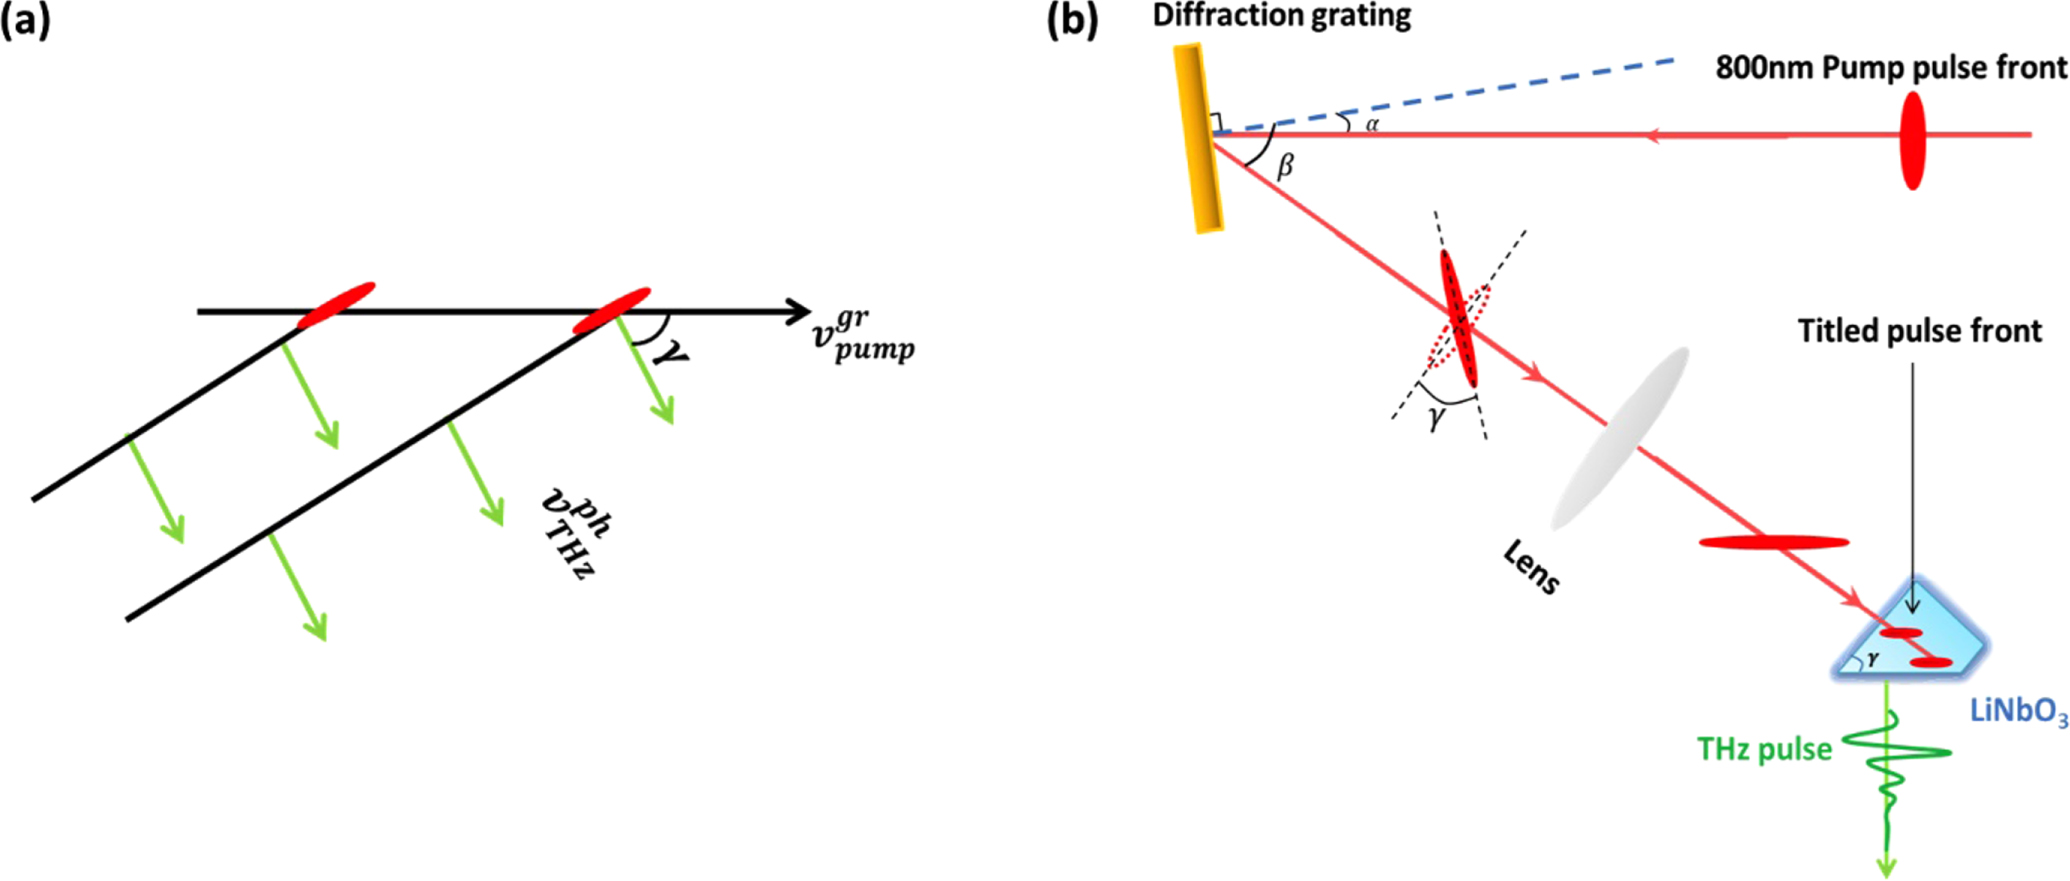
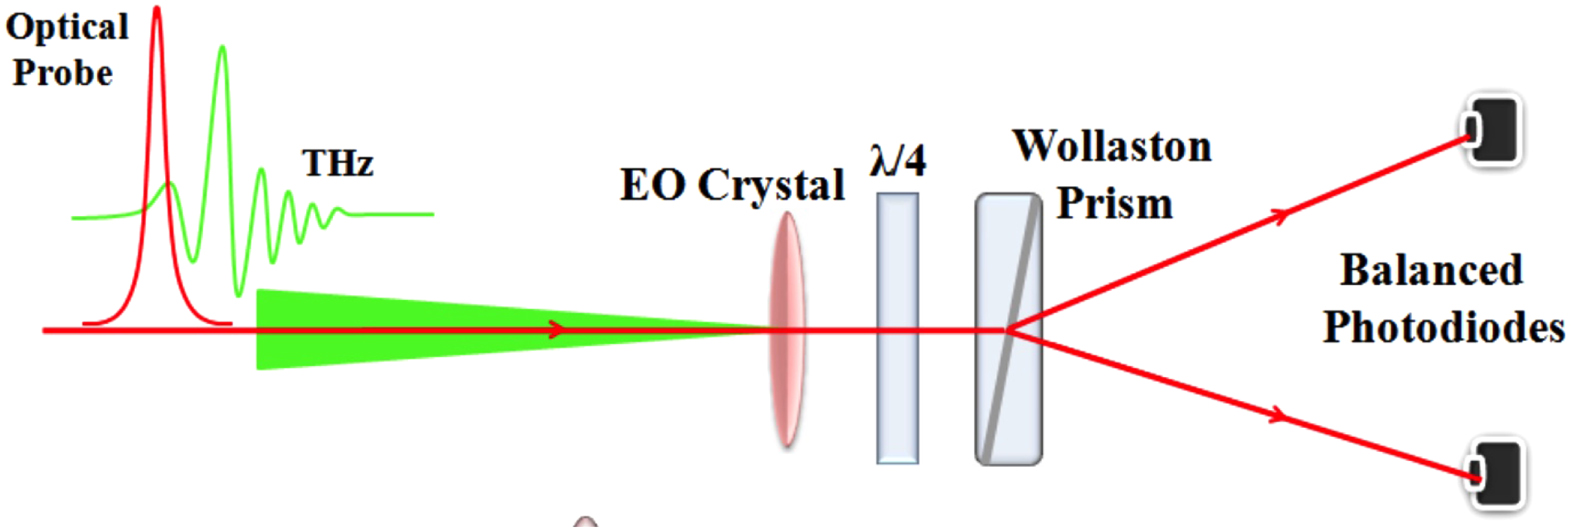
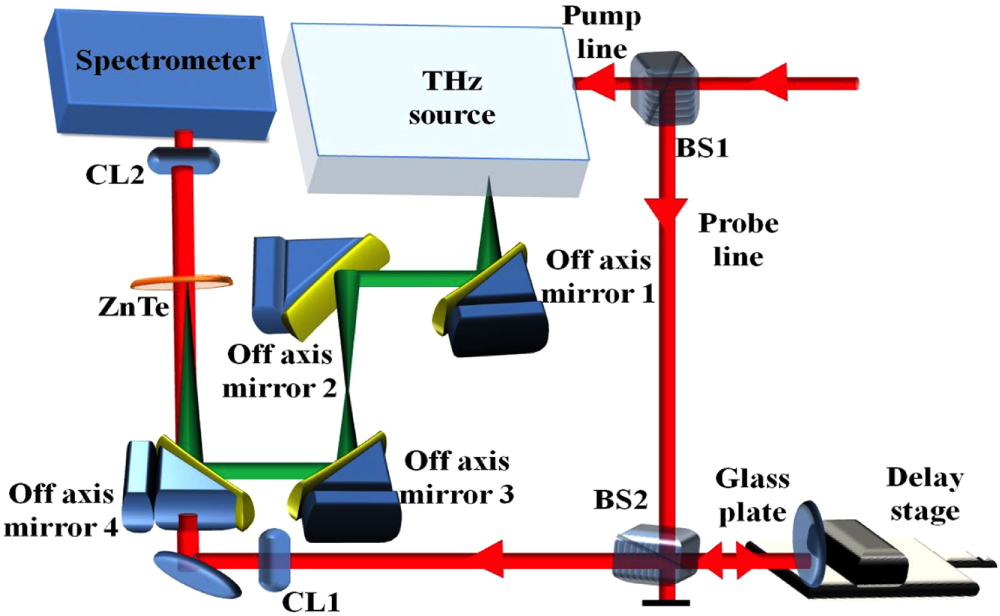
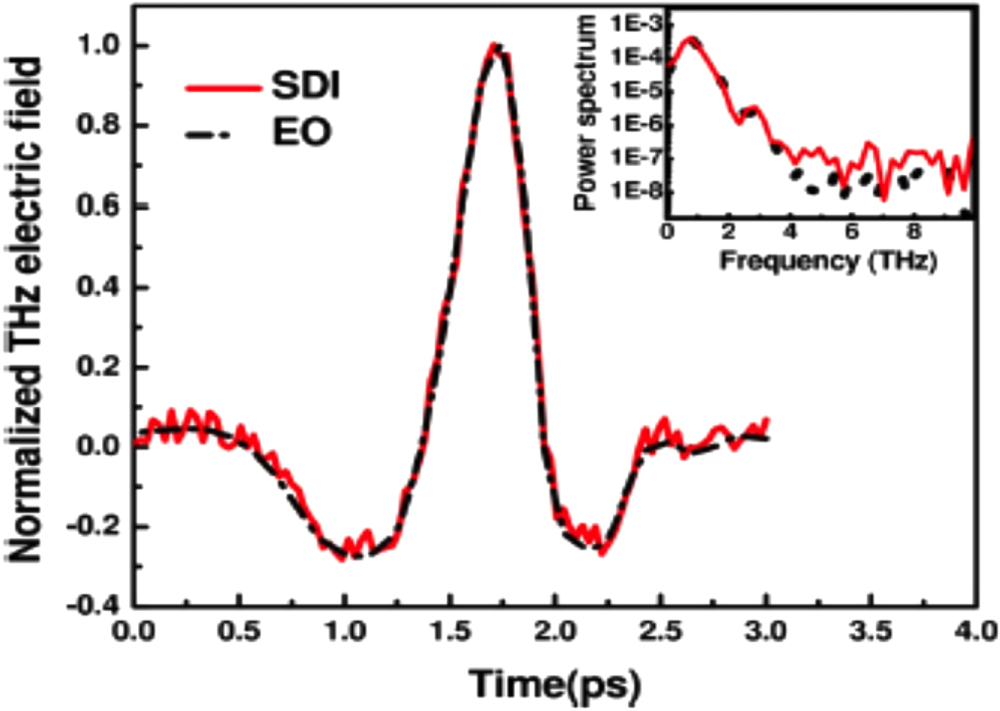
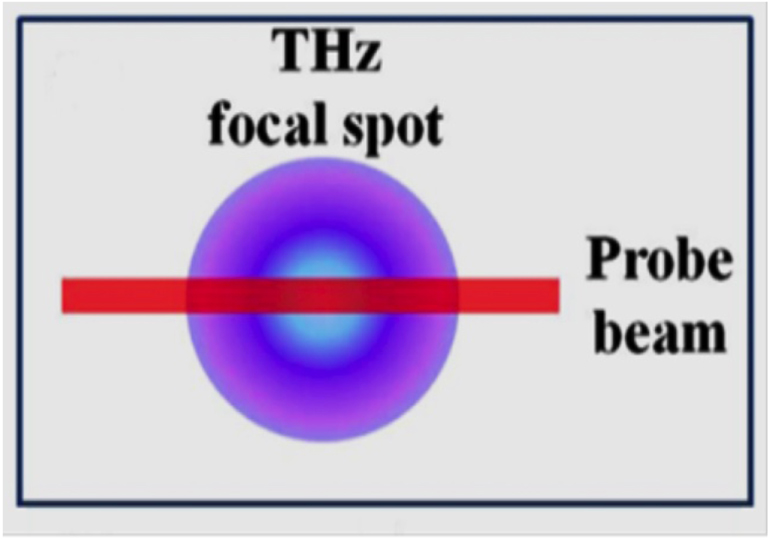
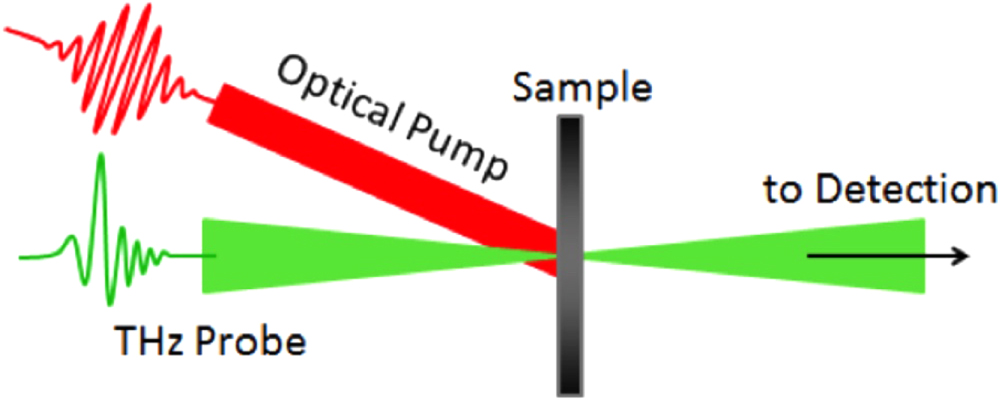
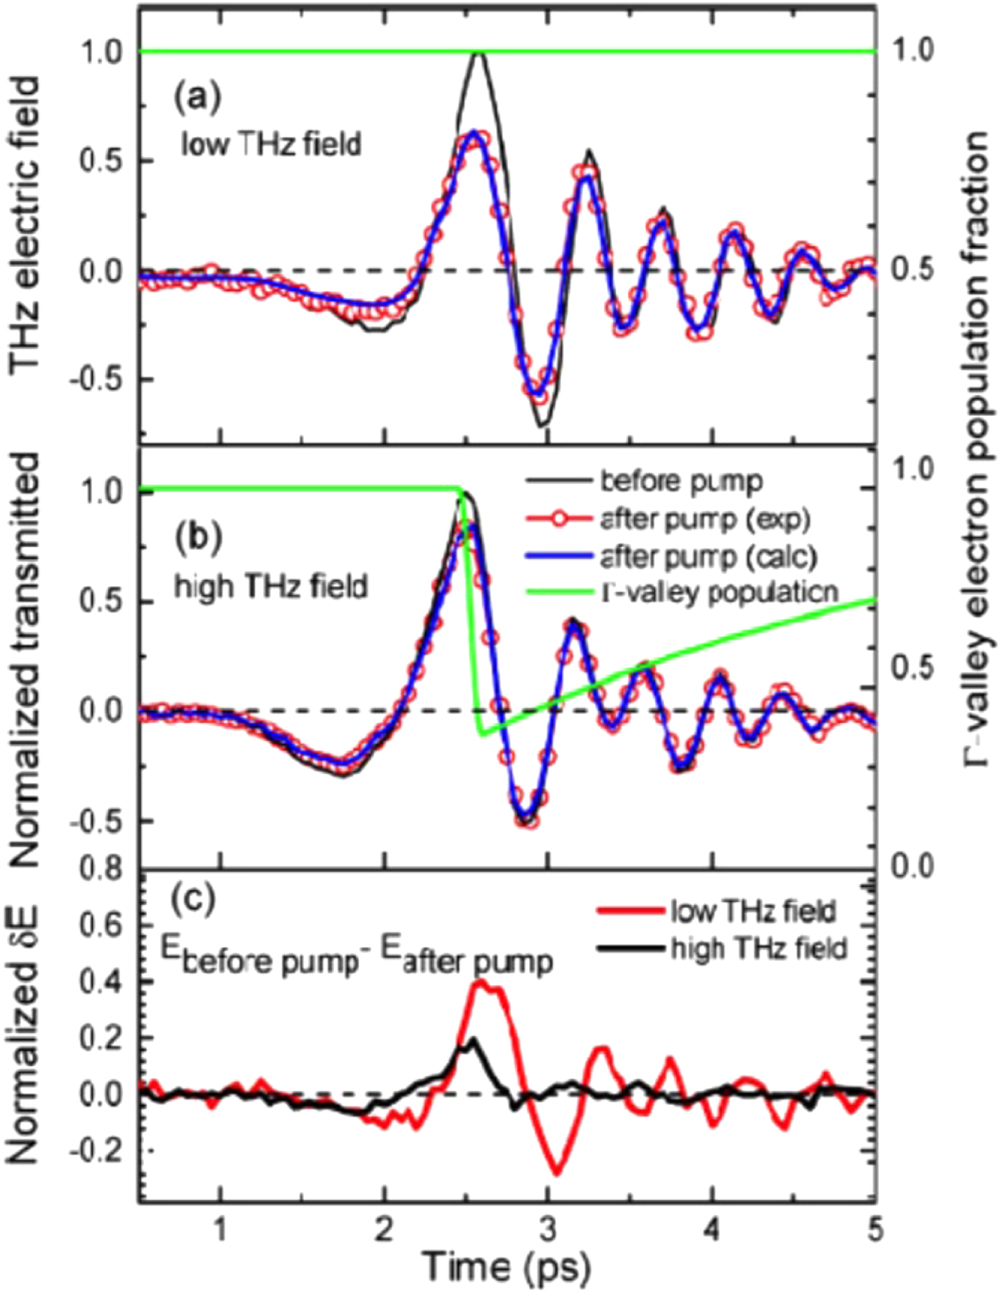
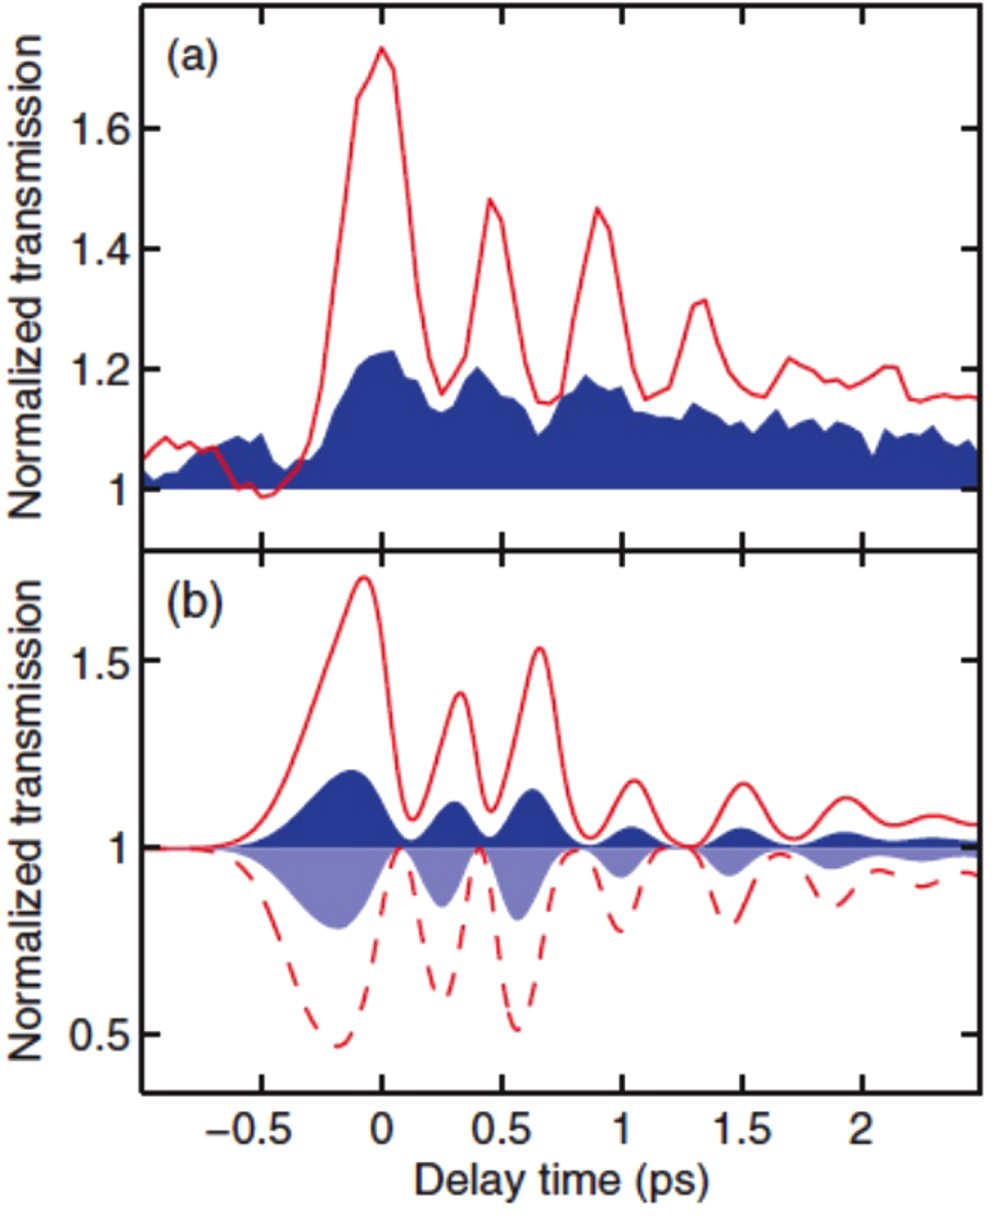
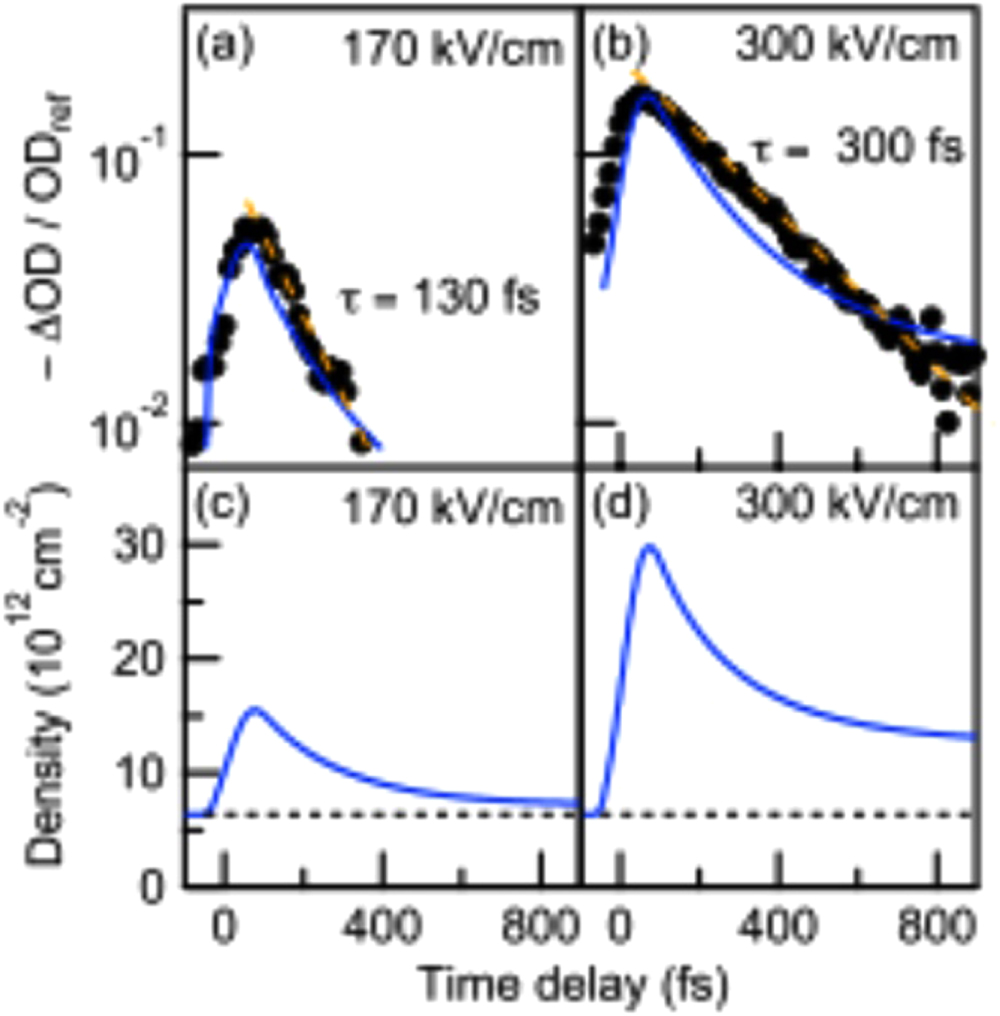
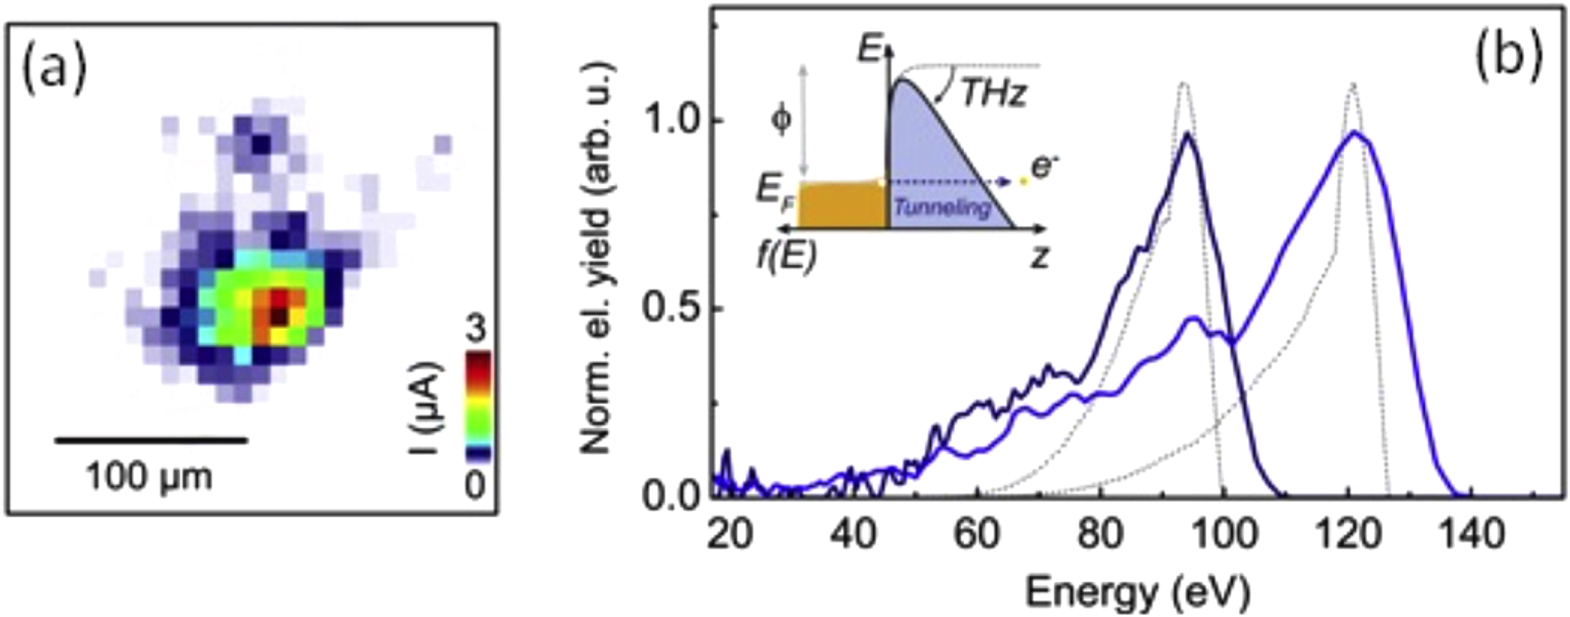
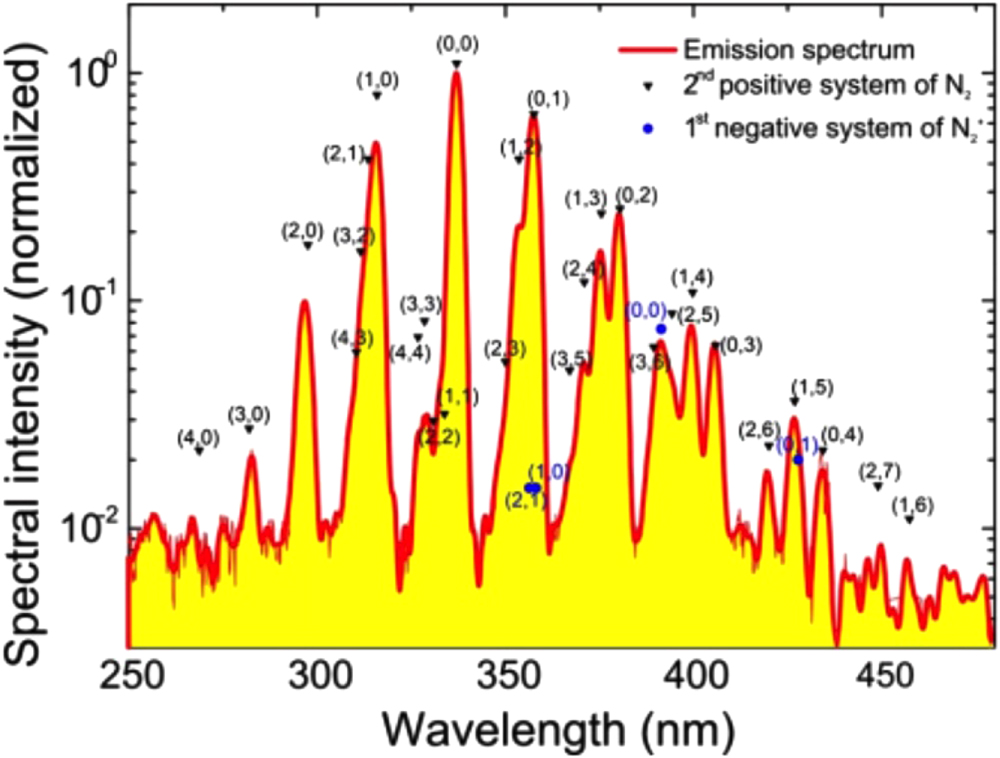
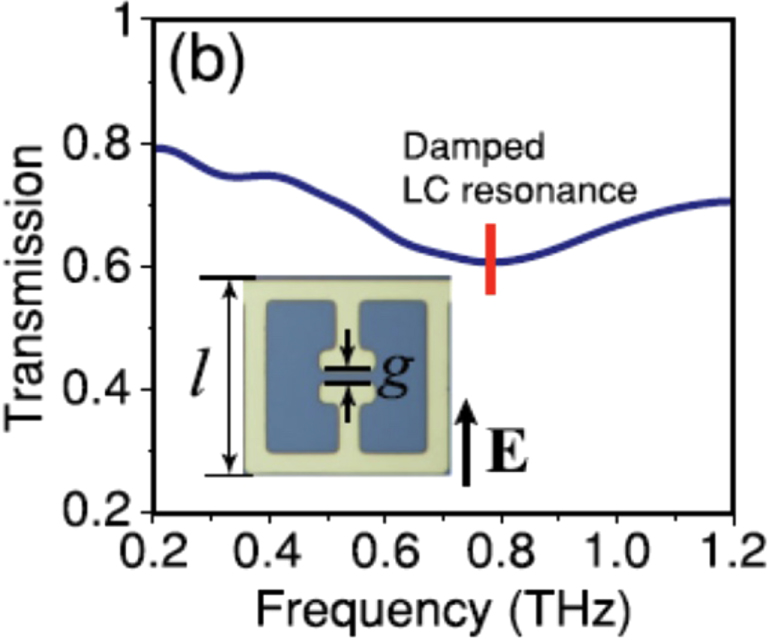
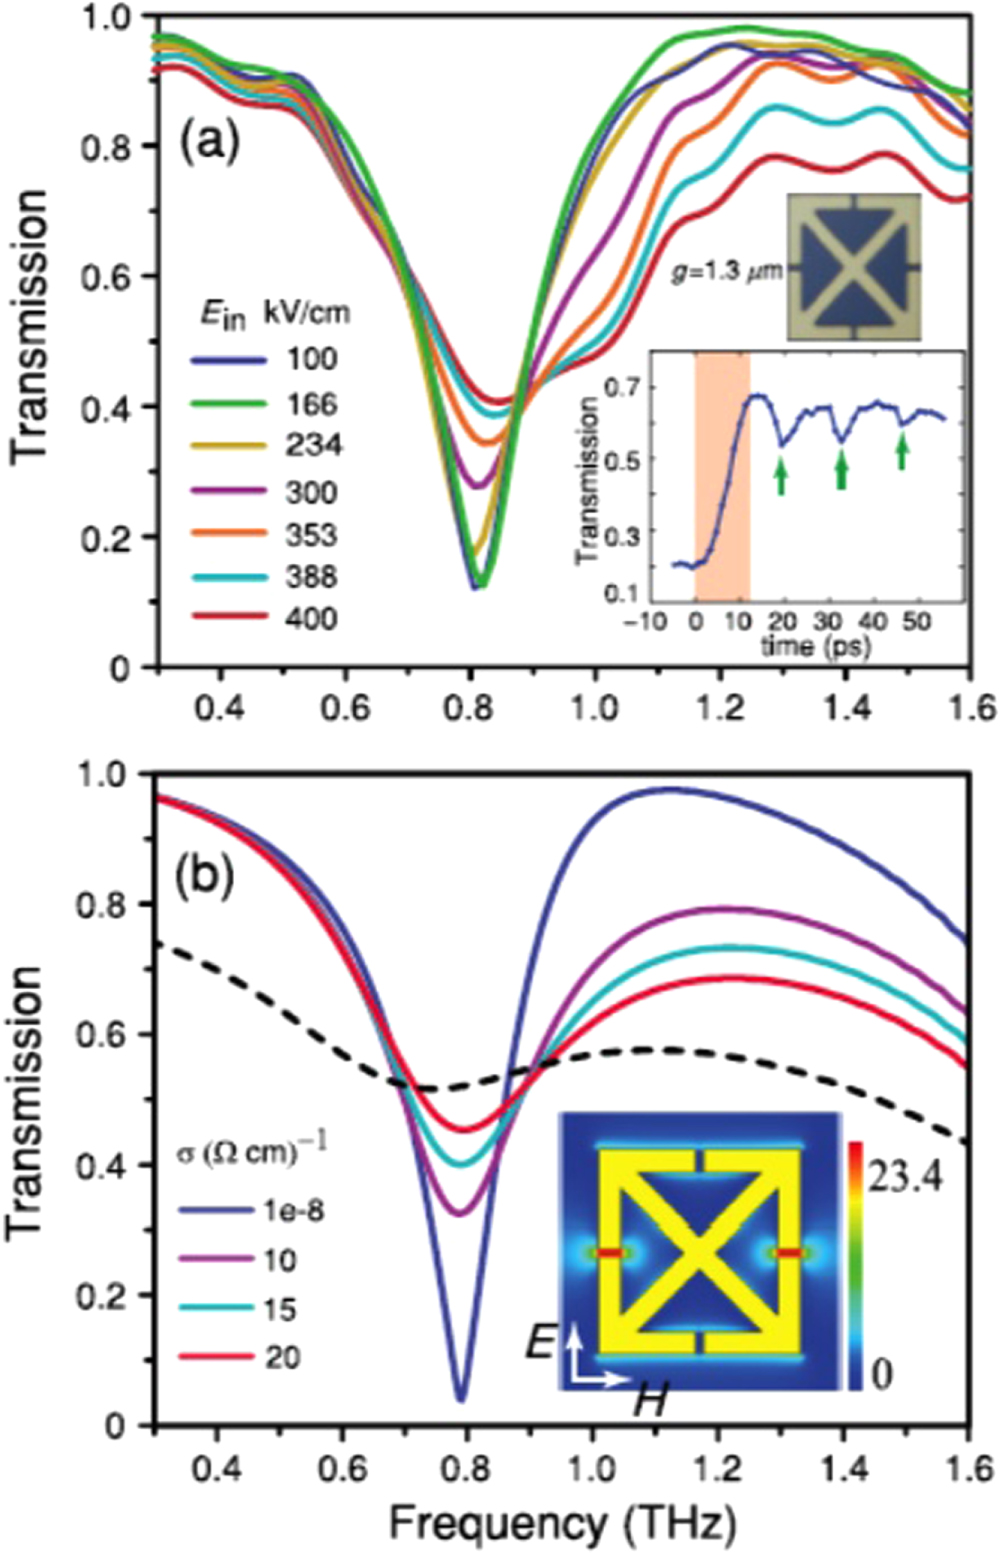
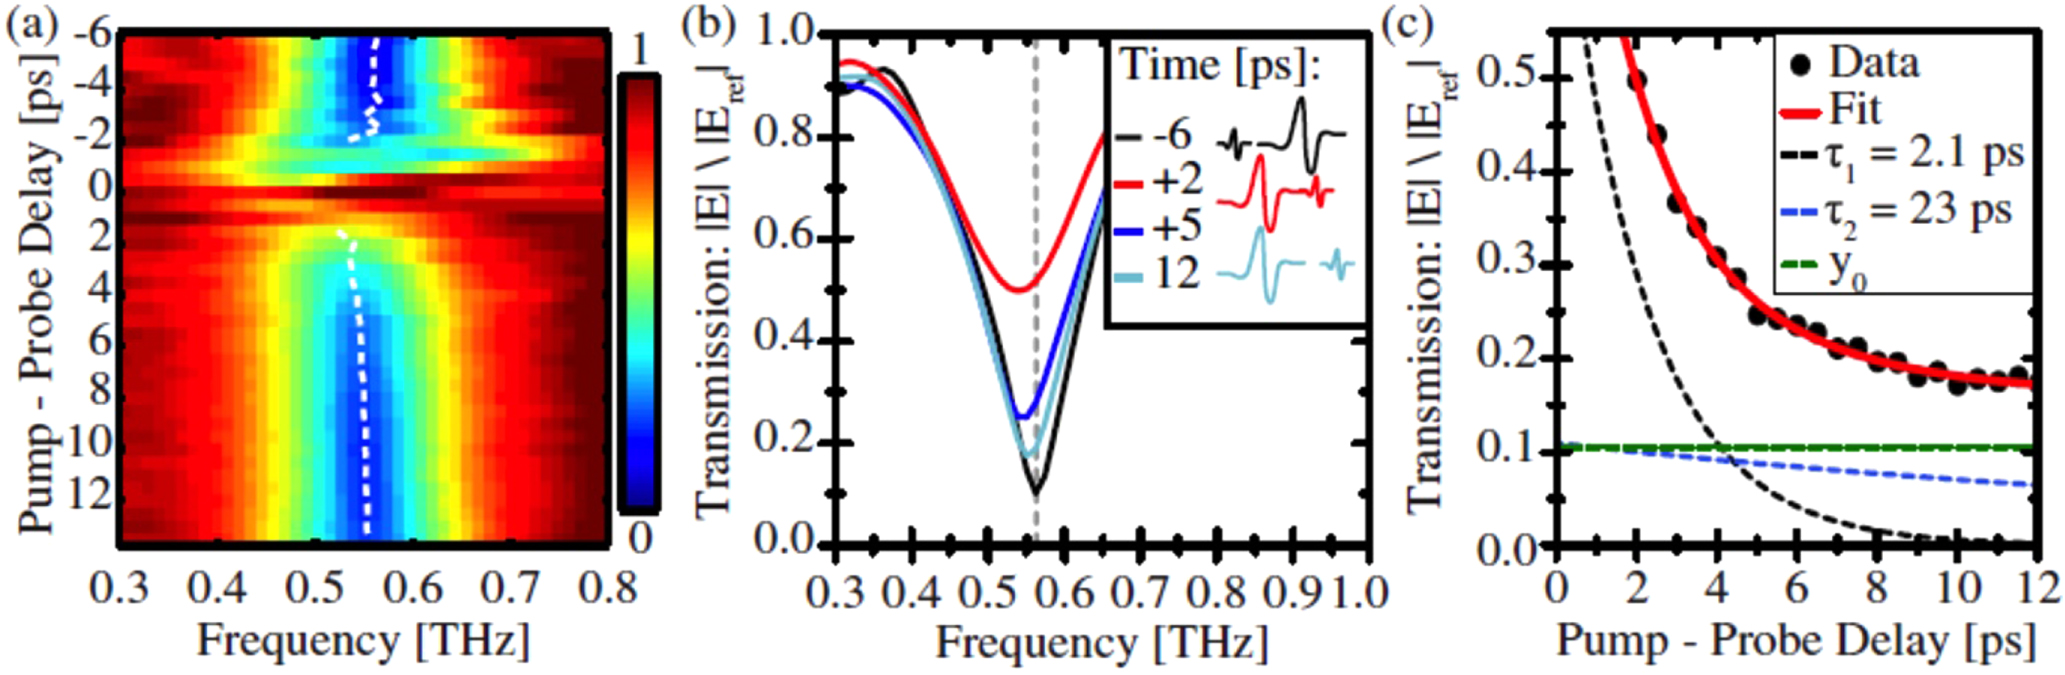
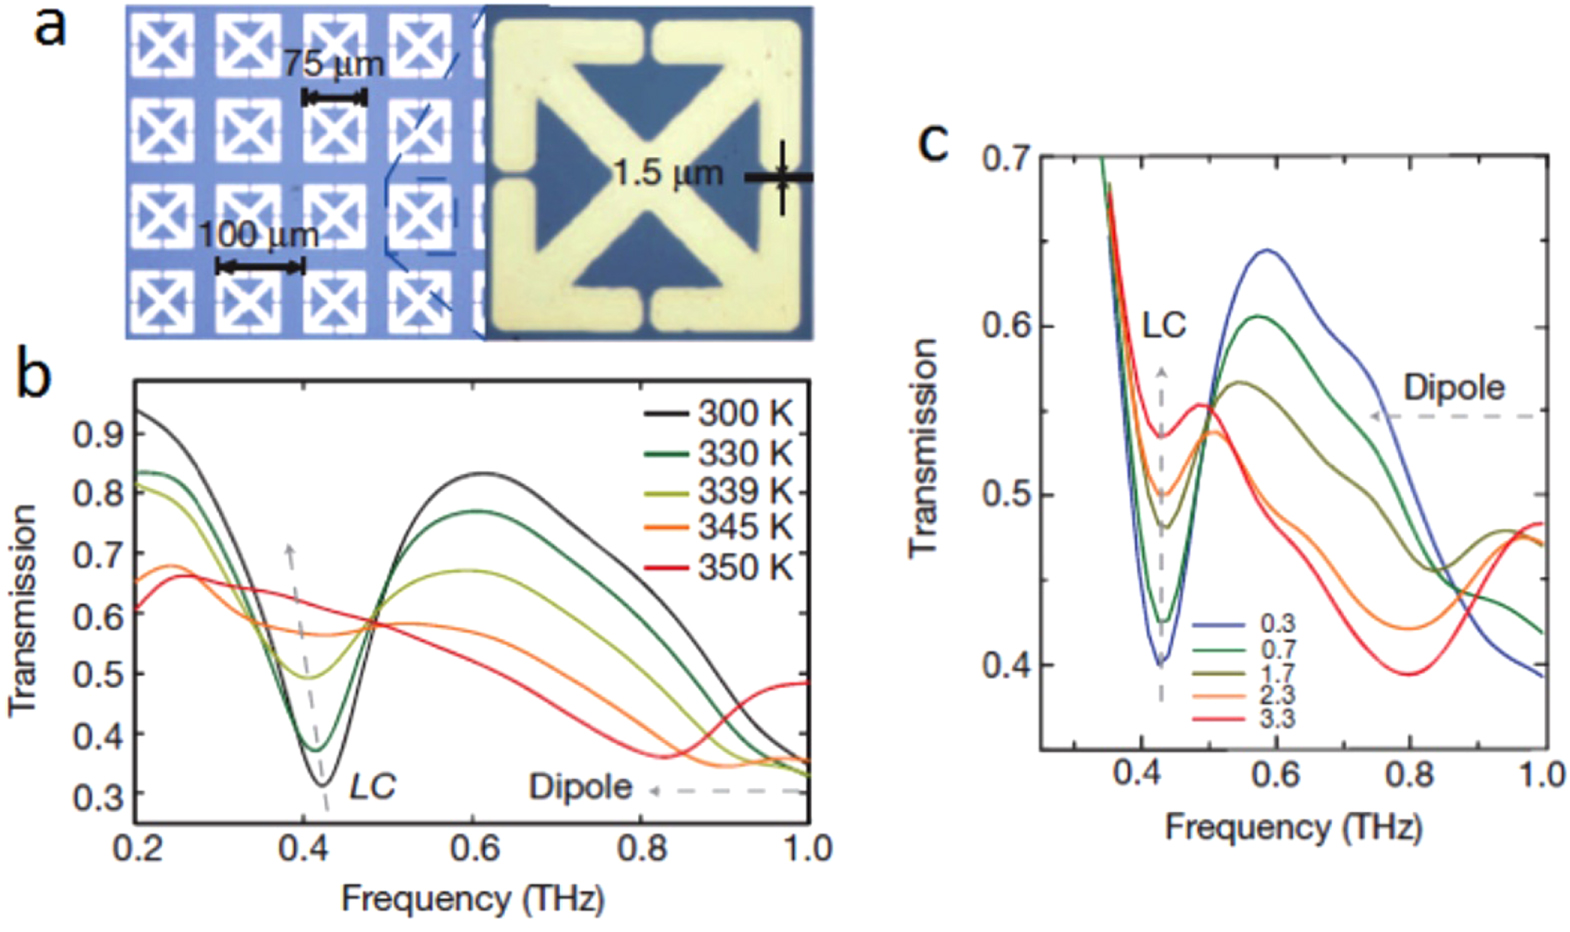
Figure 52. Two-dimensional color map of TPTP spectral transmission of metamaterial SRRs on VO2 at 1 MV cm−1 in-gap field strength. Reprinted by permission from Macmillan Publishers Ltd: [231], copyright 2012.
Download figure:
Standard image High-resolution image
In summary, the electromagnetic response of THz metamaterial can be controlled by THz field-induced nonlinear effects that manipulate the conductivity, leading to amplitude and spectral modulation. In addition to the THz field strength and the enhancement of the field in the metamaterial gap, the type of the metamaterial base substrate, being a conventional semiconductor, or a superconductor or a semimetal, can define the induced modulation. These effects can indeed enable fast-switching applications of metamaterials.
5. Future perspectives
The current article aims at providing an overview of the current status of the generation and application of intense THz radiation. The field is young and thus active, and there are new and exciting results in development as we speak. Therefore, this review only touches a fraction of what has been reported, and thus unfortunately cannot cover all the outcomes from the domain. As intense THz sources become more and more accessible, we could expect completely new avenues in science and technology to be opened, allowing us to witness many breakthroughs in this field soon. With advances in generation and detection of intense THz radiation, exploring the nonlinear electromagnetic properties of materials in the THz frequency range has become accessible. Already, various nonlinear THz phenomena can be probed now using different experimental techniques, which provide a higher degree of control. However, most of the materials still need further studies to explore their nonlinear THz properties. Exploring THz nonlinear optical phenomena such as THz field-induced Kerr effects, self-focusing and many other nonlinear effects is also highly exciting for future research works. We believe that this would not only be important for basic science, but also for technological advances, as we have already seen in the visible and near infrared wavelengths (for example, the Ti:sapphire laser). In addition, overcoming technical difficulties in the generation and detection of intense THz radiation is also open for researchers to participate strongly in. Increasing the DR, reaching higher S/N ratios and detecting broader THz spectra using the SDI technique, for example, is vital. Developing THz optics such as wave plates, filters, waveguides and many other THz optical components is also of an extreme importance. THz field-induced fast switching applications can be a direct outcome of employing intense THz radiation in technological applications. Employing metamaterials in THz magnetic field enhancement in magnetic switching applications is also a promising area of research. Thus, we hope that this short review would stimulate more efforts in this field.