
Abstract
Early detection of heavy metals in drinking water is a fundamental step that must be taken to prevent adverse effects on health. This research aims to develop a heavy metal ion detector by utilizing the fluorescence properties of carbon dots. Cdots were synthesized using the microwave irradiation method based on the central composite design: urea mass 0.31–3.68 gr; reactor power 200–1000 W; synthesis time is 13–46 min, and the response is quantum yield. Material characterization includes PL, TEM, UV-VIS, XRD, and FTIR. The selectivity and sensitivity of Cdots as detectors were tested for Ag+, Bi3+, Ni2+, Al3+, Co2+, Pb2+, Fe3+, Zn2+, Zr4+, and Hg2+ ions at concentrations of 0–10 μM. The results showed that Cdots were successfully synthesized by fluorescent light green at 544 nm. An adequate response model is quadratic with the formulation QY = +58.36 + 10.41X1 + 14.06X2 +13.59X3–5.57X2X3–4.89X12−8.60X22–5.40X32. The best Cdots were obtained in the formulation of R9 (3 g, 800 W, 40 min), which resulted in a QY of 74.39%. The characteristics of Cdots are spherical, diameter 6.6 nm, the bandgap of 2.53 eV, and having an amorphous structure. The surface of Cdots contains various functional groups such as O–H, C–H, C=O, C–N, and C=C. In the heavy metal detection test, Cdots showed specific sensitivity to Fe3+ ions. The addition of Fe3+ concentration and the extinction of Cdots fluorescence intensity formed a linear correlation F0/F = 0.08894[Fe3+]+0.99391 (R2 = 0.99276). The detection ability of Cdots for Fe3+ ions reaches a concentration of 0.016 ppm, much lower than the regulatory threshold limit of SNI, WHO, and IBWA. The detection of Fe3+ ions in drinking water uses a fluorescence technique consistent with the SSA and ICP-OES. Based on these results, the fluorescence technique using Cdots can be an instrument for quality control of the final drinking water product.
Export citation and abstract BibTeX RIS

Original content from this work may be used under the terms of the Creative Commons Attribution 4.0 licence. Any further distribution of this work must maintain attribution to the author(s) and the title of the work, journal citation and DOI.
1. Introduction
One of the critical parameters to determine water quality is the content of heavy metals. Heavy metals are various metals with a density of more than 5 g cm−3 [1]. Heavy metal content that exceeds the threshold limit in water is often associated with pollution because of its dangerous presence. In addition to impacting the environment, heavy metals can also harm health. Heavy metals that enter the human body at certain levels can trigger the emergence of various health problems such as acute kidney disorders, brain nerve disorders in children, and various other serious illnesses [2, 3]. Heavy metals can be divided into two types, namely essential heavy metals and non-essential heavy metals. Essential heavy metals are heavy metals whose presence is required by several living things but will cause toxic effects if the amount is excessive; examples of these metals are Fe, Zn, Cu, and Co. Non-essential heavy metals are toxic metals if consumed by living things and cause harm to human health, such as Pb, Sn, Hg, and Cd. Heavy metal contamination usually comes from various human anthropogenic activities, including industry, agricultural waste, and medical.
Drinking water is a basic need of every human being that needs to be managed and protected. Based on the regulation of the Ministry of Health of the Republic of Indonesia number 492 of 2010, the maximum permissible levels of heavy metals in drinking water are arsenic 0.01 ppm, cadmium 0.003 ppm, aluminum 0.2 ppm, copper 2 ppm, iron 0.3 ppm, lead 0.01 ppm, manganese 0.4 ppm, and zinc 3 ppm. Drinking water produced from the drinking water supply system (SPAM) consumed by the general public must meet the quality requirements based on the regulation of the minister of health. Drinking water that does not meet quality requirements is prohibited from being distributed to the public. Therefore, the first action taken to determine the level of feasibility/quality of drinking water is to detect the content of heavy metals. Detection of heavy metals is essential information as a form of control and quality assurance of drinking water products.
Detection of heavy metals has been carried out using various techniques, such as electrochemistry [4], atomic absorption spectroscopy [5], surface plasmon resonance [6], capillary electrophoresis [7], and plasma mass spectrometry [8]. The advantage of analysis with this technique is that it allows for the detection of multielement heavy metals. However, some of these techniques require large instruments, complicated preparation, take a long time, and are expensive [9]. In addition, these techniques require special skills to be able to operate them. The development of heavy metal detection techniques is currently experiencing a paradigm shift from a complex system to a more straightforward system. A simple technique currently being developed by researchers is to utilize the optical properties of fluorescence materials [10]. The fluorescence principle has been widely proposed because observations can be made by direct eye, fast reading, and low cost, so optical detection based on fluorescence properties can encourage faster and simpler analysis [11]. One of the environmentally friendly fluorescence materials that can be developed into heavy metal detectors is carbon dots (Cdots).
Cdots are carbon materials that have a particle size of less than 10 nm. Cdots have low toxic properties, high biocompatibility, dissolved in water, optical stability, and high luminescence [12]. Several studies have shown that Cdots are sensitive to several heavy metal ions including Ag+ [13], Hg2+ [14], Cr6+ [15], Pb2+ [4], and Cu2+ [16]. The detection technique developed using Cdots material applies two principles: the turn-off and turn-on detection mechanisms [17]. The challenge faced in using Cdots as a heavy metal detector is the limit of detection, which is still above the threshold for heavy metal levels in drinking water so that it does not meet the feasibility as a detector to produce drinking water quality under government regulations. The inability of Cdots to detect heavy metals below the threshold is due to the low quantum yield (QY), so the fluorescence produced is also low [18]. It is suspected that the majority of Cdots were synthesized in one factor at a time (OFAT), where the synthesis only took into account one influencing factor.
Cdots can be synthesized using top-down or bottom-up methods. The top-down method can be done through arc discharge, laser ablation, plasma, and chemical oxidation. In comparison, the bottom-up method can be done by microwave irradiation, pyrolysis, and hydrothermal. Among these various methods, the microwave-assisted method provides a fast, easy, and more efficient Cdots synthesis process [19]. This method works by vibrating the carbon chain so that it undergoes rearrangement [20]. The process is simple, efficient and fast [21], and environmentally friendly [22], making this method widely used by researchers. The microwave irradiation method produces a more uniform heating process resulting in a shorter reaction and can improve product quality and purity level [23].
Until now, it is still rare to find a formulation between the composition of the raw material and the synthesis method using the microwave irradiation method to produce optimal quantum yield Cdots. In this work, the synthesis of Cdots based on citric acid will be carried out with a multifactor design of experiment, namely reactor power, synthesis time, and urea mass. Multifactor optimization is carried out to obtain the maximum variable and quantum yield formulation. Determination of the maximum conditions in the synthesis of Cdots was carried out using the Response Surface Methodology (RSM) Central Composite Design (CCD) method. The best formulation produced by RSM is based on the highest QY Cdots. If Cdots have a high QY, then the luminescence intensity is higher, so the fluorescence changes due to heavy metals are easier to observe. The ability of Cdots to detect heavy metals in drinking water was tested on various types of heavy metals and various concentrations to determine the level of selectivity and sensitivity. This work expects the synthesized Cdots to detect heavy metals below the threshold to become detector candidates that produce drinking water quality according to government regulations. Cdots are implemented directly on water samples from water companies (PDAM) Tirta Moedal, Semarang City.
2. Method
2.1. Materials and tools
The raw material in this research is Citric Acid Monohydrate C6H8O7 (Merck KgaA), Urea CH4N2O (Merck KgaA), Cobalt (II) nitrate hexahydrate Co (NO3)2*6H2O (Merck KgaA), Bismuth (III) nitrate Bi5O(OH)9(NO3)4 (Merck KgaA), Mercury (II) nitrate monohydrate Hg(NO3)2*H2O (Merck KgaA), Lead (II) nitrate Pb(NO3)2 (Merck KgaA), Iron (III) nitrate nonahydrate Fe(NO3)3*9H2O (Merck KgaA), Silver nitrate AgNO3 (Merck KgaA), Zinc nitrate tetrahydrate Zn(NO3)2*4H2O (Merck KgaA), Nickel (II) nitrate hexahydrate Ni(NO3)2* 6H2O (Merck KgaA), Zirconium (IV) oxide chloride octahydrate Cl2OZr*8H2O (Merck KgaA), Aluminium nitrate nonahydrate Al(NO3)3*9H2O (Merck KgaA) and Aquades. The tools used are Microwave reactor Samsung MS28J5255UB, Ultrasonic Homogenizer Krisbow, Hotplate magnetic stirrer, Digital balance, Centrifuge, UV Box, Laser, Lux meter, Pipette, Mortar, Cup, Bekker, measuring cup, Spatula, Bottle vial, and filter paper.
2.2. Material synthesis
The raw materials in this research are citric acid and urea. Citric acid as a carbon source while urea as a nitrogen source. 2 grams of citric acid and 0.31 of urea 1, 2, 3, and 3.6 grams were dissolved in 60 ml distilled water. Homogenization was carried out using a hotplate stirrer at a temperature of 70 °C 600 rpm for 15 min, followed by an ultrasonic bath at 40 °C for 20 min. The homogenized solution was put into a microwave reactor. The reactor used for the synthesis in this study is the Samsung MS28J5255UB reactor. The solution was synthesized at a 200, 400, 600, 800, and 1000 watt reactor power for 13, 20, 30, 40, and 46 min. The Cdots synthesis scheme can be seen in figure 1. The experimental design in this study used an Expert 10 design with three factors: urea mass, microwave power, synthesis time, and one response, namely quantum yield (QY). The experimental design carried out is formed in code based on levels.

Figure 1. Schematic of Cdots synthesis procedure.
Download figure:
Standard image High-resolution image2.3. Material characterization
Absorption spectrum analysis was performed using a UV-Vis spectrophotometer (Alpha Series Bruker, USA). Emission spectrum analysis was performed using Optical Multi Analysis (OMA) with a laser (405 nm) as the excitation source. Determination of functional groups in the wavenumber range of 400-4000 cm−1 using the Fourier Transform Infrared (FTIR) Perkin Elmer Spectrum IR 34582. The crystallinity of Cdots was analyzed using the Shimadzu Maxima XRD-700. Analysis of particle size and distribution using the Transmission Electron Microscopy TEM JEM-1400. The research data is processed using various supporting software, such as Microsoft Excel, Origin, Design Expert, Qualx, and ImageJ. The experimental design carried out is coded according to levels as shown in table 1.
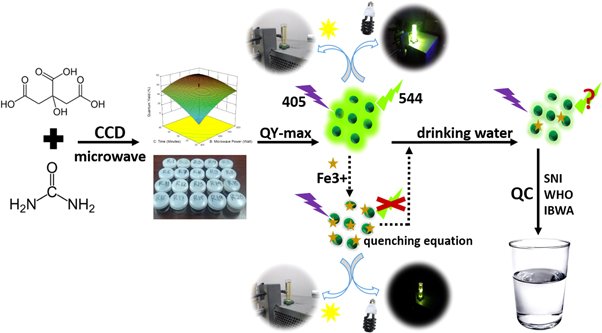
Figure 2. Research schematic illustration.
Download figure:
Standard image High-resolution image2.4. Calculation of the QY
Quantum Yield (QY) is the ratio of the number of emitted photons to the number of absorbance photons produced by the fluorescence material. QY Cdots can be measured by comparing QY quinine sulfate as a standard fluorescence material. Cdots were dissolved in distilled water, while quinine sulfate was dissolved in 0.1 M H2SO4 (QY = 0.54;  = 1.33) [24, 25]. QY is calculated based on the following equation:

where QY represents the Quantum yield, I represent the integrative fluorescence area, A represents the absorbance intensity at the excitation wavelength of 405 nm, and  represents the solvent's refractive index. The subscript 'c' refers to Cdots, and 's' refers to the quinine sulfate material. The absorbance intensity (A) was obtained based on testing using a UV-Vis spectrophotometer. The integrative fluorescence area (I) was obtained based on testing using an OMA spectrophotometer, then processed using origin software.
2.5. Heavy metal ion detection
Selectivity test was carried out by adding 2 ml of heavy metal ion solution to 100 ppm Cdots solution. In this study, the heavy metal ion solutions tested were Ag+, Bi3+, Ni2+, Al3+, Co2+, Fe3+, Pb2+, Zn2+, Zr4+, and Hg2+ ions. Observations of changes in the fluorescence intensity of Cdots before and after administration of heavy metal ion solutions were carried out under UV-C exposure. Changes in fluorescence intensity indicate the sensitivity of Cdots to the presence of heavy metal ions. Furthermore, to analyze the sensitivity, heavy metal ion concentrations were added from 0 to 50 μM. Determination of the concentration limit value that can still be read through fluorescence extinguishing using the calculation of the limit of detection (LOD) based on the Stern-Volmer equation:

where F = fluorescence intensity, ksv: stern volmer constant, and X: concentration of metal used. The slope and standard deviation can be obtained from the Stern-Volmer equation, then used to calculate the detection limit. The detection limit can be calculated by:

where LoD: Detection Limit, SD: Standard Deviation, and S: Slope.
2.6. Drinking-water heavy metal detector implementation
The synthesized Cdots material was implemented as a heavy metal ion detector in drinking water to determine the feasibility and accuracy of the fluorescence technique as a detector in actual samples. The test was carried out by calculating the levels of heavy metal ions from PDAM Tirto Moedal Semarang City water three times at different times (May-July 2021). The calculation of heavy metal content from the previously obtained LoD equation is then compared with the results of testing other techniques, such as Atomic Absorption Spectroscopy (AAS) and Inductively Coupled Plasma—Optical Emission Spectrometry (ICP-EOS). Based on this comparison, if there is a match between the results, Cdots as a fluorescence material fulfills the feasibility of a heavy metal detector. On the other hand, if there is a significant difference between the results of the detection method, then the accuracy of Cdots is doubtful. In general, the overall research scheme is illustrated in figure 2.
3. Results and discussion
3.1. Synthesis of cdots as fluorescence material
Fluorescence is the main characteristic of Cdots, which is the benchmark for the success of the synthesis. A preliminary study was conducted by comparing the fluorescence effect between Cdots R1-R20 and commercial charcoal exposure to UV and a laser. In commercial charcoal materials, a small part of the laser beam is reflected off the cuvette, and most of it penetrates the solution without causing a fluorescence effect around the material. In the synthesized Cdots material, a small part of the laser beam is reflected by the cuvette, and most of it penetrates the solution accompanied by an excellent green fluorescence effect. The Cdots solution showed consistent luminescence and did not undergo photobleaching or fading. This consistent fluorescence effect is an early indicator that the synthesized black powder is suspected of becoming a fluorescence material to be an alternative in detection techniques. The results of observations of the material under visible light and the fluorescence effect under laser light exposure are shown in figure 3. The fluorescence effect on Cdots can occur because the laser beam causes electrons to move from the ground state (valence band) to the excited state. From the excited state, electrons will experience non-radiative relaxation towards the conduction band and finally return to the ground state while releasing lower energy in the form of emission at a particular wavelength [26, 27]. This emission wavelength is then visible to the naked eye with a specific color. The greater the fluorescence effect, the brighter the Cdots will visually glow.

Figure 3. The appearance of (a) activated carbon under visible light (b) activated carbon under UV laser exposure (c) Cdots under visible light (d) Cdots under UV laser exposure.
Download figure:
Standard image High-resolution imageTable 1. Factors and research levels.
| Level | |||||||
|---|---|---|---|---|---|---|---|
| Symbol | Variable | Unit | −alfa | −1 | 0 | 1 | +alfa |
| X1 | Urea Mass | Gram | 0.31 | 1 | 2 | 3 | 3.68 |
| X2 | Reactor Power | Watt | 200 | 400 | 600 | 800 | 1000 |
| X3 | Time | Minutes | 13 | 20 | 30 | 40 | 46 |
3.2. Response surface methodology
The distribution of the actual and predicted QY values shows an insignificant difference, and their comparison forms linearity, as shown in table 2. This comparison of the actual versus predicted values shows that the resulting model describes the actual conditions. It indicates that the experiments carried out have a reasonably good precision value, and the suitability of the data obtained does not have too far an amplitude. The highest response is R9 of 74.39%, while the lowest response is R15 of 1,53%. This result means that if 100 quantities of energy (photons) penetrate the Cdots R9 solution, 74.39 quantities glow with a bright green emission color. On the other hand, if there are 100 quantities of energy (photons) that penetrate the Cdots R15 solution, only 1.53 quantities are emitted in the form of fluorescence.
Table 2. Actual versus predicted yield quantum response data.
| Run | Factors | Factors | Quantum yield | |||||
|---|---|---|---|---|---|---|---|---|
| R | X1 | X2 | X3 | Urea mass (g) | Reactor power (W) | Time (min) | Actual (%) | Prediction (%) |
| R1 | −1 | 1 | −1 | 1 | 800 | 20 | 39.90 | 38.42 |
| R2 | 0 | 0 | +alfa | 2 | 600 | 46 | 63.30 | 65.96 |
| R3 | 1 | −1 | 1 | 3 | 400 | 40 | 60.71 | 58.31 |
| R4 | −alfa | 0 | 0 | 0.31 | 600 | 30 | 22.96 | 27.02 |
| R5 | 1 | −1 | −1 | 3 | 400 | 20 | 17.14 | 14.56 |
| R6 | 0 | 0 | 0 | 2 | 600 | 30 | 57.07 | 58.36 |
| R7 | 0 | 0 | 0 | 2 | 600 | 30 | 63.86 | 58.36 |
| R8 | 0 | 0 | −alfa | 2 | 600 | 13 | 17.41 | 20.23 |
| R9 | 1 | 1 | 1 | 3 | 800 | 40 | 74.39 | 74.09 |
| R10 | 0 | 0 | 0 | 2 | 600 | 30 | 62.94 | 58.36 |
| R11 | 0 | 0 | 0 | 2 | 600 | 30 | 54.30 | 58.36 |
| R12 | 0 | 0 | 0 | 2 | 600 | 30 | 59.87 | 58.36 |
| R13 | −1 | −1 | 1 | 1 | 400 | 40 | 34.47 | 30.85 |
| R14 | 0 | −alfa | 0 | 2 | 200 | 30 | 5.02 | 10.40 |
| R15 | −1 | −1 | −1 | 1 | 400 | 20 | 1.53 | −2.05 |
| R16 | 0 | 0 | 0 | 2 | 600 | 30 | 53.07 | 58.36 |
| R17 | 1 | 1 | −1 | 3 | 800 | 20 | 52.86 | 52.61 |
| R18 | 0 | +alfa | 0 | 2 | 1000 | 30 | 57.59 | 57.70 |
| R19 | +alfa | 0 | 0 | 3.68 | 600 | 30 | 60.62 | 62.04 |
| R20 | −1 | 1 | 1 | 1 | 800 | 40 | 50.34 | 49.05 |
Table 3 shows the parameters in determining the quantum yield model. The model selection for the quantum yield response was determined based on three tests: sequential model sum of squares, lack of fit test, and model summary statistics. The quadratic model shows a sequential p-value of less than 0.0001, which means the probability of model error is much lower than 5%, so that the quadratic model is considered the most significant model on the quantum yield response. In the quadratic model, the lack of fit p-value is 0.4771, which means it has exceeded the alpha level (0.05). It shows that the model is appropriate and does not have an inaccuracy in describing the data. The quadratic model has an R-squared value close to 1, which is 0.9767, which means that the factor's influence on the quantum yield response is 97.67%, and other factors influence the remaining 2.33% of the response. The Adjusted R-squared value of the quadratic model is 0.9557, which means it shows a high model fit value because it is close to the value 1. Based on these data, the quadratic model was selected as the adequate model with the status of 'suggested'.
The significance value of each factor and the interaction between factors can be observed based on the p-value, as shown by the ANOVA analysis in table 4. The significance value of each factor and the interaction between factors can be observed based on the p-value. If the absolute probability p-value shows a coefficient lower than 0.05, it means that the results obtained have a confidence level of at least 95%, so that the related variables are confirmed to have a significant effect on the response. The three main effects (X1, X2, X3), the binary interaction X2X3, and the second-order effect (X1 2, X2 2, X3 2) are the greatest influence in the final model. In other binary interactions, both X1X2 and X1X3 did not significantly affect the response, so they were not included in the final model. The final polynomial equation in the form of the QY response code variable with urea mass factor (X1), microwave power (X2), and synthesis time (X3) is QY = +58,36 + 10,41X1 + 14,06X2 + 13,59X3–5,57X2X3–4,89X1 2 −8,60X2 2–5,40X3 2. This equation shows that the three factors have almost the same effect on increasing the QY response. The polynomial equation in the form of the actual variable is QY = −228,37972 + 23,64008X1 + 0,41777X2 +5,72480X3−4,88950X1 2. The actual equation is needed to determine the value of the QY response obtained if different urea mass, microwave power, and synthesis time are used. These equations show that the actual variable that has the most influence on the QY response is the mass of urea.
The effect of reactor power, urea mass, and duration on QY Cdots are represented in figure 4. The contour graph of the plot shows the response values visualized in blue, green, yellow, and red indicate a different QY response value. A shift in the contour towards blue indicates that QY is getting lower, while red indicates a higher QY. The response surface graph of the interaction relationship between microwave power factor and synthesis time on the QY response is shown in figures 4(a),(d). The best range to produce the highest QY is 600–800 W for 30–40 min of synthesis duration. A further increase or decrease in these two parameters harms QY. The lowest QY was synthesized when the power and duration of synthesis were at their lowest. It happens because the power and synthesis time is too short, so Cdots only undergo polymerization reactions and are not fully carbonized [28]. Physically, when a microwave emits a high-frequency wave, the microwave energy field repeatedly changes hundreds of millions of times per second. As a result, molecular motion changes from its original irregular orbital motion into regular high-frequency vibrations, then produces collisions, friction, and extrusion so that the kinetic energy of the microwave is converted into heat energy [29]. This heat energy is used for dehydration, polymerization, and carbonation processes. In contrast, the combination of high temperature and prolonged duration was found to hurt QY Cdots. This adverse effect may occur due to unwanted reactions at high reaction temperatures and times. When carbonization is too high, Cdots tend to aggregate and decrease fluorescence intensity [30, 31].
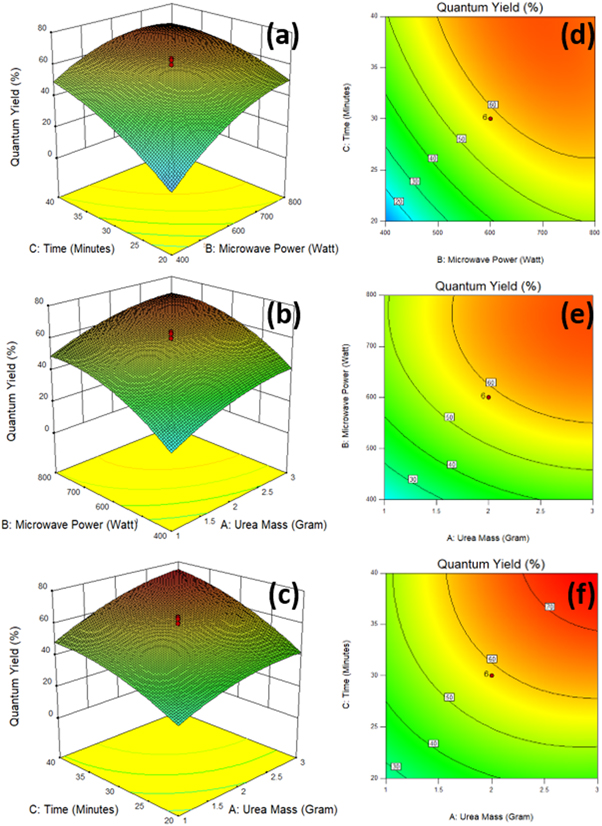
Figure 4. Graph 3D of interaction surface response (a) duration-microwave power (b) urea mass-microwave power (c) duration-urea mass; 2D contour plot (d) duration-microwave power (e) urea mass-microwave power (f) duration-urea mass.
Download figure:
Standard image High-resolution imageFigures 4(b), (e) shows the interaction of reactor power and urea mass on QY Cdots at a synthesis duration of 30 min. The best condition to produce the highest QY is the power range of 600–800 W with a mass of urea of 2–3 grams. This result is consistent with Lewa et al (2019) report that adding a urea passivation agent into citric acid up to 3 grams will increase the luminescence of Cdots, while the addition of more than 3 grams will decrease the luminescence [11]. A further increase or decrease in this parameter hurts QY. The possible reason is that when the urea mass increases, the number of nitrogen atoms that penetrate the sp2 crystals of the Cdots core increases, resulting in disruption of the hexagonal ring structure of Cdots and creating more 'emissive traps' [28, 32]. Photoluminescence events can arise due to the presence of emissive surface energy traps by functional groups on the surface of Cdots [33]. The addition of urea (CO(NH2)2) to citric acid will enrich the carbon, oxygen, and nitrogen content, thereby increasing the formation of functional groups on the surface of the carbon dots, such as C=O, C=C, and C–N bonds.
Figures 4(c), (f) shows the effect of synthesis time and urea mass on QY at 600 W. The best range to produce the highest QY is in the 2–3 gram urea mass range with a synthesis duration of 30–40 min. The duration of the synthesis is related to the resonance process, power distribution, and energy transport. A long duration (up to a specific range) can increase surface oxidation and form more surface defects [34]. Finally, the lowest QY (1.53%) was produced by combining a mass factor of 1 gram of urea, 400 watts of microwave power, and a synthesis time of 20 min. The highest QY response (74.39%) was produced by a combination of 3 grams of urea mass factor, 800 watts of microwave power, and a synthesis time of 40 min. Based on these results, it can be concluded that there is no dominant parameter. The three synthesis parameters have a significant effect and play an essential role in the synergistic production of QY Cdots.
3.3. Carbon dots characteristics
Figure 5 (a) shows a graph of the fluorescence and absorbance spectrum of Cdots. The absorbance spectrum showed two absorption peaks: the UV region at 340 nm and the visible light region at 405 nm. The first spectrum peak represents the electronic transition π−π* while the second spectrum peak represents the electronic transition n−π* [26, 35]. Cdots exhibit fluorescence at a wavelength of 544 nm which is the result of laser excitation. It can be observed that the Cdots fluorescence wavelength is larger than the excitation wavelength. It is consistent with the visual appearance in the previous image, where the glow produced by Cdots is bright green, while the excitation uses a purple laser light beam.
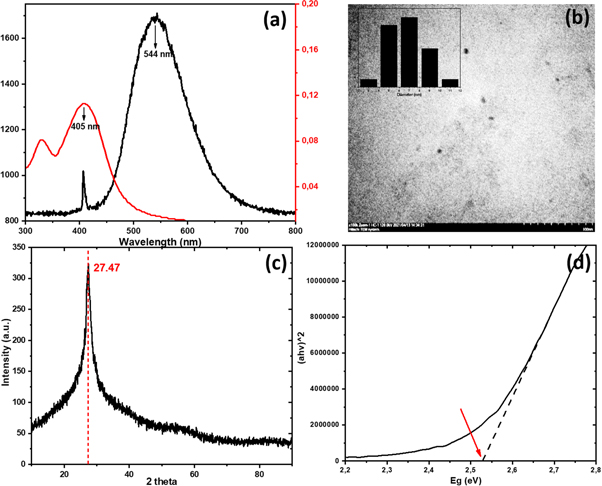
Figure 5. Characteristics (a) grain appearance of Cdots (b) size distribution of Cdots (c) XRD pattern (d) energy band gap.
Download figure:
Standard image High-resolution imageThe appearance of the Cdots grains based on the Transmission Electron Microscopy test is shown in figure 5(b). The Cdots particles appear to be spherical/round and rough surfaces with an average diameter of 6.6 nm (distribution range of 3–11 nm). This result is smaller than the previous study using a similar carbon source, passivation agent, and method [36, 37]. The XRD pattern of Cdots (figure 5(c)) displays a broad peak centered at about 2θ = 27.47° with an FWHM of 1.79. Cdots show the lattice spacing d = 3.24 A. It shows that Cdots have very close properties to graphite with highly irregular carbon atoms structure [32]. The Cdots energy band gap has been calculated using the tauc-plot technique with a value of 2.53 eV. These results are consistent with previous studies that the bandgap of Cdots energy is in the range of 1.5–3.5 eV [34, 38]. The energy band gap is the energy required to remove an electron from the valence band to the excitation band. The smaller the Cdots particle size, the more significant the energy bandgap. The energy shift effect caused by this size change is known as the quantum effect [26, 39]. Cdots with a larger diameter (∼10 nm) will usually emit a larger wavelength, with colors such as orange or red. Cdots with a smaller size (∼2 nm) emit shorter wavelengths, with colors such as violet or blue.
Figure 6 shows a graph of the FTIR spectrum. Based on the spectrum analysis, the Cdots samples contained O-H bonds at = 3301 cm−1 and 3180 cm−1, representing many hydroxyl groups circulating on the Cdots surface [40–42]. On the surface of Cdots there are C–H bonds (v = 3089 cm−1, 1413 cm−1, 760 cm−1) and C=O bonds (ν = 1696.76 cm−1) which identify the presence of a carboxyl group [43, 44]. The CO functional group on the surface of Cdots was found at the absorption of 1057.32 cm−1, the CN functional group was identified at = 1183 cm−1, the C=C functional group was identified at = 1576 cm−1 [45]. The presence of various functional groups that FTIR on the surface of Cdots has identified have various energy levels, causing various emission traps. The presence of nitrogen on the surface of Cdots will add new energy levels that function as emissive traps. The new energy level has a smaller gap between HOMO (Highest Occupied Molecular Orbital) and LUMO (Lowest Unoccupied Molecular Orbital). When Cdots are excited with the same energy, more electrons are excited and have higher emission intensity [46].
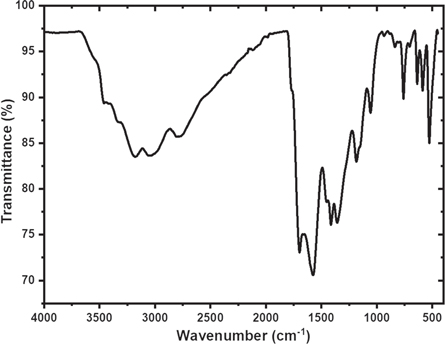
Figure 6. FTIR spectrum.
Download figure:
Standard image High-resolution imageThe richness of functional groups on the surface of Cdots affects the fluorescence effect produced. If the number and types of functional groups on the surface of the Cdots are different, the emission wavelength and absorbance of the Cdots will also be different. The presence of functional groups O–H and N–H on the surface of Cdots will increase the hydrophilic ability and stability of Cdots in water [31]. The presence of C–O bonds indicates that Cdots have much oxygen content and strengthens that Cdots have an excellent level of solubility in water [47, 48]. These results confirm that the synthesized Cdots have good stability and solubility and are easy to apply as an analyte detector in laboratory-scale water systems and natural aqueous environments.
3.4. Heavy metal detection
Two main parameters will be studied in the Cdots application as a heavy metal detector, namely selectivity and sensitivity. Selectivity indicates the ability of Cdots to detect an analyte selectively. A particular heavy metal ion can be easily detected by Cdots while not by other types of heavy metal ions. The more specific an analyte can be detected by Cdots, the higher the selectivity level. Cdots that have specific sensitivity will be more accessible when applied in various fields of appropriate objectives [49]. Various heavy metal ions such as Zn2+, Zr4+, Al3+, Fe3+, Ag+, Pb2+, Ni2+, Bi3+, Hg2+ and Co2+ with a concentration of 10 μM were prepared for the selectivity test of Cdots. Figure 7 shows that the addition of heavy metal ions to the Cdots solution gave different responses. The addition of Ag+, Bi3+, and Ni2+ ions to the Cdots solution scrimpy decreased the fluorescence intensity. The addition of Al3+, Co2+, Pb2+, Zn2+, Zr4+ and Hg2+ ions to the Cdots solution did not significantly impact Cdots fluorescence changes. It means that the Cdots material is not sensitive to the presence of Ag+, Bi3+, Ni2+, Al3+, Co2+, Pb2+, Zn2+, Zr4+, and Hg2+ ions. On the other hand, the addition of Fe3+ ions showed a significant effect on changes in fluorescence intensity (Fo/F) compared to the addition of other heavy metal ions. The presence of Fe3+ ions in the solution significantly extinguished Cdots fluorescence. It implies that the synthesized Cdots material has a high sensitivity to Fe3+ ions.
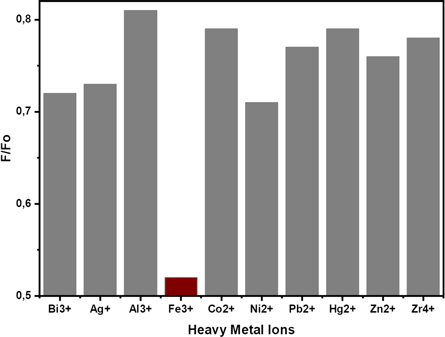
Figure 7. Fluorescence changes based on the addition of various heavy metal ions to the Cdots solution.
Download figure:
Standard image High-resolution imageThe fluorescence quenching may occur due to the collision between Cdots and Fe3+ ions. The collision occurs when the Cdots particles' electrons relax from the excited state to the ground state, resulting in energy transfer or charge transfer with Fe3+ ions. The addition of Fe3+ ion concentration in Cdots solution causes the quantity/amount of nonfluorescent-complex to increase while fluorescent-complex molecules decrease. As a result, the initially high fluorescence intensity turned off. According to Iqbal et al (2016) Cdots from nitrogen-doped citric acid carbonation are covered with –OH, –NH2, and –COOH functional groups, where these functional groups only have sensitivity to Fe3+ ions [50], so the affinity is non-fluorescent-complex. The Fe3+ ion formed is much higher than the nonfluorescent-complex affinity formed by other metal ions. These results confirmed that the synthesized Cdots had specific selectivity for Fe3+ ions. The fluorescence quenching mechanism can also be approximated based on the decay time or the length of time Cdots are excited. If the decay time of Cdots before and after the addition of Fe3+ ions changes, it can be concluded that the fluorescence quenching process leads to dynamic quenching in which the relaxation of Cdots towards the ground state is disturbed collisions with Fe3+ ions accompanied by charge exchange. On the other hand, if there is no difference in decay time, the fluorescence quenching process leads to static quenching, where the blackout is only caused by the formation of a nonfluorescent complex in the ground state Cdots [51].
The sensitivity level indicates the sensing capability or detection limit that can be achieved from the proposed technique. In this work, the concentration of Fe3+ was prepared in a dissolved state in distilled water without any disturbance of physical properties (taste, odor, and color) or other mineral content. Based on visual observations, the fluorescence of Cdots, which has initially been bright green, got dimmer as the concentration of Fe3+ ions increased. Qualitatively and quantitatively, the emission intensity of Cdots was observed to decrease in real-time along with Fe3+ concentration increased from 0 to 10 μM, as shown in figure 8. These results indicate that Cdots are very sensitive to increasing Fe3+ ion concentration.
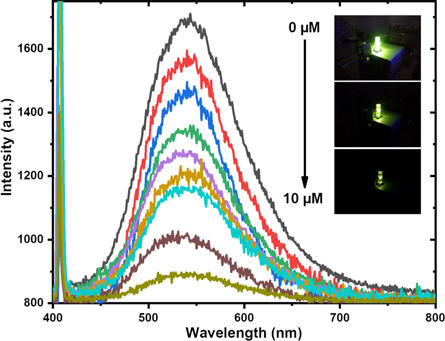
Figure 8. Spectrum of decreasing Cdots fluorescence intensity due to the addition of Fe3+.
Download figure:
Standard image High-resolution imageTable 3. Quantum yield response summary analysis.
| Source | Sequential p-value | Lack of Fit p-value | Adjusted R-Squared | Predicted R-Squared | Note |
|---|---|---|---|---|---|
| Linear | < 0.0001 | 0.0125 | 0.7196 | 0.6588 | |
| 2Fl | 0.5354 | 0.0095 | 0.7065 | 0.6262 | |
| Quadratic | < 0.0001 | 0.4771 | 0.9557 | 0.8932 | Suggested |
| Cubic | 0.8967 | 0.1093 | 0.9369 | −0.9080 | Aliased |
Table 4. ANOVA Analysis.
| Source | Sum of squares | Df | Mean square | F Value | p-value Prob > F | Note |
|---|---|---|---|---|---|---|
| Model | 8573.42 | 9 | 952.60 | 46.58 | < 0.0001 | Significant |
| X1-Massa urea | 1480.56 | 1 | 1480.56 | 72.40 | < 0.0001 | Significant |
| X2-Daya Microwave | 2700.76 | 1 | 2700.76 | 132.06 | < 0.0001 | Significant |
| X3-Waktu Sintesis | 2523.91 | 1 | 2523.91 | 123.42 | < 0.0001 | Significant |
| X1X2 | 2.93 | 1 | 2.93 | 0.14 | 0.7130 | |
| X1 X3 | 58.97 | 1 | 58.97 | 2.88 | 0.1203 | |
| X2 X3 | 247.98 | 1 | 247.98 | 12.13 | 0.0059 | Significant |
| X1 2 | 344.53 | 1 | 344.53 | 16.85 | 0.0021 | Significant |
| X2 2 | 1064.99 | 1 | 1064.99 | 52.08 | < 0.0001 | Significant |
| X3 2 | 419.74 | 1 | 419.74 | 20.52 | 0.0011 | Significant |
| Residual | 204.50 | 10 | 20.45 | |||
| Lack of Fit | 105.02 | 5 | 21.00 | 1.06 | 0.4771 | Not significant |
| Pure Error | 99.49 | 5 | 19.90 | |||
| Cor Total | 8777.92 | 19 |
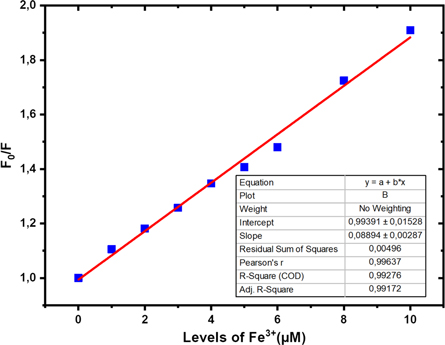
The relationship between increasing the concentration of Fe3+ ions and decreasing the fluorescence of Cdots is shown in figure 9. The graph confirms a linearity between the concentration of F0/F and the concentration of Fe3+ with a coefficient of determination R2 = 0.99276. The linear correlation on the graph forms an equation: F0/F = 0.08894 [Fe3+] + 0.99391. Based on this equation, the graph slope value is 0.08894 μM−1, the standard error is 0.00287, and the standard deviation = 0.00861. From this quantity, the limit of detection ability (limit of detection) of Cdots for Fe3+ ions was obtained at 0.29 μM or equivalent to 0.016 ppm. The detection limit of Fe3+ by Cdots in this study (sample R9) showed a better ability when compared to the results of sensing investigations in previous research reports, as shown in table 5. The lower LoD of a detector, the higher its ability to analyze or determine the concentration of the content-heavy metal more precisely. Most of the previous research LoDs were above the heavy metal threshold in drinking water, and a small portion of the previous research LoDs had met the heavy metal threshold in drinking water, as shown in table 6. These results indicate that the synthesized Cdots can compete as candidates as detectors. iron ions in drinking water.
Figure 9. Linearity graph between Cdots fluorescence intensity and Fe3+ levels.
Download figure:
Standard image High-resolution image
Table 5. Comparison of Cdots sensitivity to Fe3+ in water.
| LoD | ||||
|---|---|---|---|---|
| Detector | Linier range (μM) | μM | ppm | References |
| Cdots | 25–200 | 4 | 0.23 | [52] |
| Cdots | 12.5–100 | 9.97 | 0.56 | [53] |
| Cdots | 10–200 | 1.8 | 0.1 | [54] |
| Cdots | 16–166 | 6.05 | 0.34 | [55] |
| Cdots | 0–300 | 19 | 1.06 | [56] |
| Cdots | 0–2 | 70 | 3.92 | [57] |
| Cdots | 2–25 | 0.9 | 0.05 | [58] |
| Cdots | — | 9.8 | 0.55 | [59] |
| Cdots | 0–22.4 | 35.7 | 2 | [59] |
| Cdots | 0–60 | 6.2 | 0.35 | [60] |
| Cdots | 3.32–32.26 | 0.7462 | 0.043 | [2] |
| Cdots | 0–350 | 5.34 | 0.3 | [61] |
| Cdots | 0–100 | 0.398 | 0.022 | [62] |
| Cdots | 0–100 | 0.3 | 0.017 | [3] |
| Cdots | 0–60 | 6.16 | 0.35 | [63] |
| Cdots | 0–500 | 5.23 | 0.29 | [64] |
| Cdots | 0–10 | 0.29 | 0.016 | this work |
Table 6. Regulation of Fe3+ Ion levels in drinking water.
| Drinking-water regulation | Maximum Fe3+ level |
|---|---|
| Permenkes RI No. 492, 2010 | 0–0.3 ppm |
| Mineral Water SNI 3553, 2015 | 0–0.1 ppm |
| Demineral Water SNI 6241, 2015 | Unregulated |
| IBWA, 2015 | 0–0.3 ppm |
| WHO, 2011 | Unregulated |
The sensitivity of Cdots to the presence of heavy metals in drinking water is shown by the relationship between fluorescence intensity, QY, and Fe3+ ion levels. The fluorescence intensity of Cdots is directly proportional to the QY value and inversely proportional to the heavy metal content in the water. The higher the fluorescence intensity of Cdots, the lower the concentration of heavy metal ions in the water. On the other hand, the lower the fluorescence intensity of Cdots, the higher the concentration of heavy metal ions in the water. The linearity equation of the relationship between the two parameters can also be converted into a nomogram so that it will be easier for the operator to read the detection value of Fe3+ ion levels in drinking water in the quality control room.
3.5. Implementation of Fe3+ detection in drinking water
According to WHO guidelines (2011), the quality of drinking water is a determinant of health for the environment because water is vital for life and is capable of transmitting disease in a country and even across continents. One of the parameters regulated in various drinking water regulations is the content of Fe3+ ions. Although it plays a role in various biochemical processes [3, 62, 65], the intake of Fe3+ into the body needs to be limited. According to the Regulation of the Minister of Health of the Republic of Indonesia Number 28 of 2019, the daily ion requirement for men is 8-11 mg, while for women, it is 8–18 mg. The need for Fe3+ ions has generally been met through the food consumed to supply about 10–20 mg Fe/day [66]. Excessive amounts of Fe3+ in the body can induce reactive hydroxyl radicals, which will cause severe damage to membranes and DNA [58]. Furthermore, the imbalance of Fe3+ content in the body can cause diseases such as Alzheimer's, Parkinson's, decreased intelligence, hemochromatosis, diabetes, and cancer [2].
Monitoring the concentration of Fe3+ in drinking water is fundamental for drinking water providers. At concentrations above 0.3 ppm, iron ions will affect the taste of drinking water and turbidity, it also can stain water supply pipe equipment [67]. In this study, the synthesized Cdots showed excellent ability with sensitivity to detect the presence of Fe3+ ions up to 0.016 ppm. The detection limit of Cdots is much lower than the maximum threshold allowed by the Minister of Health of the Republic of Indonesia No.492 of 2010 and the International Bottled Water Association (IBWA) of 2015, which is at a concentration of 5.4 μM or equivalent to 0.3 ppm. The detection limit of Cdots is also lower than the maximum threshold based on the 2015 Indonesian National Standard (SNI) 3553, which is at a concentration of 0.1 ppm. The synthesized Cdots were implemented in drinking water taken directly from PDAM Tirto Moedal-Semarang City, to ensure that advantage. Sampling was carried out at three different times, for three months. PDAM Tirto Moedal Semarang water products from May to July 2021 contain Fe3+ ions of 0.00145-0.00179 ppm, as shown in table 7. PDAM Tirto Moedal Semarang water products from May to July 2021 contain Fe3+ ions of 0.00145–0.00179 ppm. By regulation, PDAM Tirto Moedal Semarang city has met the quality standards as drinking water according to Regulation of the Ministry of Health of the Republic of Indonesia Number 492 of 2010, IBWA regulations 2015, WHO guidelines 2011, mineral drinking water standards based on SNI 3553 of 2015, and standards as demineralized drinking water based on SNI 6241 of 2015.
The results of testing the Fe content of PDAM Tirto Moedal water using Cdots in this study are similar to the results of Rohmawati and Kustomo's (2020) study based on atomic absorption spectroscopy (AAS), which reported that the Fe concentration of PDAM Tirto Moedal water ranged from 0–0.04 ppm [68]. In this study, Fe3+ content was also tested using the Prodigyplus ICP-EOS instrument. The test results show ND (Not Detected), which means Fe3+ ions in PDAM water cannot be detected. It is probably due to the Fe3+ ion concentration in PDAM water below the instrument detection limit (5 ppb). Based on these results, there is a match between the test results using the Cdots, AAS, and ICP-EOS fluorescence techniques. Confirmation of the suitability of these results can ensure that the fluorescence technique using Cdots has met the standard of accuracy and is feasible in the implementation of detection of Fe3+ ion content in drinking water.
Table 7. PDAM water heavy metal content testing.
| Fe3+ levels | |||
|---|---|---|---|
| Samples | F0/F | μM | Ppm |
| May 2021 | 1.024 | 0.026 | 0.00145 |
| June 2021 | 1.029 | 0.032 | 0.00179 |
| July 2021 | 1.025 | 0.028 | 0.00156 |
3.6. Recommendations and potential impacts
Based on the results described previously, in general, fluorescence techniques using Cdots materials offer a detection process that is relatively faster, easier, more accurate, and can be synthesized at a low cost. In a technical implementation, the results of this study are recommended to be used as a 'quality control' instrument for heavy metal levels at PDAM outlets and refill drinking water depots at the final stage before being distributed to consumers/customers. There are two main advantages if Cdots are implemented in final products by drinking water providers. From the producer's point of view (drinking water providers), the use of Cdots detectors can guarantee that the quality or quality of the final drinking water product produced has complied with regulations, both SNI standards, and the Indonesian Minister Health Regulation. This quality assurance will indirectly have a positive impact on service delivery and public trust. On the other hand, consumers will get safe, hygienic, and healthy drinking water products.
4. Conclusion
An adequate response model in the synthesis of Cdots is quadratic with the formulation QY = +58,36 + 10,41X1 + 14,06X2 + 13,59X3–5,57X2X3–4,89X1 2 −8,60X2 2–5,40X3 2. The optimal conditions for the synthesis of Cdots are in the range of adding 2-3 grams of urea mass using a reactor power of 600–800 W for 30–40 min. The maximum QY Cdots response was produced by a 3 gram urea mass factor, 800 Watt microwave power, and 74.39% synthesis time of 40 min. Cdots are water-soluble and visually produce a bright green (544 nm) fluorescence. Cdots have the characteristics of spherical particles, measuring 6.6 nm, having an energy band gap of 2.53 eV, having an irregular (amorphous) carbon atom structure and containing various functional groups such as OH, CH, C=O, CN, and C=C. Cdots have a specific sensitivity to Fe3+ ions compared to other ions Ag+, Bi3+, Ni2+, Al3+, Co2+, Pb2+, Zn2+, Zr4+ dan Hg2+). The relationship between fluorescence intensity and Fe3+ ion concentration forms a linearity with the equation F0/F = 0.08894 [Fe3+] + 0.99391 (R2 = 0.99276). The limit of detection capability of Cdots for Fe3+ ions is 0.29 M or equivalent to 0.016 ppm, which is below the threshold of the Indonesian Minister of Health, SNI, WHO, and IBWA guidelines. Based on the conformity of the SSA and ICP-EOS tests results, the fluorescence technique using Cdots material has met the standards of accuracy and feasibility in implementing Fe3+ ion detection. The Cdots fluorescence technique can be applied as a 'quality control' instrument for heavy metal levels in the final drinking water product at PDAM outlets and drinking water depots.
Acknowledgments
This research was funded by the Research and Community Service Division (LPPM) of Diponegoro University for Pendidikan Magister Menuju Doktoral untuk Sarjana Unggul (PMDSU) scheme with contract number 14-04/UN7.P4.3/PP/2020.
Data availability statement
All data that support the findings of this study are included within the article (and any supplementary files).