

Abstract
Erosion resistance of the redmud filled and unfilled sisal fiber reinforced hybrid composites were tested by solid particle erosion test as per ASTM standard G76. Erosion parameters such as erodent velocity, impact angle and erodent discharge rate were considered for conducting experiments and erosion rate was analysed. Taguchi analysis of erosion test result shows that erodent velocity, red mud particle proportion and erodent discharge was prominent in deciding the erosion loss in the composites. When compared to unfilled composites addition of redmud on the polyester composite showed better resistance against erosion wear. Redmud addition changes the ductile nature of the composite so maximum erosion rate was noted at lower impact angle. When increasing the erodent velocity, the erosion rate of the composite was increased. Scanning Electron Microscope (SEM) analysis evident the formation of plastic deformation and fiber damage on the eroded surface.
Export citation and abstract BibTeX RIS
1. Introduction
Redmud is the solid waste produced during the production of alumina through the Bayer process. Increasing demand for aluminum all over the world increases its production rate every year which consequently raises the redmud waste generation. These wastes having no proper disposal methods and are dumped into the environment where it affects the surrounding severely [1]. Finding potential utilization of redmud waste is the useful and productive way for reducing the environmental pollution [2]. Since redmud is the by-product from the raw material bauxite used in alumina production industries it is composed of several minerals. These minerals contribution in redmud varies in proportions which depend upon the geographical area [3]. Many researchers reported that addition of redmud waste in polymer composite has resulted in increased mechanical strength [4–6]. Prabu et al [7–9] work on redmud filled polymer composites witnessed the improvement in mechanical performance. Rachchh [10] found the increase in hardness on redmud addition in the coir fiber reinforced epoxy composite. The hardness improvement is because of the heavy metal oxides present in the redmud. In addition, increase in hardness makes the composite suitable for erosion application.
Erosion investigation is more crucial in various applications since it costs high. Erosive wear occurs when a solid particle impacts the material surface continuously [11]. Damage in aircraft turbine blades due to the impact of air and dust particle mixture, gas pipes damage due to the effect of particles with gas or water medium were typical examples of erosion wear damage. Several researchers also addressed that the addition of filler particles in the polymer composites will enhance the tribological characteristics [12–16]. Hybridization in polymer composites increases the mechanical and wear properties of the composite [17]. Although there is number of research in polymer composites dry sliding wear performance only a limited number of studies investigated the solid particle erosion wear of polymer composites. In recent years, research work highlighting the importance of erosion mechanism in polymer composites was increasing. Erosion performance of polymer composites was reviewed by Vigneshwaran et al [18] and stated that investigation reporting the combined effect of fiber and particle in erosion resistance of polymer composites were rare. Johnson et al [19] investigated the solid particle erosion behavior of sansevieria cylindrica reinforced vinylester composite and reported that erodent velocity in the most dominant erosion parameter in affecting the erosion wear. Rout et al [20] carried out erosion studies on glass fiber reinforced epoxy composites filled with rice husk and the result evident the influence of particle in affecting the erosion resistance of the composites. Bagci et al [21] performed erosion test on borax filled hybrid composites and observed minimum erosion wear on 30% borax filled composites. Patnaik et al [22] reported that erosion loss on glass fiber reinforced polyester was severe when compared to the alumina filled glass fiber/polyester hybrid composite.
In considering these result the present work is planned to investigate the tribological erosion behaviour of the sisal fiber reinforced and an industrial waste Red mud filled polyester composite (RMSC). However, all the past work categorized the erosion effect of filled polymer composites with various natural fibers reinforcement and no work has been experimented in studying the erosion effect of the red mud filled sisal fiber reinforced polymer matrix and hence the work is proposed. Composites were fabricated using compression molding technique and erosion test was conducted as per ASTM standard G76. ANOVA and Taguchi analysis was done on the experiment results to study the parameter influence. Finally, the eroded surfaces were investigated for failure analysis using scanning electron microscopy.
2. Materials and methods
2.1. The raw materials
Red mud was collected from the National Aluminium Company Ltd, Damanjodi, India. Sisal fiber in form of randomly oriented mat was purchased from Tokyo Corporation, Coimbatore, India. Unsaturated polyester resin was obtained from Vasavibala resins private limited, Chennai, India.
2.2. Composite fabrication
Redmud filled Sisal fiber mat reinforced composite was fabricated using the compression molding process. The randomly arranged sisal fiber mat with varying fiber percentage of 20%, 30%, and 40% was used for fabrication. The fiber mat was placed over the mild steel mold having size 300 × 135 × 3 mm. Collected Redmud was sieved to the average size of .5 μm to 1.5 μm and added to the matrix unsaturated polyester resin. Red mud was mixed at three different weight percentage of 10%, 20%, 30%. To ensure the uniform distribution of red mud throughout the matrix, the mixture was stirred thoroughly for about 30 min. After the proper mixing process catalyst methyl ethyl ketone peroxide (MEKP) and accelerator cobalt naphthenate were added to the mixture each at 1% as recommended by the supplier. Once again the mixture was stirred to attain a homogenic condition. The resin mixture is then poured over the reinforcement placed on the mold cavity and rolled by a roller to avoid air traps. Finally, the mold was closed with the matching die and compressed at 150 kg cm−2 pressure and left to cure for 4 h at room temperature. Both the mold and matching die was applied with the releasing agent for easy removal of the fabricated composite plate. Through the similar process, unfilled sisal fiber reinforced polyester composite was fabricated to know the performance improvement. The fabricated composite plates were shown in figure 1.

Figure 1. (a) Typical specimen, (b) Micro structure of the 10% RM filled composite.
Download figure:
Standard image High-resolution image2.3. Tensile and hardness test
Tensile and hardness strength of the composites was measured as per the ASTM standards (ASTM D-3039 and ASTM D-2240 respectively). The tensile tested composites were analysed with SEM to understand the fracture morphology.
2.4. Erosion experiment
As per ASTM G76-13 solid particle erosion test was conducted using Air jet erosion tester (TR 470 of DUCOM, India). The Air jet erosion tester comprises of air compressor, feeder unit, mixing chamber, control unit, Erosion unit, and dust collector. Alumina irregular in shape of average size 50 micron is used as the erodent which is stored in the hopper and passed to the mixing chamber by the conveyor belt unit. Figure 2 shows the morphology of Erodent particles used. In the mixing chamber, erodent get mixed with the dry compressed high-speed air. After mixing the air and erodent mixture was passed through the tungsten carbide nozzle having 1.5 mm diameter, 50 mm length in the erosion unit and strikes the specimen at high velocity. For air jet erosion experiment sample was cut to the size of 25 × 25 × 5 mm. Experimental run was carried out at constant erosion time 10 min and standoff distance 10 mm. Before and after the erosion run each specimen was cleaned and weighted using the precision balance having the accuracy of ±0.1 mg. Each experiment was repeated three times and the average value of weight loss was taken and using the weight loss erosion rate for each sample was calculated. The erosion rate is the rate of material removed from the composite by the impact of erodent discharged per unit time, which can be calculated using equation (1) [23],

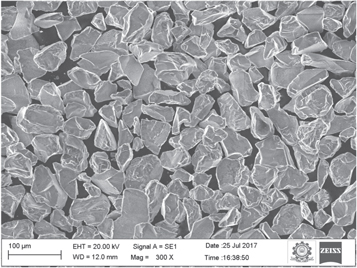
Figure 2. Image of erodent particle.
Download figure:
Standard image High-resolution imageThe impact angle was varied by varying the sample holder. Erodent velocity was found by using double disc method by varying air pressure. In regard to the mechanical properties and for comparison purpose samples with 0%, 10% and 20% redmud filled composites were used for erosion test.
2.5. Taguchi experimental design
Statistical tools are found to have a crucial place in analysing the product or process variables where numbers of factors are involved. Erosion is a typical mechanism in which involves collective response of various control factors affecting the output response i.e., erosion rate. To analyse the parameter influence existing literatures reveals the use of various statistical tools such as Artificial Neural Network (ANN), Taguchi analysis, Response surface methodology, and similar others. For the present experimentation work Taguchi Experimental Design was selected to design and analyse the significance of the control variables on output response. Standard Taguchi L27 (313) orthogonal array was selected for conducting the experiment. Filler percentage (A), Fiber concentration (B), Impingement angle (C), Erodent velocity (D) and erodent discharge rate (E) were the selected control variables and their corresponding level is shown in table 1. The number of experimental runs gets reduced while using Taguchi factorial experimental design [24]. Thus for the present experiment total sum of 35 = 243 runs was reduced to 27 runs which is more beneficial in experimental work.
Table 1. Control factors and level for Taguchi L27 design.
| Level | ||||
|---|---|---|---|---|
| Symbol | Process variables | I | II | III |
| A | Filler (%) | 0 | 10 | 20 |
| B | Fiber concentration (%) | 20 | 30 | 40 |
| C | Impingement angle (°) | 30 | 60 | 90 |
| D | Impact Velocity(m s−1) | 41 | 72 | 100 |
| E | Erodent feed rate (g min−1) | 2.5 | 3.3 | 4.0 |
The mean response of the experimental data was evaluated by transforming the output data (erosion rate) to signal to noise ratio (S/N). The S/N ratio of the erosion rate was found at 'smaller is better' condition, since the rate of erosion should be minimum. The S/N ratio for 'smaller is better' condition is expressed in logarithmic transformation of loss function, as equation (2) [25],

In the equation (2), n is the numbers observations and y denotes the observed data. By using the equation optimum state for the erosion rate was estimated with the erosion control factors where the S/N ratio was set to be Maximum. At the end ANOVA test was conducted to find the percentage of contribution of each parameters on the erosion rate.
3. Result and discussion
3.1. Hardness
The hardness result of the fabricated composites was shown in the figure 3. From figure 3 it is clear that the addition of redmud to the polymer matrix increases the hardness, at the same time increase in the fiber weight percentage reduced the hardness of the composites. Addition of 10% redmud improved the hardness strength than the 20% redmud and unfilled composite irrespective of fiber percentage. Higher hardness was noted on 20% fiber reinforced composites when compared to 30% and 40% fiber reinforcement. Composite with 20% fiber and 20% redmud showed maximum hardness strength. This is mainly due to the influence of redmud particle on surface property of the composites. Presence of heavy mineral oxides in the red mud improved the hardness. But at higher fiber reinforcement the bonding property between the fiber, matrix and redmud is poor which reduces the hardness.
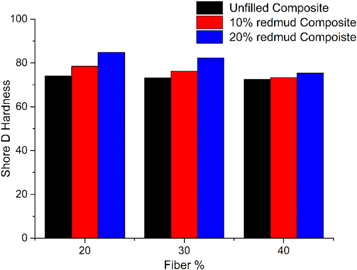
Figure 3. Hardness.
Download figure:
Standard image High-resolution image3.2. Tensile strength
Figure 4 shows the tensile test results of the fabricated redmud sisal composites. From the figure it is well understood that the tensile strength of the composite increases both on increase in fiber as well as redmud reinforcement. 40% fiber reinforced composites exhibit superior tensile strength in redmud filled and unfilled composites. This is because at this condition the matrix distributes the developed stress within the fibers having higher stiffness and strength. Under tensile load, the fiber reinforcement carried the load stress which is more effective in withstanding the matrix breakage. This is also because of the effective interlocking between the fiber and matrix. Composite with 20% red mud and 40% fiber showed better tensile strength than other composites.
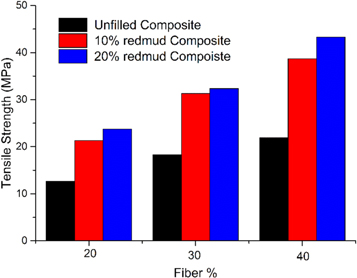
Figure 4. Tensile strength.
Download figure:
Standard image High-resolution imageTo identify the damage mechanisms of failed specimens after the tensile test, the SEM images were taken on the fractured cross- sectional surfaces of the composite. Figure 5 shows the fracture morphology of the failed samples. Figure 5(a) shows the good bonding between the matrix and fiber. This good interlocking helps the fiber against pull out and damage under load. The broken fibers were also marked on figure 5(a), which implies the fracture under tensile load. Void and cavities were found on the composites may due to the fiber pullout from the matrix surface, which is clearly shown in figure 5(b). Development of fiber pullout is mainly due to the weak interface between the matrix and the fiber reinforcement. In the matrix surface micro cracks were also noticed. Development of micro cracks on the matrix surface is due to the poor withstanding ability of matrix under load. Notably micro cracks were noted only near the fiber less region. This evident that good interlocking between the fiber and matrix is reason for good tensile strength.
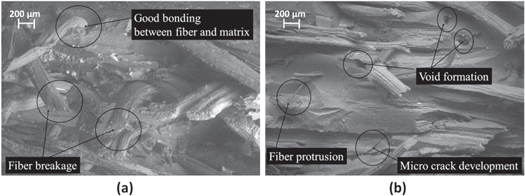
Figure 5. Morphology of tensile tested specimen.
Download figure:
Standard image High-resolution image3.3. Taguchi analysis on erosion experimentation
As per ASTM G76 solid particle erosion test was conducted using the standard orthogonal array L27 on Redmud filled polyester composites and the results are shown in table 2. Erosion rate was calculated using the weight loss measured at each experimental runs and the corresponding S/N ratio was also calculated and tabulated in last two columns of the table. Using MINITAB 19 software tool the experiment results was analysed.
Table 2. Control factors level for Taguchi L27 design.
| S.No | Red mud (%) | Fiber (%) | Impact angle (°) | Erodent velocity (m s−1) | Discharge (g min−1) | Erosion rate *10−4 (g g−1) | SN ratio |
|---|---|---|---|---|---|---|---|
| 1 | 0 | 20 | 30 | 28 | 2.5 | 1.84 | −5.2964 |
| 2 | 0 | 20 | 30 | 28 | 3.3 | 1.73 | −4.7472 |
| 3 | 0 | 20 | 30 | 28 | 4 | 1.52 | −3.6654 |
| 4 | 0 | 30 | 60 | 72 | 2.5 | 2.80 | −8.9432 |
| 5 | 0 | 30 | 60 | 72 | 3.3 | 2.57 | −8.1874 |
| 6 | 0 | 30 | 60 | 72 | 4 | 1.97 | −5.9113 |
| 7 | 0 | 40 | 90 | 100 | 2.5 | 2.92 | −9.3077 |
| 8 | 0 | 40 | 90 | 100 | 3.3 | 2.85 | −9.0969 |
| 9 | 0 | 40 | 90 | 100 | 4 | 2.54 | −8.0967 |
| 10 | 10 | 20 | 60 | 100 | 2.5 | 2.10 | −6.4444 |
| 11 | 10 | 20 | 60 | 100 | 3.3 | 2.38 | −7.5315 |
| 12 | 10 | 20 | 60 | 100 | 4 | 1.92 | −5.6886 |
| 13 | 10 | 30 | 90 | 28 | 2.5 | 1.14 | −1.1381 |
| 14 | 10 | 30 | 90 | 28 | 3.3 | 0.84 | 1.489 38 |
| 15 | 10 | 30 | 90 | 28 | 4 | 0.52 | 5.596 81 |
| 16 | 10 | 40 | 30 | 72 | 2.5 | 1.96 | −5.8451 |
| 17 | 10 | 40 | 30 | 72 | 3.3 | 1.52 | −3.6369 |
| 18 | 10 | 40 | 30 | 72 | 4 | 1.32 | −2.4443 |
| 19 | 20 | 20 | 90 | 72 | 2.5 | 2.64 | −8.4321 |
| 20 | 20 | 20 | 90 | 72 | 3.3 | 1.25 | −1.9697 |
| 21 | 20 | 20 | 90 | 72 | 4 | 1.08 | −0.6282 |
| 22 | 20 | 30 | 30 | 100 | 2.5 | 2.36 | −7.4582 |
| 23 | 20 | 30 | 30 | 100 | 3.3 | 2.18 | −6.7764 |
| 24 | 20 | 30 | 30 | 100 | 4 | 1.85 | −5.3434 |
| 25 | 20 | 40 | 60 | 28 | 2.5 | 1.58 | −3.9731 |
| 26 | 20 | 40 | 60 | 28 | 3.3 | 1.17 | −1.3637 |
| 27 | 20 | 40 | 60 | 28 | 4 | 0.64 | 3.8764 |
Figures 6 and 7 shows the variation in the erosion rate when varying the erosion parameters in terms of S/N ratio and Mean of Erosion rate. From both the figure, the effect of control variables on the erosion rate are well understood. The summarized values of S/N ratio are shown in table 3. The delta value in the table indicates the significance of the corresponding control factor on the output response (higher the delta value higher the parameter significance). It is evident from table that erodent velocity is more significant in affecting the erosion rate since it has higher delta value than other parameters, followed by redmud %, erodent discharge, impact angle and fiber content. According to Taguchi analysis better performance corresponds to higher S/N ratio value.
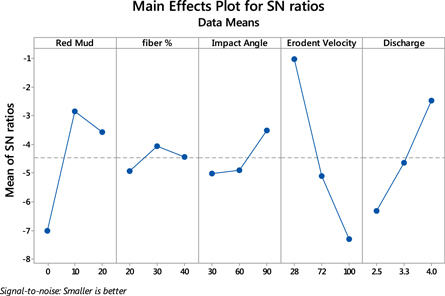
Figure 6. Main effect plot for S/N ratio and erosion parameters.
Download figure:
Standard image High-resolution image
Figure 7. Main effect plot of mean erosion rate and erosion parameters.
Download figure:
Standard image High-resolution imageTable 3. S/N Ratio response table.
| Level | Redmud % | Fiber % | Impact angle | Erodent velocity | Discharge |
|---|---|---|---|---|---|
| 1 | −7.028 | −4.934 | −5.024 | −1.025 | −6.315 |
| 2 | −2.849 | −4.075 | −4.907 | −5.111 | −4.467 |
| 3 | −3.563 | −4.432 | −3.509 | −7.305 | −2.478 |
| Delta | 4.179 | 0.859 | 1.514 | 6.280 | 3.337 |
| Rank | 2 | 5 | 4 | 1 | 3 |
Analysis of variance (ANOVA) experimentation was conducted on the present experimental data in order to find the statistical significance of the experiment variables like redmud%, fiber%, impact angle, erodent velocity and erodent discharge. The fitness of the predicted model with the experimental data can be concluded with the R2 value which should be greater than or equal to 90%. In the present analysis the R2 value is 91.17% this indicate that the analysed model fits well with the experimental data. Table 4 presents the ANOVA results for the conducted investigation. According to the presented ANOVA results as given in table 4, Erodent velocity has shown the highest contribution in determining the erosion rate as per the percentage of contribution followed by redmud wt% and discharge. The p-value indicates the significance of erosion variables in determining the erosion rate (smaller the p-value higher the significance). From the p-value it was concluded that the erodent velocity, redmud% and erodent discharge are significant in affecting the erosion rate since it has the p-value 0.000.
Table 4. S/N Ratio response table.
| Source | DF | Adj SS | Adj MS | F-Value | P-Value | % of contribution |
|---|---|---|---|---|---|---|
| Redmud % | 2 | 3.1982 | 1.599 11 | 23.89 | 0.000 | 28.59 |
| Fiber % | 2 | 0.0045 | 0.002 26 | 0.03 | 0.967 | 0.04 |
| Impact angle | 2 | 0.1034 | 0.051 71 | 0.77 | 0.478 | 0.92 |
| Erodent Velocity | 2 | 5.7709 | 2.885 47 | 43.11 | 0.000 | 51.59 |
| Discharge | 2 | 1.9747 | 0.987 36 | 14.75 | 0.000 | 17.67 |
| Error | 16 | 1.0710 | 0.066 94 | 1.20 | ||
| Total | 26 | 12.123 | 100 |
R2 = 91.17% R2Adj = 85.64%.
3.4. Solid particle erosion
Solid particle erosion test is influenced by erosion testing parameters and material properties. Solid particle erosion test on polymer composites largely depend on the erosion test parameters like impingement angle, erodent velocity, erodent flow rate. Figure 8 presents the interaction plot for erosion rate between the erosion parameters. Erosion rate of polymers composites will vary and mostly depend on the type of fiber and filler reinforcement. In the present investigation when the red mud weight percentage increases the erosion rate reduced significantly. This is because addition of red mud in the matrix increases the hardness of the composites. Further the impact caused by the kinetic energy of erodent get absorbed by the red mud particles incorporated. So that the impact force on the matrix and fiber reinforcement is reduced. Because of these two reasons the material exhibits good erosion resistance property with the addition of redmud. In addition, the uniform distribution of particle in the polyester matrix ensures the enhanced bonding strength. It is also noted that when increasing the red mud percentage to 20% there is a loss in erosion resistance of the composite when compared to 10% reinforced composite. This is because when increasing the red mud percentage, filler tend to accumulate over the matrix surface and at this condition a weaker bonding exits between the matrix and filler.
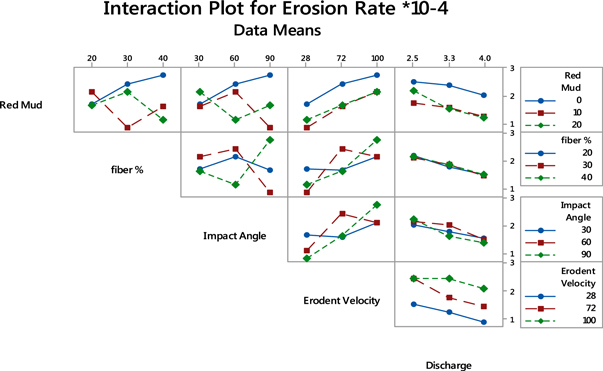
Figure 8. Erosion parameter interaction plot.
Download figure:
Standard image High-resolution imageWhen increasing the fiber percentage, the erosion rate decreases and then increases. Fibers tend to bend and break under continuous attack of the abrasive particles. When fibers are exposed to the erosion surface the erodent particles starts attacking the fibers surface. Owing to poor erosion resistance properties of fibers they are eroded more easily and results in increased erosion damage inform of fragmentation and fiber removal. It can be understood that the higher erosion rate is because of the removal of fiber and matrix in the composites. This proves the strong dependence of erosion rate on the material morphological structure.
The erosion rate decreases on increases the impact angle. It is well known that erosion is maximum at 15° to 30° for ductile materials in-case of brittle material erosion in peak at 90° impact angle [26]. In the present experimentation maximum erosion rate occurs at 30° impact angle for 30% red mud filled composites irrespective of fiber content whereas minimum erosion rate found at 10% red mud filled composites irrespective of fiber content. Thus it can be concluded that the semi-ductile property of the composites reduced the erosion rate at higher impact angle.
Higher the erodent velocity increases the composite erosion rate. At high velocity the hard abrasive particles impact the material surface, the kinetic energy of the particles get transformed to impinging area which deforms the material plastically and separates the reinforcement from matrix. However, the composite surface also undergoes surface damage by the formation of micro cuts and craters under the repeated attack of hard erodent particle at higher erodent velocity.
On increasing the erodent discharge rate a gradual drop in erosion rate was noted. Increase in the discharge rate of the erodent reduces the erodent velocity before hitting the contact surface. This is because when the erodent released from the nozzle at larger amount the particles collide with each other. At this condition the kinetic energy of the erodent get reduced which also affects the impact of erodent particles on the material surface. Further the sharp edges of the erodent also broke out due to particle collision at high velocity of air. However theoretically erosion rate is dependent of erodent discharge rate since it is assumed that all the erodent particle strikes the target material [27] and in practice considerable effect on erosion rate was noted under the influence of erodent discharge rate. Also it has been stated that erosion rate is proportional to the erodent discharge rate within certain range. This range is largely depend on the interference of arriving and the rebounding erodent particle.
3.5. Metallurgical analysis on erosion tested samples
To understand the erosion damage mechanism, the morphology of the eroded surfaces was studied by the SEM analysis. The erosion wear mechanism in fiber reinforced polymer is highly characterized by the micro cuts, extensive fiber damage, formation of craters and holes [28]. When comparing erosion damage occurred at lower (30°) and higher impingement angle (90°), material loss was more at lower impingement angle. At lower erodent velocity (42 m s−1) the erosion rate was found to be minimum and eroded material surface has only wear scars with formation of small craters, initiation of micro cuts and micro cracks. But as the erodent velocity increases from 28 m s−1 to 100 m s−1 the surface of the material shows severe erosion damage. At this condition deep grooves were formed, because of the continuous impact of the highly accelerated erodent particles. Repeated attack initiates cracks in the impinging surface, which is developed into deep grooves. Negative impact on erosion rate was noticed at higher impact velocity and lower discharge rate. Further in fiber rich area, the matrix material was peeled off and the fiber become more clearly visible under the matrix layer. In some regions the fibers were pulled out and micro cuts in the fiber were also noticed. Addition of redmud to the fiber matrix increases the erosion resistance property of the composite. But when increasing the filler content the composite exhibit higher erosion rate. This is because when adding filler red mud at higher ratio, a weak bonding strength is developed between the matrix and filler. So that when the accelerated erodent impact on the composite surface, it easily removes the reinforced filler particles from the matrix.
Figure 9 shows the SEM image of the 10% RM composite without erosion test. From figure 9(a) it is well clear that there is no trace for material damage due to erosion. The surface is smooth and clear without any rough surface but under erosion the surface become rougher because of the erosion wear damage which can be seen in figure 9(b). The presence of the redmud filler particles in the polymer matrix is clearly visible in the micrograph. This indicates the uniform distribution of redmud particle in the matrix body although the composite surface shows small amount of pores and voids. Figure 9(b) presents the SEM image of 10% red mud and 20% fiber reinforced composite tested at the impact angle of 90° and erodent velocity m/s 100 m s−1. The erosion damage was considerable at this condition. The surface exhibits the formation of small cut and micro cracks. The reinforced particles were pulled out of the surface. The same material when tested under 60° impact angle (100 m s−1) the erosion damage was completely different. Figure 9(c) presents the SEM image of composite having tested at impact angle 60°, erodent velocity 72 m s−1 and discharge rate 2.5 g m−1. At this condition the sharp erodent particles penetrates the surface of the composite and caused extensive damage through micro ploughing. From the micrograph the formation of plastic deformation in the material surface is well understood.
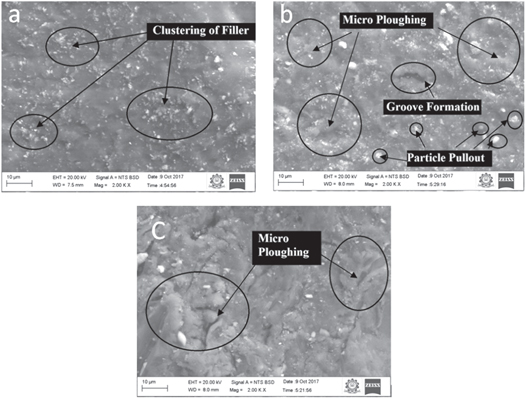
Figure 9. SEM image of the erosion tested 10% RM composite.
Download figure:
Standard image High-resolution imageFigure 10 shows the SEM view of composite having 20% redmud tested at impact angle 90˚ and 28 m/s velocity. The erosion at this condition is highly categorized by the formation of craters. Due the repeated impact of the erodent the matrix peeled off from the surface forming array of craters.

Figure 10. SEM image of the erosion tested 20% RM composite.
Download figure:
Standard image High-resolution imageFigures 11(a) and (b) shows erosion damage on the fiber reinforcement. The material loss at this case was considerably high because of the fiber damage. On the eroded surface of the composite erosion traces were clearly visible. The matrix was chipped off from the upper layer which results in fiber exposure. Reinforced fibers were found to be exposed due to matrix run out. Also the matrix covering the fiber were chipped off which exposes the fiber surface. Repeated attack of hard erodent particles on the fiber surface results in fiber damage and fiber fragmentation. Figure 11(a) is the SEM view of 20% redmud and 30% fiber reinforced composite eroded at 90° impact angle, the figure evident the formation of fracture and fragmentation on fiber surface due to the repeated impact of erodent on the fiber surface. Fiber debonding from the matrix and wear trace on fiber body was noted on SEM surface of the 40% fiber filled composite tested at 60° impact angle and 28 m s−1 erodent velocity which is shown in figure 11(b). On some regions the fibers were exposed fully, where fiber cut and bend also noticed.

Figure 11. (a) SEM image of the erosion tested 20% RM composite and 30% fiber. (b) SEM image of the erosion tested 20% RM composite and 40% fiber.
Download figure:
Standard image High-resolution imageIn-case of unfilled composites severe erosion damage was noticed through SEM analysis. Figure 12 shows the clear view on erosion mechanism on unfilled sisal fiber composites.

Figure 12. SEM image of the erosion tested 0% RM and 30% fiber reinforced composite.
Download figure:
Standard image High-resolution image
From SEM analysis it is understood that erosion loss in the composite occurs by several stages of material removal process. At initial stage the due to the erodent impact the matrix get removed which results in the exposure of fiber surface. Once the fiber get exposed fiber surface undergoes repeated impact of the hard erodent particle. This forms cracks and bend in the fiber which is evident from the SEM images reported. Bending of fiber reinforcement is possible because of the removal of supporting matrix interface. Further repeated attack breaks the fiber and matrix bonding which fragment and de-attach the fiber easily from the matrix.
4. Conclusion
Based on this experimental work, the effects of redmud reinforcement on the solid particle erosion wear of the redmud/sisal/polyester hybrid composite was investigated. In addition, the experimental results were analysed using Taguchi method for investigating the effects of erosion parameters on the erosion rate.
- The tensile and hardness strength of the composites was improved on the redmud addition. Addition of redmud witnessed the improvement in erosion resistance of the fabricated hybrid composite. Composite with 10% redmud addition shows maximum resistance against erosion irrespective of fiber weight percentage.
- Erosion rate was maximum at 15° to 30° for ductile materials in-case of brittle material erosion in peak at 90° impact angle. In the present experiment maximum erosion rate was noted at 30° impact angle. This confirms the semi ductile property of the developed hybrid composite.
- Taguchi and ANOVA analysis on the experiment results showed the significance of parameters in affecting the erosion rate. Both the results of Taguchi and ANOVA analysis are well correlated. Erodent velocity (51.59%) is found to be more significant in affecting the erosion rate followed by redmud wt% (28.59%), erodent discharge (17.67%), impact angle (0.92%) and fiber content (0.04%).
- SEM analysis on the eroded surface show higher damage in unfilled composites due to plastic deformation and fiber damage. At higher erodent velocity micro cuts were observed and at 30° impingement angle the eroded surface has severe micro ploughing which evident semi-ductile nature of the composite.
Acknowledgments
The authors would like to express their sincere thanks to Ministry of environment forest and climatic change (MOEF & CC), Government of India for the financial support (Project No 168/2016/RE (F No 19-20/2012-RE)).