

Abstract
The Manganese dioxide (MnO2) nanoparticles uniformly grown on graphene/Ni foam have been fabricated by a simple and effective electrodeposition method as electrode (MnO2/G/Ni foam) materials for electrochemical capacitors. The morphological and structural of the nanocomposites were studied by SEM, XRD and XPS. Electrochemical properties were tested by cyclic voltammetry (CV), electrochemical impedance spectroscopy (EIS) and galvanostatic charge/discharge (GCD). The results show the electrode of MnO2/G/Ni foam exhibit a high specific capacitance (1465.25 F g−1 at current density of 2 A g−1), excellent rate performance (998.25 F g−1 at 10 A g−1) and good cycle stability (86.09% after 5000 cycles for 10 A g−1). These results demonstrated that this low-cost and high performance device has broad application prospects for energy storage applications in electrochemical capacitors.
Export citation and abstract BibTeX RIS
1. Introduction
In recent years, with the increase of environmental issues and the appearance of serious energy crisis, the development of novel energy conversion and storage systems are in urgent need for the sustainable development of world [1]. Electrochemical capacitors (ECs) as the most effective and practical technology of the energy conversion and storage systems have gained comprehensively attention among the industry, society and academia, because of their outstanding power density, quickly response, fast charge-discharge rates, long cycling life, good safety and environmentally friendly [2]. They have been utilized in electric vehicles, hybrid electric vehicles, lightweight electronic fuses, starting power devices for fuel cells and many other stop-and-go systems [3].
In general, carbon materials, metal oxides/hydroxides and conducting polymers are used as the main electrode materials for capacitors [4]. However, carbon materials suffer from comparably low energy density owing to their limited specific surface area and pore-size distribution [5]; metal oxides/hydroxides are plagued by their relatively low charging-discharging rate and unsatisfactory stability [6, 7]. Conductive polymers have very low cycle life due to their properties [8], these reasons have greatly undermine their practical application in capacitors. Hence, it is an effective strategy for capacitors to obtain high performance electrodes that combining the advantages of active materials with metal oxides/hydroxides leading to good special capacitance, charging-discharging rates, and cycling lifetime.
Graphene is famous for excellent electrical conductivity, super-high specific surface area and outstanding chemical stability due to it is a single sheet of sp2 hybridized carbon atoms with a tight packing honeycomb lattice [9]. So it has been regarded as the best candidate for enormous potential electrode material. However, graphene also has many disadvantages. Such as serious agglomeration, re-stacking and rapid capacity decay of graphene, which make it inability to develop large surface area and reduces its specific capacitance [10]. To overcome these shortcomings, many researchers have introduced metal oxides onto graphene and found this method can prevent agglomeration and re-stacking of grapheme that making more surface area of graphene to be accessed by ions [11]. Manganese oxide (MnO2) is one of the most attractive metal oxides candidate materials for electrode material because of its excellent electrochemical properties, environmental friendliness, low cost with abundant natural resources [12]. Several studies have reported that it is feasible to produce MnO2/Graphene composites for electrochemical capacitors by the methods of microwave, simple solution processes, hydrothermaland so on. [13–16].
In this work, the composite electrode of MnO2 nanoparticles on graphene/Ni foam was obtained by simple and direct method, though used the synergistic effect of manganese oxide pseudo-capacitance and high conductivity and stability of graphene. The MnO2/G/Ni foam electrode exhibited a high specific capacitance of 1465.25 F g−1 at current density of 2 A g−1 and with a cycling stability of 86.09% after 5000 cycles. These results suggested that MnO2/G/Ni foam is a promising material for high performance ECs applications.
2. Experimental details
2.1. Materials and reagents
The Ni foam used in our experiments (110 PPI, 480 g m−2, 0.3 mm thick) was purchased from Kunshan Vesta Electronics Co. Ltd Oily slurry of graphene (5 wt%) was acquired from Suzhou Graphene Nanotechnology Co. Itd. Manganous acetate (Mn(CH3COO)2), Sodium sulfate(Na2SO4) and absolute ethanol were purchased from Sinopharm Chemical Reagent Co. Ltd, China. Deionized water (DI) was used in all the experiments. All other reagents were of analytical grade without further purification.
2.2. Preparation of MnO2/G/Ni foam electrode
1 ml Oily slurry of graphene was dispersed into 5 ml of absolute ethanol, and ultrasonically treated by a gentle bath for 1 h to form solution A. 0.05 mol l−1 Mn(CH3COO)2 and 0.05 mol l−1 Na2SO4 were dissolved in 30 ml deionized water at ambient temperature to form homogeneous solution B for electrodeposition.
Firstly, the Ni foam (1 * 1 cm) was carefully cleaned in the DI, hydrochloric acid, DI, absolute ethanol and DI in ultrasonic bath for 5 min, respectively and dried at 60 °C for 30 min In order to remove the nickel oxide layer and oily impurities that may exist on the outer surface. After that, the prepared Ni foam was repeatedly immersed in the solution A for 5 times and dried at 60 °C for 30 min to obtain G/Ni foam. Then used the high precision electronic balance to measure the weight of the sample and recorded it. Next, the prepared G/Ni foam as positive electrode, the platinum wire as negative electrode were deposited at room temperature for 10 min at a current density of 0.01 A cm−2 to acquire the MnO2/G/Ni foam electrode. Finally, the obtain electrode was washed in deionized water for 5 min and dried at 60 °C for 1 h and weight the sample again, in order to calculate the mass of deposited active substances.
In this study, the time of electrodeposition MnO2 were varied (5, 10, 15 and 20 min) for the other samples at the same reaction conditions to obtain the different MnO2/G/Ni foam electrodes. At last, the samples were respectively named as MnO2/G/Ni-x (x = 5, 10, 15 or 20).
2.3. Apparatus and measurement procedures
The surface characteristic of theas-preparedMnO2/G/Ni foam was carried out using scanning electron microscopy(SEM, JSM-6360LA). The crystallographic information of the as-prepared MnO2/G/Ni was examined by x-ray diffraction(XRD, Rigaku, RINT2000, Japan) operated at 220 mA and 45 kV with Cu Kα radiation in the range of 10–70 with step size 0.02. X–ray photoelectron spectroscopy(XPS, Axis Ultra DLD, Kratos, UK) was used to analyze the chemical composition and the energy state of samples with Al-K alpha radiation (hv = 14, 866 eV). The weight of all samples is measured 3 times by an electronic analytical balance (Sartorius CPA225D) with a accuracy of 100 mg.
To estimate the influence of MnO2 on the electrochemical performance of the electrode materials, we used a three-electrode cell system to measure the cyclic voltammetry (CV), electrochemical impedance spectroscopy (EIS) and galvanostatic charge/discharge (GCD)byCHI604E electrochemical workstation and by Zahner Ennium electrochemical workstation, respectively. Platinum plate was used as the counter electrode and a saturated calomel electrode was used as the reference electrode. All electrochemistry measurements were measured in 1 M Na2SO4 aqueous solution as the electrolyte.
3. Results and discussion
3.1. Morphology and structure of MnO2/G/Ni foam electrode
The microstructure and surface area of the MnO2/G/Ni foam electrode have an important influence on the electrochemical performance of supercapacitor [17]. Figure 1 shows the surface morphologies of pure Ni, G/Ni foam and theMnO2/G/Ni foam electrodes observed by SEM under different resolutions. The pure Ni foam with a lot of crisscross sponge like three-dimensional macroporous structure have more pores and larger specific surface area and the relevant expand the size of the images were displayed in figure 1(a). As seen in figure 1(b), the randomly aggregated graphene was loaded on the Ni foam presented a thin and wrinkled as sheet shape. Figures 1(c) and (d) show a low-magnification and a high-magnification SEM image of MnO2 nanoparticles deposited on G/Ni foam, respectively. It can be clearly seen that the nanoparticles were uniformly and firmly adhere on the G/Ni foam to form a layer on the surface and evenly covered the graphene sheets. Figure 2 reveals a representative EDS spectrum of theMnO2/G/Ni foam electrode. Through the Mn and O elements in proportion to prove the MnO2 been deposited on the G/Ni foam without other metal contamination. The C and Ni peaks are originated from the grapheme coated on Ni foam.

Figure 1 (a) SEM image of Ni foam, (b) SEM image of graphene, (c)–(d) SEM image ofMnO2/G/Ni foam electrode at the different magnification.
Download figure:
Standard image High-resolution image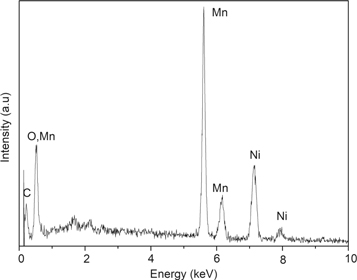
Figure 2. EDS pattern ofMnO2/G/Ni foam electrode.
Download figure:
Standard image High-resolution imageIn order to further confirm the crystal phase of the as-prepared material, XRD measurement was carried out. As shown in figure 3, the XRD patterns of the MnO2/G/Ni foam composite. Apart from three strong peaks at around ∼44.5°, ∼51.9° and ∼76.4° from the Ni foam, which overlaps with the basal reflection of graphene, all the other diffraction peaks at 2θ values of 12.26, 25.5, 37.52, 32.26 and 67.19 were respectively indexed to the (110), (101), (100)and (004) crystal planes of MnO2. This study indicates that MnO2 had deposited on the G/Ni foam material surface and no other impurities are observed. Reveal the effect of MnO2 on the G/Ni foam. The intensity of carbon diffraction peak decreased with the introduction of MnO2.
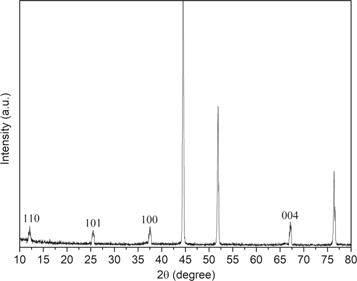
Figure 3. XRD spectra of the MnO2/G/Ni foam.
Download figure:
Standard image High-resolution imageMoreover, the XPS full spectra used to analyze the surface composition of MnO2/G/Ni foam composite also evidence the existence of C, O, and Mn in figure 4(a). In recent research has shown that the graphene oxide has C1s core level spectra which contain C=C bond, C–C bond, C–O bond, O–C=O bond and C=O bond which is similar to the reduced graphene oxide. Figure 4(b) shows the C1s core level spectra of MnO2 loaded on graphene with four peaks. It is corresponding to C–C/C=C (284.42 eV), C–O(285.86 eV), C=O(286.40 eV) and O–C=O(288.36 eV), respectively. The result is in consistent with previous research [16]. The three components of the O1s are show in figure 4(c), binding energies at 529.38 and 530.88 eV assigned to O-Mn bond and O–C bond. As shown in figure 4(d) the Mn2p3/2 and Mn2p1/2 peak located at 641.78 eV and 653.78 eV, respectively. The separation of peak energy is 11.9 eV, which agree well with previously reported data for MnO2 revealing that the oxidation state of Mn is +4. Further demonstrate for the existence of MnO2 on the G/Ni foam [18].
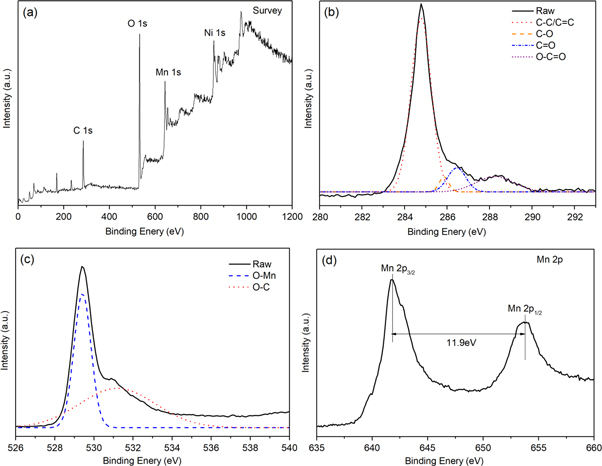
Figure 4. (a) XPS full spectra of the MnO2/G/Ni foam, (b) XPS C1s of the MnO2/G/Ni foam and, (c) XPS O1s spectra, (d) Mn 2p spectra of the MnO2/G/Ni foam.
Download figure:
Standard image High-resolution image3.2. Electrochemical behavior of MnO2/G/Ni foam electrode
The CV curves of pure Ni foam, pure MnO2, G/Ni foam andMnO2/G/Ni foam in 1 M Na2SO4solution at a scan rate of 50 mV s−1 are shown in figure 5(a). It can be seen clearly that the CV of pure Ni foam shows as a straight line in the picture and the CV of G/Ni foam has little change compare to the CV of pure Ni foam, indicating that they had little capacitance compare with the MnO2/Ni and MnO2/G/Ni electrode. The CV of the MnO2/Ni electrode shows obvious redox peaks due to pseudocapacitance characteristics of MnO2. The CV of MnO2/G/Ni electrode exhibited resemble rectangle shape can be seen clearly in picture, indicating the most ideal capacitive performance and fast and reversible redox peaks. It should be attributed to the synergistic effect of MnO2 particles and graphene makes the graphene sheets loaded on Ni foam provide surface area for MnO2 and enhance the low conductivity of MnO2 particles to increase specific capacitance. Figure 5(b) compares CV information for electrodes of different electrodeposition time in the range of 0–0.8 V at a scan rate of 20 mV s−1, the results show that the CV area increases gradually with the increase time of deposition MnO2. When the deposition time is more than 10 min, there is little obvious difference in CV between the electrodeofMnO2/G/Ni-15 and MnO2/G/Ni-20. The result shows that with excessive mass loading, the structure is tightly packed and the electrochemical active surface area is limited, leading to the specific capacitance reduce. It proves that the electrode of MnO2/G/Ni-10 possesses the highest specific capacitance which reached1997.5 F/g according equation (1),

Where m is the mass of the active material (g) and v is a scan rate (V/s), (Va − Vc) is sweep potential window (V) and I is the applied current (A). Figure 5(c) is CVs of the MnO2/G/Ni-10 electrode in the range from 0 to 0.8 V at the scan rate of 5, 10, 20, 50 and 100 mV s−1 in 1 M Na2SO4. It is obvious to see that the shape of the CV curve expand with the increase of scan rates, the area of curve increases and still retain the symmetry of the CV curve. It indicated excellent supercapacitor behavior of MnO2/G/Ni-10 electrode. The specific capacitance of as-prepared electrodes was calculated from the CVs with different scan rates, as shown in figure 5(d). With the scan rate increase, the specific capacitance of the as-prepared electrodes decrease, revealing that scan rates greatly influence the diffusion of ions into or out of MnO2 nanoparticles. When the scan rate is low, the ions can easily reach both the inner and outer surface of the MnO2 nanoparticles. Under such condition and due to the completion of the so-called insertion reaction, a near-ideal capacitive behavior is observed for the electrode material, which is reflected by the rectangular CVs. With increase of scan rate, the diffusion of ions can more likely happen on the outer surface of the MnO2 nanoparticles, which make the deeper area unoccupied and leads to incomplete insertion reaction. This reduces the contribution of the particles in the total capacitance and makes the electrode material show a huge capacity loss, which is reflected by the deviation of CVs from the ideal rectangle shape [19].
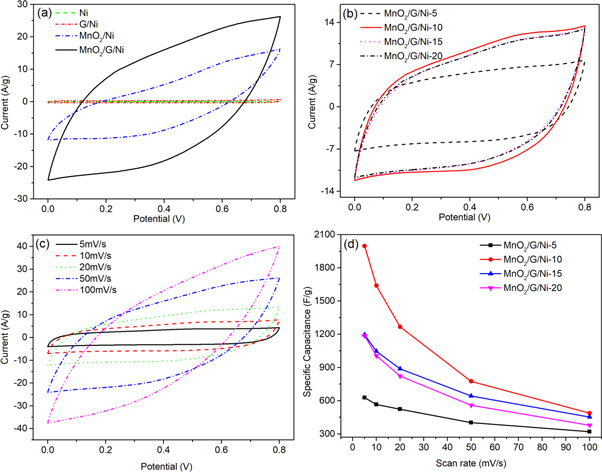
Figure 5. (a) CVs of bare Ni foam, G/Ni foam and MnO2/G/Ni foam electrode in 1 M Na2SO4 at a scan rate of 50 mV s−1,(b) CVs of different electrodeposition time for 5 min, 10 min, 15 min and 20 min in the range of 0–0.8 V at a scan rate of 20 mV s−1, (c)CVs of the MnO2/G/Ni-10 electrode in the range from 0 to 0.8 V at the scan rate of 5, 10, 20, 50 and 100 mV s−1 in 1 M Na2SO4, (d) the specific capacitance of the different electrodes scan rates(5-100 mV s−1).
Download figure:
Standard image High-resolution imageThe EIS was used to research the fundamental behavior of the prepared electrode materials in the frequency range from 100 kHz to 0.01 Hz and the Nyquist diagram was obtained. The Nyquist diagram is divided into the low-frequency region and the high-frequency region to analyze the response of components performance in frequency domain. The straight line in the low-frequency region expresses the process of ions diffusion in the electrolyte [20]. The semicircle in the high frequency region expresses the process of charge transfer at the interface of electrode-electrolyte [21]. The diameter of semicircle represents the charge transfer resistance (Rct) at the electrode interface [22]. Another feature in the high frequency is the intercept on the real impedance (Z−1) axis yields the electrolyte resistance (Re) [23]. Figure 6 shows the fitted impedance spectra of as-prepared electrodes, respectively. The curve of the MnO2/G/Ni-10 electrode is more vertical than other electrodes in the low-frequency. This indicating that the capacitive behavior with small diffusion resistance and near-ideal electric double-layer [24]. In the inset of figure 6, each electrode has a small semicircle at high frequency and the diameter of semicircle of MnO2/G/Ni-10 electrode is the lower than others, implying the MnO2/G/Ni-10 electrode with more specific capacitance than others. The EIS analysis clearly showed that the electrochemical behavior of MnO2/G/Ni-10 electrode was better than others.
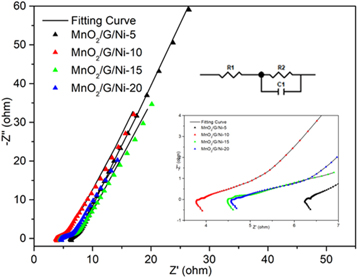
Figure 6. The Nyquist curves of as-prepared electrodes at different electrodeposition times (5 min, 10 min, 15 min and 20 min). Inset: the semicircle at high frequency range is amplified of each electrode. Inset: The electrical equivalent circuit ofMnO2/G/Ni-10 electrode.
Download figure:
Standard image High-resolution imageThe enhanced electrochemical performance of the MnO2/G/Ni-10 electrode is further conformed by GCD and the GCD curves of each electrode over the voltage window of 0−0.8 V at current densities of 2 A g−1 are shown in figure 7(a). The specific capacitance of these curves were calculate according the equation (2):

Where C(F/g) is the specific capacitance of as-prepared electrode, I(A) represents the charge-discharge current, Δt(s) is the discharge time, m(g) is mass of the electroactive material, and ΔV(V) stands for the potential window. At current densities of 2 A g−1, the calculated specific capacitance values of MnO2/G/Ni-x (x = 5, 10, 15 and 20 min) electrodes are 945, 1465.25, 1315 and 1265 F g−1 respectively. It can be concluded that the MnO2/G/Ni-10 electrode shows higher specific capacitance than other electrodes, which is consistent with the results of CV and EIS measurements. In figure 7(b), the charge–discharge curve of MnO2/G/Ni-10 electrode at different current densities maintains the triangle shape at high current density, confirms the high rate capacity of the electrode. The specific capacitance of the MnO2/G/Ni-10 electrode decreases from 1465.25 F g−1 at 2 A g−1 to 998.25 F g−1 at 10 A g−1, with the retention of 68.13%, which is higher than those of MnO2/G/Ni-5(60.85%), MnO2/G/Ni-15 (64.87%) and MnO2/G/Ni-20(61.26%) electrodes as shown in figure 7(c). The cycling stability is important to supercapacitor [25]. Figure 7(d) shows the capacitance retention of the MnO2/G/Ni-10 electrode for 5000 cycles at a current density of 10 A g−1. The electrode has excellent electrochemical stability with only 13.91% deterioration after 5000 cycles.
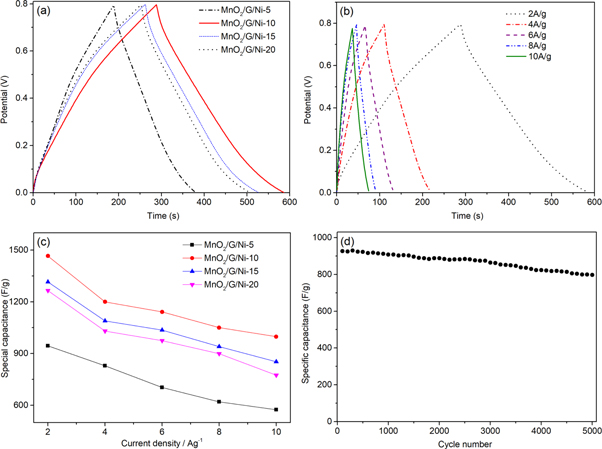
Figure 7. (a) Charge–discharge curves of the as-prepared samples at 2 A g−1, (b) the galvanostatic charge-discharge curves at five different current densities, (c) specific capacitance calculated by GCD curves at different current densities of each electrodes, (d) the capacity retention of the composite at a current density of 10 A g−1.
Download figure:
Standard image High-resolution image3.3. Preparation of an asymmetric supercapacitor
To further confirm the performance of as-prepared electrode, an asymmetric supercapacitor(ASC) was built using the G/Ni foam and MnO2/G/Ni foam as the negative electrode and positive electrode, respectively. The ASC used 1 M Na2SO4 as the electrolyte and used resin film to separate two electrodes. Similarly, the device was tested by CV, GCD and EISmeasurements. Figure 8(a) shows the CV curves at a scan rate of 20 mV s−1 shows the stable electrochemical potential windows of the electrodes. Figure 8(b) shows the made ASC still has the excellent capacitive behavior with rectangular CV curves at the cell voltages from 0.8 to 2.0 V. The CVs of the ASC at different scan rates is plotted in figure 9(a). It can be seen clearly, the shape of CVs keep unchanged although the scanning rate reach to 100 mV s−1, indicated low contact resistance in the equipment. Figure 9(b) depicts the GCD curve at various currents ranging from 2 to 10 A g−1 within the potential window of 0–1.8 V. When the current density reach to 2 A g−1, the shape of the charge curve towards nonlinear characteristics, further indicating that the charge storage mainly originated from Faradic redox reactions and verifying that the pseudocapacitance behavior. Figure 9(c) shows that the capacitance retention rate of the capacitor was 79.5% under the condition of3000 cycles at current density of 8 A g−1. The corresponding Nyquist plot which was obtained by EIS test (figure 9(d)) is to evaluate the electrochemical stability of the ASC. The plots possesses excellent vertical in the low-frequency and very small semicircle at high frequency. Figure 10 shows the Ragone plots of the device. The power density was obtained from different energy density is calculated by GCD curves according to equations (2), (3) and (4):


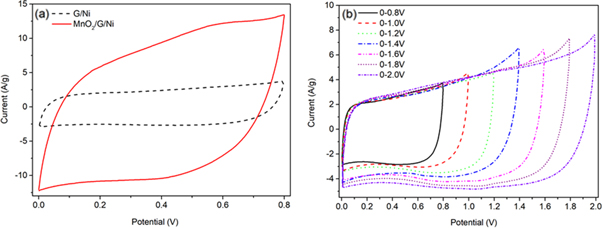
Figure 8. (a) Comparative CV curves of G/Ni and MnO2/G/Ni in a three-electrode system at a scan rate of 50 mV s−1, (b) Cyclic curves of the device of MnO2/G/Ni∣∣G/Ni measured at different potential windows at a scan rate of 20 mV s−1.
Download figure:
Standard image High-resolution image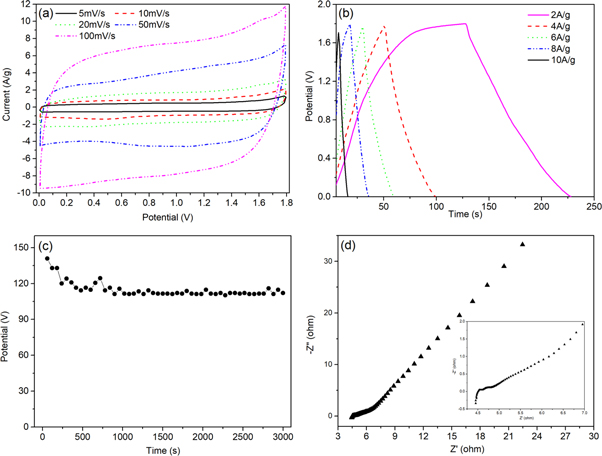
Figure 9. Electrochemical properties of the device of MnO2/G/Ni∣∣ G/Ni: (a) CV curves at different scan rates of 5, 10, 20, 50, and 100 mV s−1, (b) GCD curves at the current densities of 2, 4, 6, 8 A g−1 and 10 A g−1, (c) the capacity retention of the ASC at a current density of 8 A g−1, (d) Nyquist plots of the device.
Download figure:
Standard image High-resolution image
Figure 10. Ragone plot of the as-assembled ASC (insets are the voltage window by a voltmeter and photograph of 4 red LEDs that are powered by the tandem SCs).
Download figure:
Standard image High-resolution image
 (V) stands for the charging potential window, t is the charge time (s). It showed that the device could achieve a high energy density 113.95 Wh kg−1 at a power density of 1800 W kg−1, which much higher than that of the researchers using MnO2 or graphene as electrode materials, as shown in Table 1. At last, when the supercapacitor was fabricated, after it was charged for 30 s at 20 A g−1, the voltage can reach to 2.7 V (figure 10) and light up four red LEDs in series for 10 min (figure 10). The results certify the immense potential of the MnO2/G/Ni electrode in electrochemical supercapacitors.
Table 1. The obtained ASC is compared with those obtained by previous researchers.
| Electrode materials | Electrolyte | Specific capacitance(F/g) | Working potential(V) | Maximum energy density(Wh/g) | Maximum power density(kW/kg) | Cyclic performance | References |
|---|---|---|---|---|---|---|---|
| CVC-2∣∣MnO2/C | Na2SO4 solution | 45 | 1.6 | 9.5 | 4 | 90% after 100 cycles | [19] |
| MnO2/graphene∣∣graphene | Na2SO4 solution | 31 | 2 | 30.4 | 5 | 79% after 1000 cycles | [16] |
| 3DMnO2/MnCO3/rGO aerogels∣∣rGO aerogel | Na2SO4 solution | 50.6 | 1.6 | 17.8 | 400 | 84.1%after 2000 cycles | [8] |
| MnS/GO-NH3//AC | Na2SO4 solution | 55.6 | 1.6 | 14.9 | 66.5 | 81%after 2000 cycles | [13] |
| MnO2/grapheme/Ni∣∣ grapheme/Ni | Na2SO4 solution | 73.34 | 1.8 | 31.65 | 9 | 79.5% after 3000 cycles | Our work |
4. Conclusion
A MnO2/G/Ni foam electrode was prepared by cathodic pulse deposition method is applied to electrochemical supercapacitors and the electrochemical properties have been tested with Na2SO4 as the electrolyte. The experimental results showed thatelectrodepositionMnO2 on G/Ni foam has a high specific capacitance (1465.25 F g−1 at current density of 2 A g−1), excellent rate performance (998.25 F g−1 at 10 A g−1) and good cycle stability (86.09% after 5000 cycles for 10 A g−1). In addition, the synthetic process is simple with no pollution, no harm and the supercapacitor is low cost with outstanding stability and high rate capability which has broad application prospect for energy storage applications in electrochemical supercapacitors.
Acknowledgments
We would like to thank the Engineering Research Center of Agricultural Multi-Dimensional Sensor Information Perception, Heilongjiang Province, and Heilongjiang Provincial Key Laboratory of Micro-nano sensor component. This work was jointly supported by the University Nursing Program for Young Scholars with Creative Talents in Heilongjiang Province (Grant No. UNPYSCT-2016087), Scientific Research Foundation for the Returned Overseas Chinese Scholars in Heilongjiang Province, Project of Plant food processing technology-Heilongjiang Province superiority and characteristic discipline (Grant No. YSTSXK201873), Fundamental Research Funds in Heilongjiang Provincial Universities (No.135109244, 135309115, 135309211), as well as Heilongjiang Science Foundation Project (JQ2019F003, ZD2019F004).