

Abstract
The present research work reports the fabrication of aluminium alloy 7075(AA 7075) reinforced with particles of aluminium oxide (Al2O3) and boron carbide (B4C) using stir casting technique. The research was carried out in two stages. In the first stage, orthogonal array and signal-to-noise ratio were employed to study the influence of process parameters on dry sliding wear behaviour of composites reinforced with varying weight percentage of Al2O3 (8,10 and 12 wt%) particles. In the second stage optimization, optimum weight percentage ratio of Al2O3 (12 wt%) is selected from the first stage and reinforced with different weight percentages of B4C (2, 3 and 4 wt%). A three level face centred composite design experiment was developed using response surface methodology. Analysis of variance and confirmatory experiments were performed to validate the predictive model. The surface plots revealed that wear rate increases with an increase in load and sliding distance. On the other hand wear rate decrease with increase in reinforcement percentage. In the case of sliding velocity, the wear rate decreased initially but after reaching critical value it increased. The wear was also analysed using scanning electron microscopy analysis which confirms the trend by the predictive model. The results also confirmed that by adding B4C the wear of alumina reinforced composites have significantly reduced.
Export citation and abstract BibTeX RIS
1. Introduction
Metal matrix composite reinforced with hard particles have superior mechanical and physical properties. Although many metal have been used as the matrix material but aluminium is the most preferred matrix material which is used in the industry [1]. Many researchers have studied metal matrix composites, and their results concluded that metal matrix composites have better high tensile strength [2], high wear resistance [3], improved hardness [4] and high flexural strength [5] when compare to pure metals and alloys. There have been a constant need to increase attention towards aluminium composites for tribological applications [6]. Aluminium (7XXX) series alloys have superior mechanical and thermal properties [7].
The preferred method for fabrication of aluminium composites is liquid metallurgy or powder metallurgy [8, 9]. Sucitharan et al [10] studied the characteristics of aluminium/zircon sand metal matrix composites fabricated using stir casting. They concluded that process parameters should be controlled carefully for successful fabrication of MMC. In liquid metallurgy, the particulates are uniformly distributed over the liquid metal before casting and solidification [11, 12]. Kok and Ozdin [13] investigated the wear behaviour of Al2O3 reinforced metal matrix composite using a pin-on-disc apparatus against SiC abrasive papers. They concluded that wear resistance of the composites was significantly improved as compared to aluminium alloy. They also concluded that wear resistance increased with particle content and size but decreased with sliding distance, load and abrasive girt size. Surappa et al [14] investigated the effect of adding alumina particles on the wear and compared them with wear rates of Al-11.8Si eutectic and Al-16Si hypereutectic . The results concluded that adhesive and abrasive wear properties of cast Al-Al2O3 composite were comparable with Al-Si alloys. Umanth et al [15] investigated the wear behaviour of aluminium composite discontinuously reinforced with SiC and Al2O3 and also developed the mathematical model to predict the wear behaviour of the composites in correlation with four important factors. The results concluded that 15% hybrid composites have better wear resistance as compared to 5% hybrid composites.
Ravinder Kumar and Suresh Dhiman [16] investigated wear rate of Al alloy and Al alloy hybrid composite reinforced with SiC and Graphite. It is inferred from the results that hybrid composites have lower specific wear rate at all load, sliding speed and sliding distance. The results also show that load is the most significant factor and sliding speed and sliding distance are secondary factors which effect wear rate. Padmavathi and Ramakrishnan [3] investigated wear and mechanical properties of Aluminium metal matrix composite with pigment (TiO2) reinforcement having weight fractions as 0.5%,1% and 1.5%. The results showed improved wear and mechanical properties with 1% weight fraction. Baradeshwaran et al [17] investigated the mechanical and wear properties of aluminium composite reinforced with Al2O3 and graphite. The results showed that wear and mechanical properties increased with increase in weight percentage of ceramic phase.
In wear experiments, the wear rate is expressed in terms of two or three variables. In these papers [18–23] wear behaviour of aluminium metal matrix composites have been studied using various statistical and numerical methods such as Response Surface Methodology, Taguchi's design approximation, factorial design model, genetic algorithms and artificial neural network. In full factorial design, the number of test run increases exponentially, which requires high cost and prolonged time. To reduce the time and cost fractional factorial design can be used, but it may not give the optimum working combinations. Taguchi experimental design uses an orthogonal array which is an extension of factorial design and can simplify the experiments. Due to this Taguchi method is used for wide range of industrial applications [24]. Response surface methodology (RSM) is applied by many researchers to study the abrasive behaviour of aluminium composites under various load, sliding velocities, sliding speed and different percentage of reinforcement. Bayhen and Ohel [25] studied the wear of AlSi7 Mg/SiCp composite using RSM for minimum wear rate at optimum reinforcement percentage and sliding distance.
However, all the above research works have fabricated various metal composites using different ceramics. But none of the researchers have used two optimal techniques to fabricated hybrid metal composite. The Al 7075 is a metal alloy which is highly used in different parts in the aerospace and automobile industry which are in a state of constant wear. The present work aims to investigate the effect of process parameters on wear properties of Al7075/Al2O3/B4C composites fabricated using liquid metallurgy route. The research is carried in two stages. In the first stage, Al2O3 with different weight percentages is reinforced, and Taguchi design methodology is applied for process optimization. In second stage optimum value of Al2O3 reinforcement percentage is selected and reinforced with variable weight percentage of B4C and RSM was used to elucidate the dry sliding behaviour of Al2O3/B4C particulate reinforced Al-7075 matrix composites.
2. Materials and methods
2.1. 2.1. Selection of materials
In the present work Al 7075 alloy was used as the base material and its chemical composition is given in table 1. The particulates of Al2O3 and B4C with an average particle size of about 60 μm and 80 μm were used as reinforcement.
Table 1. Chemical composition of Al 7075 alloy.
| Element | Silicon | Iron | Copper | Manganese | Magnesium | Chromium | Nickel | Zinc | Titanium | Aluminum |
|---|---|---|---|---|---|---|---|---|---|---|
| Content | 0.13 | 0.42 | 1.42 | 0.12 | 2.42 | 0.21 | 5.4 | 0.11 | Balance |
2.2. Fabrication of the composite
The fabrication of the composite filled with particulate reinforcement was carried out using stir casting set up as shown in figure 1. The aluminium ingots were cut into pieces of weight about 1kg and placed in a crucible, which was introduced in an electrical resistance stir casting furnace and heated at a temperature of 800 °C. After the attainment of molten state, Magnesium (1 wt%) was added to improve the wettability of the reinforcement particles. Magnesium helps to reduce agglomeration and improves wettability [26]. The preheated reinforcement particles were added through the hooper mechanism manually in the crucible. During the process, the molten metal is continuously agitated using a mechanical stirrer at 250 rpm for 5 min to have uniform dispersion of the reinforcement particles. The molten materials is then poured into the preheated metallic dies. After the solidification at the room temperature the composite specimen was ejected from the die.
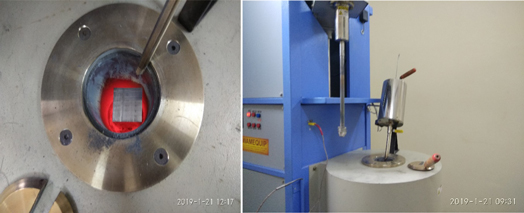
Figure 1. Stir casting set up for the composite preparation.
Download figure:
Standard image High-resolution image2.3. Microstructural examination
Microstructural Analysis was carried to analyse the microstructure of Al 7075/Al2O3/B4C composites fabricated through stir casting process using Scanning Electron Microscope (SEM). In SEM the image is formed by the reflection of bombarded electrons.
2.4. Experimental design
In the first stage, Taguchi Method is applied to determine the most influential parameter and to investigate the best weight percentage of reinforcement for minimum wear. The process parameters and their levels are shown in table 2. A standard Taguchi L9 (34) array was chosen for the statistical analysis as shown in table 3. In Taguchi method the experimental results are converted to signal-to-noise(S/N) ratio. Lower the better is applied in this study since performance is measured in terms of wear, a property which should be as low as possible. The effect of reinforcement content on the wear property is studied and the alumina reinforced composite with lowest wear is selected and reinforced with different weight percentage of B4C particles.
Table 2. Factors and levels used in the experiment.
| Factors | Designation | −1 | 0 | 1 |
|---|---|---|---|---|
| Reinforcement (wt%) | R | 8 | 10 | 12 |
| Sliding Speed (m s−1) | S | 1.2 | 2.0 | 2.8 |
| Load(N) | L | 30 | 50 | 70 |
| Sliding Distance | D | 2400 | 2900 | 3400 |
Table 3. Experimental design using L9 orthogonal array.
| Sliding velocity | Load | Sliding distance | Reinforcement ratio | Wear | S/N |
|---|---|---|---|---|---|
| 1.2 | 30 | 2400 | 8 | 0.0142 | 36.9542 |
| 1.2 | 50 | 2900 | 10 | 0.0150 | 36.4782 |
| 1.2 | 70 | 3400 | 12 | 0.0155 | 36.1934 |
| 2.0 | 30 | 2900 | 12 | 0.0140 | 37.0774 |
| 2.0 | 50 | 3400 | 8 | 0.0155 | 36.1934 |
| 2.0 | 70 | 2400 | 10 | 0.0160 | 35.9176 |
| 2.8 | 30 | 3400 | 10 | 0.0145 | 36.7726 |
| 2.8 | 50 | 2400 | 12 | 0.0150 | 36.4782 |
| 2.8 | 70 | 2900 | 8 | 0.0165 | 35.6503 |
Response surface methodology is an analytical and mathematical technique which is used to determine the relationship between parameters and responses by performing minimum number of experiments [27]. In second stage of the research, response surface methodology is used to determine the relationship between sliding distance, velocity, load and reinforcement content. The weight percentage of Al2O3 having minimum wear is selected from the first stage and reinforced with varying weight percentage of B4C as shown in table 4. Dry sliding wear characteristics is taken as response. Face Centre composite design (FCD) was selected to determine and analyse the results. The experimental designed using RSM is shown in table 5. with coded and actual values of the four parameters along with the results obtained in weight loss. Analysis of Variance (ANOVA) is also applied to determine the statistically significant parameters.
Table 4. Factors and levels used in the experiment.
| Factors | Designation | −1 | 0 | 1 |
|---|---|---|---|---|
| Reinforcement (wt%) | R | 14 (12%Al2O3 + 2%B4C) | 14 (12%Al2O3 + 3% B4C) | 14 (12%Al2O3 + 4% B4C) |
| Sliding Speed (m/s) | S | 1.2 | 2.0 | 2.8 |
| Load(N) | L | 30 | 50 | 70 |
| Sliding Distance | D | 1400 | 2400 | 3400 |
Table 5. Details of test combinations in coded and actual values of factors and corresponding experimental results.
| Wear | |||||||||
|---|---|---|---|---|---|---|---|---|---|
| Mn jk' | R | S | L | D | Speed, A | Load, B | Sliding distance, C | % Reinforcement D | Al/Al2O3/B4C (g) |
| 1 | −1 | −1 | −1 | −1 | 1.20 | 70.00 | 3400.00 | 2.00 | 0.0185 |
| 2 | 1 | −1 | −1 | −1 | 2.00 | 50.00 | 2900.00 | 3.00 | 0.0065 |
| 3 | −1 | 1 | −1 | −1 | 2.80 | 30.00 | 3400.00 | 4.00 | 0.0087 |
| 4 | 1 | 1 | −1 | −1 | 2.00 | 50.00 | 2900.00 | 3.00 | 0.0071 |
| 5 | −1 | −1 | 1 | −1 | 2.00 | 50.00 | 3400.00 | 3.00 | 0.0084 |
| 6 | 1 | −1 | 1 | −1 | 2.80 | 70.00 | 2400.00 | 4.00 | 0.0061 |
| 7 | −1 | 1 | 1 | −1 | 2.00 | 50.00 | 2900.00 | 4.00 | 0.0038 |
| 8 | 1 | 1 | 1 | −1 | 1.20 | 70.00 | 2400.00 | 4.00 | 0.0041 |
| 9 | −1 | −1 | −1 | 1 | 2.80 | 30.00 | 2400.00 | 4.00 | 0.0051 |
| 10 | 1 | −1 | −1 | 1 | 2.00 | 50.00 | 2400.00 | 3.00 | 0.0042 |
| 11 | −1 | 1 | −1 | 1 | 2.80 | 50.00 | 2900.00 | 3.00 | 0.0081 |
| 12 | 1 | 1 | −1 | 1 | 1.20 | 70.00 | 3400.00 | 4.00 | 0.011 |
| 13 | −1 | −1 | 1 | 1 | 1.20 | 30.00 | 3400.00 | 2.00 | 0.012 |
| 14 | 1 | −1 | 1 | 1 | 2.80 | 30.00 | 2400.00 | 2.00 | 0.0086 |
| 15 | −1 | 1 | 1 | 1 | 1.20 | 30.00 | 2400.00 | 4.00 | 0.002 |
| 16 | 1 | 1 | 1 | 1 | 1.20 | 70.00 | 2400.00 | 2.00 | 0.0124 |
| 17 | −2 | 0 | 0 | 0 | 1.20 | 30.00 | 3400.00 | 4.00 | 0.0082 |
| 18 | 2 | 0 | 0 | 0 | 2.00 | 50.00 | 2900.00 | 3.00 | 0.0066 |
| 19 | 0 | −2 | 0 | 0 | 2.80 | 70.00 | 3400.00 | 2.00 | 0.0166 |
| 20 | 0 | 2 | 0 | 0 | 2.00 | 50.00 | 2900.00 | 2.00 | 0.0096 |
| 21 | 0 | 0 | −2 | 0 | 2.80 | 70.00 | 3400.00 | 4.00 | 0.01 |
| 22 | 0 | 0 | 2 | 0 | 2.80 | 70.00 | 2400.00 | 2.00 | 0.0136 |
| 23 | 0 | 0 | 0 | −2 | 2.00 | 50.00 | 2900.00 | 3.00 | 0.0069 |
| 24 | 0 | 0 | 0 | 2 | 2.80 | 30.00 | 3400.00 | 2.00 | 0.011 |
| 25 | 0 | 0 | 0 | 0 | 2.00 | 50.00 | 2900.00 | 3.00 | 0.0061 |
| 26 | 0 | 0 | 0 | 0 | 2.00 | 30.00 | 2900.00 | 3.00 | 0.0042 |
| 27 | 0 | 0 | 0 | 0 | 1.20 | 50.00 | 2900.00 | 3.00 | 0.0077 |
| 28 | 0 | 0 | 0 | 0 | 2.00 | 50.00 | 2900.00 | 3.00 | 0.0065 |
| 29 | 0 | 0 | 0 | 0 | 1.20 | 30.00 | 2400.00 | 2.00 | 0.0069 |
| 30 | 0 | 0 | 0 | 0 | 2.00 | 70.00 | 2900.00 | 3.00 | 0.0082 |
2.5. Dry sliding wear test
To study the tribological behaviour Al2O3 reinforced composites with different weight percentage of reinforcement and Al2O3/B4C hybrid composites. The specimen of diameter 8mm and length 30 mm were machined out of composites. The test were performed using pin-on-disc tribometer (Model: TR 201, DUCOM) according to ASTM: G99-05 Standard as shown in figure 2. The tribometer consists of hardened counterface made up of EN 31 steel of hardness 60 HRc and surface roughness of 0.1 μm. All the samples were surface finished using SiC emery paper of grade 600, 800 and 1200 on a Buehler Eco Met 30 grinder polisher. The tests were conducted for different values of reinforcement weight percentage, load, sliding speed and sliding velocity. The experiments were designed as per Taguchi orthogonal array (L9) and RSM (FCD) in first and second stages of the research respectively. The specimen is kept stationary and the disc rotates which produces sliding wear. The load is applied through lever mechanism which maintains continuous contact between the specimen and disc. The experiments were conducted at room temperature (30 °C–35 °C) and relative humidity of 25%–35% without lubrication (dry sliding conditions). The weight loss during the sliding wear behaviour of the composite is determined by measuring after each run using an accuracy of 0.0001 g. For every test condition, at least two runs were performed and average was used.
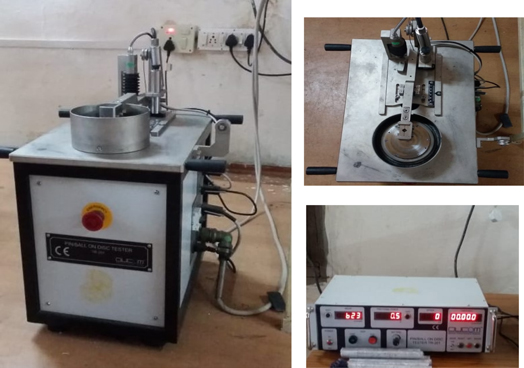
Figure 2. Pin on disc wear tester.
Download figure:
Standard image High-resolution image3. Results and discussion
The following sections describe the microstructural investigation, scanning electron microscopy (SEM) analysis and dry sliding wear characteristics.
3.1. Microstructural analysis
The microstructure of the cast composites is shown in figure 3. The uniform dispersion of alumina and boron carbide particles can attributed to the stirring speed of 250 r.p.m. Sufficient agitation allowed wettability of the molten metal with reinforcement by breaking down the oxide layer which results in spreading of the molten metal around the particles. The results confirmed that uniform dispersion of particles can be achieved using stir casting process. Similar results were obtained Singla et al [28].
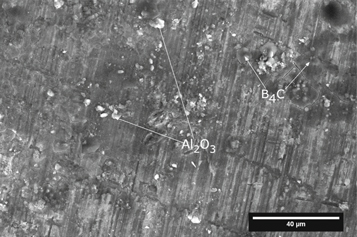
Figure 3. Microstructure of Al/Al2O3/B4C cast composite.
Download figure:
Standard image High-resolution image3.2. SEM analysis
SEM images of worn surfaces of Al7075/Al2O3/B4C composites that resulted from dry sliding wear is shown in figures 3–5. The micrographs of the worn surfaces have a common feature that is presence of parallel lines which represents wear tracks in the sliding direction. Figures 3(a)–(c) shows the wear due to change in load on the wear surface at constant velocity, sliding distance and reinforcement ratio. 2m s−1, 2900, and 3% B4C/12% Al2O3 respectively. It is observed that at low load of 30 N (figure 4(a)) there are scratches and shallow grooves at a few places which results in low wear rate. This can be attributed due to the low contact between the specimen and the counterface due to the reinforcement particles which act as load bearing elements. These particles have prevented the load transfer to the matrix material . The wear at a load of 50 N (figure 4(b)) have continuous grooves along the sliding direction of the specimen due to increase in material removal as the contact between the surfaces increased with increase in load and produced continuous grooves on the surface of the specimen. The grooves may be formed since the hard reinforcement particles protects the contact surface which leads to less penetration of the abrasive grits. Abrasive wear is caused by the penetration of the hard particles in the softer surface and displacing the materials in the form of silvers and elongated chips [29].
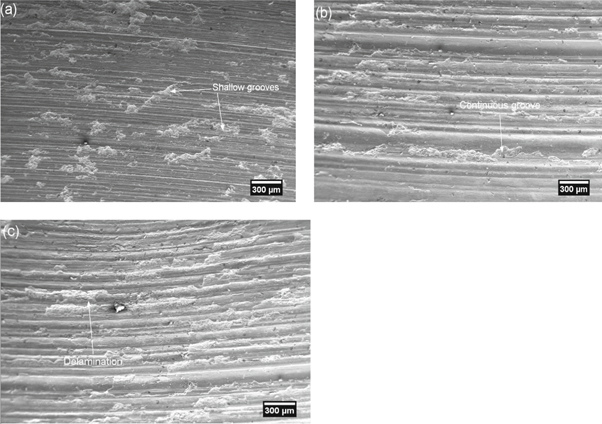
Figure 4. Worn surface of Al 7075/Al2O3/B4C composite under various conditions. (a) Load = 30, Speed = 2.0 m s−1, Sliding dist = 2900 m, R% = 3% B4C/12%Al2O3; (b) Load = 50, Speed = 2.0 m s−1, Sliding dist = 2900 m, R% = 3% B4C/12%Al2O3; (c) Load = 70, Speed = 2.0 m s−1, Sliding dist = 2900 m, R% = 3% B4C/12%Al2O3.
Download figure:
Standard image High-resolution image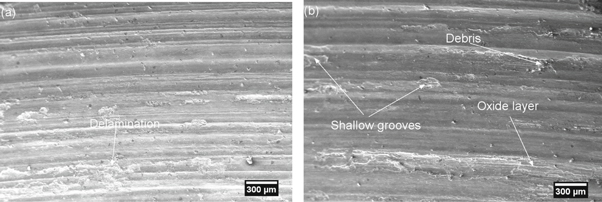
Figure 5. Worn surface of Al 7075/Al2O3/B4C composite under various conditions. (a) Load = 70, Speed = 1.2 m s−1, Sliding dist = 2400 m, R% = 2% B4C/12%Al2O3; (b) Load = 70, Speed = 1.2 m s−1, Sliding dist = 2400 m, R% = 4% B4C/12%Al2O3.
Download figure:
Standard image High-resolution imageAt higher loads, the hard oxide protective layer formed on pin during wear test becomes unstable and fractures the material. This results in contact of substrate materials (both pin and disc) and get welded to each other thus increasing the wear rate. The plastic deformation also occurs at higher loads which results in subsurface crack initiation and results in adhesive wear of pin with disc [30]. The wear surface (figure 4(c)) at a high load of 70 N suffers from severe delamination. It is because the protective layer of the reinforcing particles is not able to remain stable at higher loads which may be due to large amount of plastic strain in the deformed layer of the composite which gives rise to crack initiation and propagation, void nucleation in the subsurface. The material at the surface gets removed and the cracks moves nearer to the wear surface causing removal of surface layers due to delamination [31]. It may also be caused due to high temperature at the interfaces. The high temperature is caused by the friction force between the two surfaces due to heavy contact. This will result in high deformation causing delamination with increasing load. The wear trend shown in the surface plots are confirmed by SEM images. The wear rate increases with increase in load. The same mechanism is observed by other researchers [32, 33]. Figures 5(a)–(b) depicts the micrographs of wear surfaces due to change is percentage weight of boron carbide particulates. The (figure 5(b)) has less wear as compared to (figure 5(a)). which can be attributed due to plough mechanism. The plough mechanism depends on the plastic deformation which is caused by the heat generation during sliding and hardness of the material. It has been found that as the% weight of boron carbide particles increases in the MMCs, the hardness of MMCs also increases. Therefore, due to high hardness, less ploughing action observed in the specimen.
The wear mechanism for change in velocity from 1.2 m s−1 to 2.0 m s−1 is shown in figures 6(a), (b) The wear in (figure 6(a)) shows more material removal which can be attributed to the low velocity which increased the contact time between the specimen and counterface. The wear at velocity 2.0 m s−1 (figure 6(b)) shows the formation of MML because the surface is softened by the high temperature induced by the high velocity of the interface. Soften material acts as lubricant by forming oxide layer and protects the surface form wear. Previous studies have also observed the same phenomenon [33, 34].

Figure 6. Worn surface of Al 7075/Al2O3/B4C composite under various conditions. (a) Load = 50, Speed = 1.2 m s−1, Sliding dist = 2900 m, R% = 3% B4C/12%Al2O3; (b) Load = 50, Speed = 2.0 m s−1, Sliding dist = 2900 m, R% = 3% B4C/12%Al2O3.
Download figure:
Standard image High-resolution image3.3. Dry sliding wear characteristics
The parameters and their influence on wear rate was determined using S/N response table as shown in table 6. The factor that effects wear rate most depends on the value of Δ (Delta) as shown in table 6. Delta is obtained by taking difference between maximum and minimum S/N ratios for a particular parameter or control factor. The higher the value of delta the more significant is the control factor. The control factors and their interactions were sorted according to the value of delta. The most influential factors were applied load and reinforcement ratio. The order of influence factor is also shown by mean response table 7. which has the same results on the ranking of the influence of the factors.
Table 6. Response table for signal to noise ratios.
| Level | Sliding velocity | Load | Sliding distance | Reinforcement ratio |
|---|---|---|---|---|
| 1 | 36.54 | 36.93 | 36.45 | 36.27 |
| 2 | 36.40 | 36.38 | 36.40 | 36.39 |
| 3 | 36.30 | 35.92 | 36.39 | 36.58 |
| Delta | 0.24 | 1.01 | 0.06 | 0.32 |
| Rank | 3 | 1 | 4 | 2 |
Table 7. Response table for means.
| Level | Sliding velocity | Load | Sliding distance | Reinforcement ratio |
|---|---|---|---|---|
| 1 | 0.0149 | 0.01423 | 0.01507 | 0.0154 |
| 2 | 0.01517 | 0.01517 | 0.01517 | 0.01517 |
| 3 | 0.01533 | 0.016 | 0.01517 | 0.01483 |
| Delta | 0.00043 | 0.00177 | 0.0001 | 0.00057 |
| Rank | 3 | 1 | 4 | 2 |
The S/N ratio plots are shown in figure 7(a). The optimal values can be easily determined from these graphs. Figure 7(b). shows the optimum condition for the minimum wear A1B1C1D3 which implies that to reduce wear sliding velocity, load, sliding distance should be lowered and reinforcement is to be increased. Table 6 suggests that applied load is the most dominating factor in controlling the wear of aluminium composite which is also shown by Archard's law [34]. Similar results were reported by many researchers [35–37].
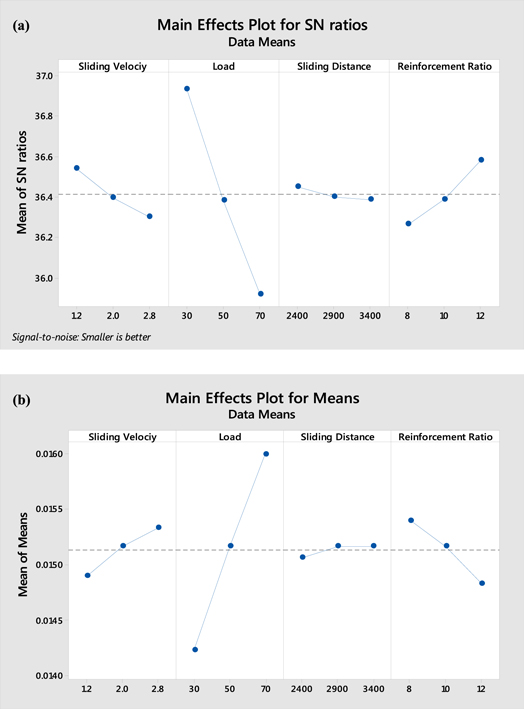
Figure 7. (a) Main effects plots for wear rate of MMCs: S/N ratio and (b) mean. (b) Main effects plots for wear rate of MMCs: mean.
Download figure:
Standard image High-resolution imageThe second most effective factor on the wear rate is the rate of reinforcement. It has been observed that the wear rate decreases with increase in reinforcement rate. This reduction in wear rate can be attributed to the increase in hardness of the composite with increase in reinforcement rate. The results obtained are similar to Basavarajappa [38] Gul and Acilar [39].
Sliding speed is the third influential factor on the wear rate. Generally the wear rate increases with increase in the sliding speed. Sato and Mehrabian [40] investigated the wear properties of SiC reinforced aluminium metal matrix composites and found that there is no direct relationship between the wear rate and sliding speed.
Sliding distance also effects the wear rate of the composites. With increase in sliding distance there is increase in temperature of the sliding surface which leads to deformation. Due to deformation there is volumetric wear loss of the composites [41]. Kok Ozdin [13] investigated the wear properties of aluminium composite reinforced with alumina. They concluded that the wear rate increases with increase in the sliding distance. Prasad et al [42] investigated Zinc based alloy reinforced with SiC particles. The results concluded that wear rate decreases with sliding distance.
3.4. Analysis of variance (ANOVA) for wear behaviour
ANOVA was used to determine the effects of process parameters. ANOVA results using FCD ( Face Centered Design ) for Al2O3/B4C hybrid composites are given in table 8. The results were determined using a confidence level of 95% or p value 0.05. ANOVA analysis shows that process parameters reinforcement( R), load (L), sliding speed (S) and sliding distance as the significant parameters as the p value for these factors is less than 0.05. Any factor or interaction which is non- significant is excluded from the analysis. ANOVA analysis shows that wear model is 'Significant' and lack of fit is 'Not—Significant' which is desired from model point of view. The adequate precision is to be greater than 4 for a good model. The value of adequate precision for this model is 57.026 assured that present model is adequate. Equations in term of coded factors which is used to determine the effect of selected variables on wear is given in equation (1).

The experimental and regression results were compared to determine the error percentage. The error percentage of \8% confirms that the developed model predicted accurately the dry sliding wear characteristics of the composite. The model was developed only for the range of parameters and range of wear rate obtained in this study. Within this framework, this model is found to be highly efficient and accurate.
Table 8. Analysis of variance for wear of Al7075/Al2O3/B4C composite.
| Source | Sum of squares | df | Mean square | F-value | p-value | |
|---|---|---|---|---|---|---|
| Model | 0.0004 | 11 | 0.0000 | 172.30 | <0.0001 | Significant |
| A-Sliding velocity | 1.389E-06 | 1 | 1.389E-06 | 6.69 | 0.0186 | Significant |
| B-Load | 0.0001 | 1 | 0.0001 | 305.72 | <0.0001 | Significant |
| C-sliding distance | 0.0001 | 1 | 0.0001 | 458.66 | <0.0001 | Significant |
| D-reinforcement | 0.0001 | 1 | 0.0001 | 674.37 | <0.0001 | Significant |
| AB | 1.000E-06 | 1 | 1.000E-06 | 4.82 | 0.0415 | Significant |
| AC | 8.123E-06 | 1 | 8.123E-06 | 39.13 | <0.0001 | Significant |
| AD | 1.322E-06 | 1 | 1.322E-06 | 6.37 | 0.0212 | Significant |
| BD | 0.0000 | 1 | 0.0000 | 71.40 | <0.0001 | Significant |
| CD | 1.000E-06 | 1 | 1.000E-06 | 4.82 | 0.0415 | Significant |
| A2 | 0.0000 | 1 | 0.0000 | 82.32 | <0.0001 | Significant |
| D2 | 3.636E-06 | 1 | 3.636E-06 | 17.51 | 0.0006 | Significant |
| Residual | 3.737E-06 | 18 | 2.076E-07 | |||
| Lack of Fit | 3.129E-06 | 13 | 2.407E-07 | 1.98 | 0.2328 | not significant |
| Pure Error | 6.083E-07 | 5 | 1.217E-07 | |||
| Cor Total | 0.0004 | 29 | ||||
| Std. Dev. | 0.0005 | R2 | 0.9906 | |||
| Mean | 0.0083 | Adjusted R2 | 0.9848 | |||
| C.V.% | 5.50 | Predicted R2 | 0.9750 | |||
| Adeq Precision | 57.0268 |
The graphs shown in figure 8 shows that there is normal distribution of ANOVA as all the residuals are inclined along the inclined line. The graph residuals versus predicted are shown in figure 9. The prediction made by the model and accuracy is plotted on x and y axis respectively. Positive residual values on y axis shows that prediction was too low whereas negative values means too high prediction. A scattered graph of residuals is considered to be ideal graph [43].

Figure 8. Normal plots for (a) AA 7075/Al2O3/B4C.
Download figure:
Standard image High-resolution image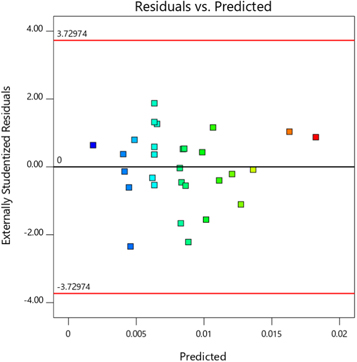
Figure 9. Residual vs predicted plots for (a) AA 7075/Al2O3/B4C.
Download figure:
Standard image High-resolution imageThe 3D interaction plot for wear rate were generated for all pairs of process parameters. The graphs shows that wear rate is decreased with increasing reinforcement at all levels of load (figure 10) and at all levels of sliding distance (figure 11). This can be attributed with micro hardness of the composites as the addition of reinforcement enhances hardness the material removal rate is reduced [43]. Thus the reinforcement addition plays a significant role in controlling the wear rate of the composite.
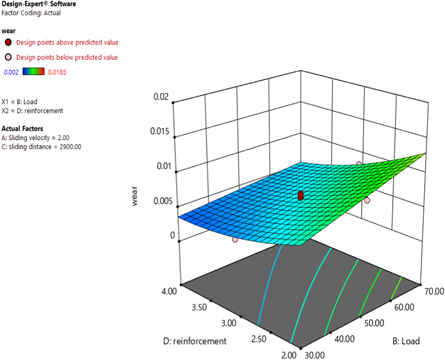
Figure 10. Surface plot of wear rate as a function of reinforcement and load for constant sliding velocity of 2 m s−1 and sliding distance of 2900 m.
Download figure:
Standard image High-resolution image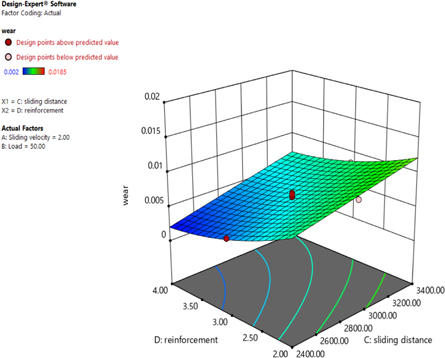
Figure 11. Surface plot of wear rate as a function of reinforcement and sliding distance for constant sliding velocity of 2 m s−1 and load 50 N.
Download figure:
Standard image High-resolution imageThe surface plot shows that wear rate first decreased and then increased with increased sliding speed at all levels of sliding distance (figure 12) and load (figure 13). This can be attributed due to increased contact time between the speicimen and disc at low velocity which causes high metal contact and high wear rate. When the speed is increased there is formation of oxide layer called mechanical mixed layer (MML) on the specimen surface due to material transfer. The same mechanism is observed by other researchers [33, 44]. This layer prevents adhesion layer caused due to sliding which caused the wear rate to decrease slightly initially. The surface plots have a curvature effect which shows that nonlinear variation of wear rate occurred due to the combined effect of various parameters. The significance of the combination of parameters influence the curvature of the graphs.
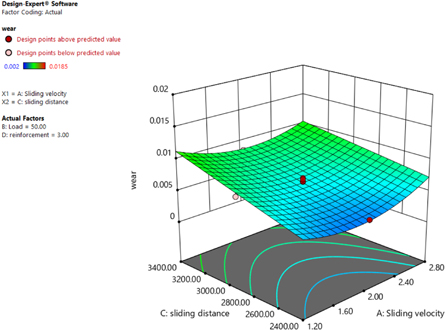
Figure 12. Surface plot of wear rate as a function of sliding distance sliding velocity for constant load of 50 N and reinforcement 3% wt.
Download figure:
Standard image High-resolution image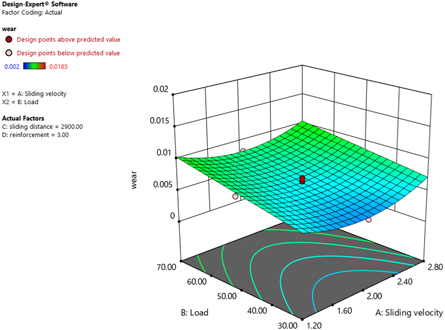
Figure 13. Surface plot of wear rate as a function of sliding distance sliding velocity for constant load of 50 N and reinforcement 3% wt.
Download figure:
Standard image High-resolution image
4. Conclusion
The conclusions from the present work are as follows.
- 1.The Al/Al2O3 metal matrix composites were fabricated successfully. The Taguchi method was applied to determine the effects of sliding speed, load, sliding distance and reinforcement ratio on the dry sliding wear behaviour of Al/Al2O3 metal matrix composites.
- 2.Taguchi orthogonal design method was suitable for sliding wear behaviour of Al/Al2O3 metal matrix composites. The higher the rate of reinforcement better is the ability to resist wear.
- 3.Composite with 12% wt reinforcement is chosen and reinforced with different weight percentage of B4C. The wear behaviour was analysed successfully using Response surface methodology (RSM), resulting in quadratic models.
- 4.The model developed for hybrid Al/Al2O3/B4C metal matrix composite for predicting the dry sliding wear behaviour performed well. The surface analysis shows that with increase in load, sliding velocity and sliding distance the wear rate increased. However with increase weight percentage of reinforcement ratio the wear rate decreases.
- 5.SEM images shows the wear tracks, abrasive grooves, particle pull out in the form of delamination and accumulated debris which takes place for the composites. The wear behaviour is verified by the SEM images.
- 6.The addition of to the Al2O3 reinforced composites has significantly reduced the wear of the composites.
Acknowledgments
The authors express their gratitude to Manipal University Jaipur for giving financial support to complete this project through the 'Seed Grant' [MUJ/REGR/1467/2018] . Authors would like to thank University Science Instrumentation Centre, University of Rajasthan Jaipur for their support in characterization. Special thanks to Mr. PNS Srinivas ,Guddlavaleru Engineering College, Andhra Pradesh and Anand International College, Jaipur, Rajasthan for providing necessary support in conducting experiments.