
Abstract
In this article, for the first time, the forming limit diagram (FLD) and mechanical properties of aluminum foil samples processed by the accumulative roll bonding (ARB) process have been studied experimentally. For this purpose, thin aluminum foils with a thickness of 200 microns have been produced using ARB in five passes at ambient temperature. By rising the number of ARB passes, the ultimate tensile strength (UTS) enhanced drastically, and at the end pass of ARB, it reached 393 MPa, about 5.9 times larger than the initial sample. Also, during the ARB process, the applied strain increased, and the thickness of the layers decreased, and the bonding quality between layers improved. SEM images of tensile fracture surface after five cycles showed the mechanism of fracture retained ductile. However, due to the unevenly applied strain, the dimples were drawn in different directions, and their depth and number were reduced relative to the raw material. The area under the FLDs, a criterion of formability, declined sharply after the first pass and then increased at a low rate until the final pass. The trend of similar changes of formability in the tensile (elongation) and Nakazima tests (FLDs) was reported. Responsibility for all mechanical properties and ductility changes is related to the ARB process's nature and the two dominant mechanisms of strain hardening and grain refinement.
Export citation and abstract BibTeX RIS

Original content from this work may be used under the terms of the Creative Commons Attribution 4.0 licence. Any further distribution of this work must maintain attribution to the author(s) and the title of the work, journal citation and DOI.
1. Introduction
Aluminum sheets with a thickness of less than  are introduced as foils. Foils have extensive applications in different fields such as caps, transformers, lithographic planes, capacitors, decorative products, electrical coils, thermal insulations, semi-rigid containers, etc. Aluminum has excellent resistance against environmental effects, and corrosive chemical factors, high electrical and heat conductivity, good mechanical properties, and being sparkling and non-toxic is preferred in industrial usages [1]. The first series's aluminum foil is a full barrier for light, oxygen, moisture, and bacteria. For this reason, it is widely used as food and pharmaceutical packaging. Strength and formability are vital features of any material for use in various applications. Aluminum alloys have substantial ductility but not high strength. Aluminum foil also requires both strength and ductility simultaneously due to its very low thickness (low load tolerance). According to the Hall-Patch relationship, one of the new methods to boost the strength of different metals and alloys is a grain-size reduction [2, 3]. To this end, microstructure improvement and grain refinement methods have received much attention in the last one or two decades. The severe plastic deformation (SPD) techniques can be used to produce ultrafine and even nanostructured materials. The SPD methods possess advantages over older methods, including low-cost equipment, producing larger samples, reducing costs, and eliminating environmental pollution [4, 5]. Saito et al invented the accumulative roll bonding (ARB) method used for sheet metals, and over the past two decades, many researchers have investigated this process [6–8]. The results of this research indicated that the ARB process is capable of producing a variety of metal composites with ceramic and metal reinforcement in cold and hot conditions [9]. This process increases the strain, improves the microstructure as well as increases strength, dislocation density [10], toughness [1, 11, 12], hardness, and even stiffness [8, 13]. Naseri et al reported that by applying eight passes of cross-ARB and ARB passes on pure aluminum, they reached a grain size of 155 nm and 380 nm for cross-accumulative roll bonded samples and accumulative roll bonded samples [14]. In 2008, Pirgazi et al showed that after 10 ARB passes, yield and tensile strengths enhanced from about 40 MPa to 282 MPa and from 90 MPa to 333 MPa, respectively [15]. Eizadjou et al also reported in their work that after 8 ARB passes, ultimate strength is enhanced from 87.95 MPa to 308 MPa. Also, They reported a grain size of 360 nm for pure aluminum was reached [16]. In another study [10], the finding exhibited that the amount of dislocation density in the ARB methods increased sharply. In this study, the dislocation density increased from 7 × 10¹² m−2 for primary 1050 Al alloy to above 2 × 10¹³ m−2 in the ninth pass of ARB [10]. The researchers showed that by applying the ARB process to pure commercial Al, they could increase the fracture toughness by more than 2.5 times higher from the prototype [1]. In another study, the results showed that by permeating ceramic particles in the interfaces of Al layers in the preparation steps of the ARB process, Young's modulus was improved via rising the imposed strain [13]. In the field of foil production by ARB, several studies have been carried out, which all are related to the study of mechanical properties, microstructure, and heat treatment. Mozaffari et al used nickel foil to produce Al/Ni composites [17]. One way to achieve a homogeneous structure in metal matrix composites produced by ARB is to use more layers with less thickness. Also, using more layers and lower thickness and post-annealing operations can create ceramic intermetallic with increased strength [18, 19]. Besides, Zhang et al studied the role of rolling heat treatment on a Ti/Al/Nb composite foil [20]. However, there is no study in literature investigating the mechanical properties and forming limit diagram (FLD) of aluminum foils.
The ductility of a sheet metal indicates its performance limitation without any defect in a forming operation. The forming process of sheet metals consists of a plastic deformation done on the sheet to produce an engineering component with an ideal shape [21]. Sheet metal forming processes have a tensile nature, and the amount of deformation is limited by the start of necking [22]. One of the well-known methods of measuring sheet formability is FLD [23]. A metal sheet's principal strains determine via measuring the local deformation of the part where necking or fracture occurs. Usually, before performing the tensile process of a sheet, the surface is circularly meshed. During forming operations, circular grids become oval under deformation. To calculate limit strains in the fail area, both the maximum principal strain in the large axis direction of the ellipse and the minimum principal strain in the small axis direction of the ellipse is considered major strain (ε1) and minor strain (ε2), respectively [24, 25]. Keeler and then Goodwin presented the forming limit diagram in the major strain-minor strain space for the first time [26]. Nakazima et al proposed a method, which can determine all limit strains for both right and left sides of the forming limit diagram by one test by specimens with similar length and different width and applying a tensile force with a ball-shaped punch [25–27]. Veenaas et al performed experiments based on downscaled Nakazima tests to determine a complete forming limit diagram for Al99.5 foil with a thickness range from  to
to  [28]. This method was based on the ISO 12004 standard, which was suitable for the micro range. By reviewing previous research on the ARB process, we could not find any research for investigating the FLD determination of foils produced by the ARB method. The present study is the first experimental work in this case. For this purpose, Al foil was utilized as raw specimens. The ARB process was also applied on five passes with a thickness reduction of 50%, and FLDs as the most applicable empirical criterion for examining the formability and mechanical properties were developed for different ARB passes.
2. Experimental procedure
2.1. Material and ARB process
The aluminum alloy used is AA 1050. The 200 μm thickness aluminum foil was cut to 300 * 80 mm. Figure 1 exhibits a schematic design of the ARB method. The first step is the surface preparation of the two sheets, which is essential to achieve a perfect rolling connection between the two foils. The prepared components were cleaned in equal dimensions with pure acetone and dried at room temperature. This is done to cleanse the surface contamination of the component and create a better connection. The foil's surface was then uniformly brushed using a metal brush with a thickness of 0.1 mm. Next, the two sheets' prepared surfaces were aligned and prevented the plates from slipping under the roller's high pressure during the process; the four corners were tightly closed with copper wire. They were then passed through rollers at ambient temperature without using a lubricant to prevent surface oxidation and make the bond stronger. The thickness reduction applied at each step is 50%; thus, the obtained sheet had a thickness equal to the thickness of the original layer. The sheet was then cut into two sections in the longitudinal direction, and the work process was repeated. Thus, thin aluminum specimens were produced by up to 5 rolling passes. According to equation (1), in each ARB pass with a thickness reduction of 50%, the effective strain rate is 0.8.


 t, N, and R, are equivalent strain, thickness before and after ARB, the number of ARB pass, and reduction thickness per pass.
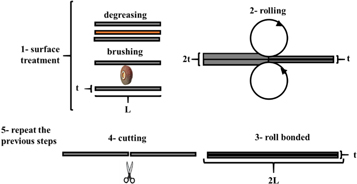
Figure 1. Schematic illustration of the ARB process.
Download figure:
Standard image High-resolution image2.2. Mechanical properties
A uniaxial tension test was performed to investigate the role of the applied strain during the ARB technique on the tensile strength of thin aluminum foils. Three specimens in rolling direction were provided based on the ASTM E8-E8M-13a standard [7]. Specimens' elongations were determined through length gauge measurement, before and after the test.
Vickers hardness tests were performed for assessing the microhardness of samples under a 2.5-gram load and a 15-s loading. Before completing the microhardness test, the specimens were prepared by cold mounting and grinding with 200 to 2000 sandpaper. Microhardness for each specimen was measured at three different random points and determined by calculating the mean value.
2.3. Fractography
Fracture surfaces of the uniaxial tension test were investigated to discuss the bonding quality and determine failure mode using the SEM VEGA TESCAN model.
2.4. Experimental determination of FLD for aluminum foils
ISO 12004 standard is provided to calculate FLDs of sheets with a thickness of 0.3 to 4 mm. Veenaas et al [28] introduced the scaled-down Nakazima test for estimating the FLD for aluminum foil with a thickness of less than 0.3 mm. In their research, three geometries for samples were introduced for obtaining positive and negative strains in a single test simultaneously. The schematic of the samples can be seen in figure 2. A wire-cut apparatus was used to make the corresponding samples' geometries. It is necessary to mesh the samples before forming. For this purpose, after specimen preparations, circular patterns were etched on the specimens by electrochemical etching. The image of the engraved samples for circular grid analysis is shown in figure 3.
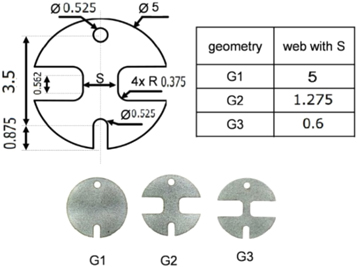
Figure 2. Geometry of the Nakazima test specimens.
Download figure:
Standard image High-resolution image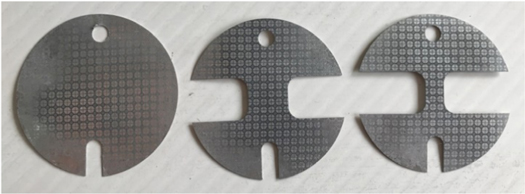
Figure 3. Circle grid etched on the specimens of the Nakazima test.
Download figure:
Standard image High-resolution imageFor conducting Nakazima's experimental test, the samples were first located on the die, and the blank holder was put on it. Then, the screws of the die were tightly tightened. After that, we put the setup in the press machine. The press machine had the arrangement to draw a graph between measured force and displacement. The ball-shaped punch was clamped by pin and screw on the press's moveable jaw; the die was put on the fixed jaw. At the final stage, after punch surface and specimen surface contiguity, the moveable jaw of the machine moves the punch towards the foil and makes the foil to be drawn. We stopped the test when the device monitor showed a force drop caused by the foil necking. Figure 4 shows the set of utilized die and machine.
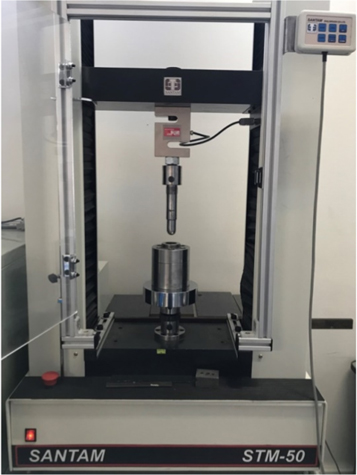
Figure 4. Experimental setup of Nakazima test on SANTAM testing machine.
Download figure:
Standard image High-resolution imageTo draw an FLD, limit strains need to be calculated. Therefore, the test continued until the necking time, and the operation stopped at this time. After forming, circular grids became elliptical. In the strain measurement process, three deformed circles were selected in the distance of at least 1.5 times the circle's diameter from the necking center. After measuring engineering strains percentage applying Mayler strip (figure 5), by using equations (2) and (3), the amounts of limit strains were calculated that 'a', 'b' are the ellipse's the major and the minor diameters after test respectively and 'd' introduce circle diameter before the test. The forming limit diagram was plotted by performing the above procedure for all the specimens and determining the limit strains for all specimens.


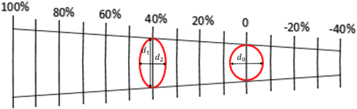
Figure 5. The Mayler strip used to measure the principal strains. Reprinted from [21] by permission from Springer Nature.
Download figure:
Standard image High-resolution image3. Results and discussion
3.1. Fractography
The dominant failure mechanism in metals with a face-centered cubic (FCC) structure is microcavity and dimples formation and then ductile fracture. More fully, the stages of formation of the soft fracture mechanism, respectively, are the formation of micropores in susceptible areas, their growth until they reach each other, creating cracks and extending the cracks in the direction of 45 degrees relative to the tensile direction [1, 29, 30]. In figure 6, the tensile fracture surface of the unprocessed aluminum sample is presented. As can be seen, the fracture cross-section shows micropores and dimples with their reunion, the growth of cracks, and failure that occurred. Thus, as noted, primary aluminum has a ductile fracture appearance. The existence of deep and equiaxed dimples indicates the typical ductile fracture occurrence in metals. This fracture mechanism was concluded in some other alloys under SPD [1, 29–31].
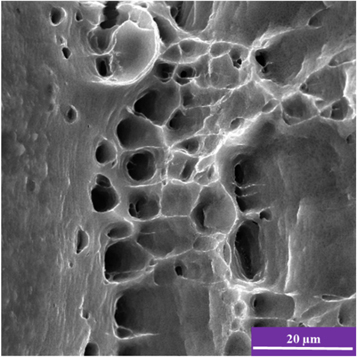
Figure 6. Tensile fracture surfaces for unprocessed Al foils.
Download figure:
Standard image High-resolution imageFigure 7 shows the cross-section of produced foils after different passes of ARB. The produced samples in 5 passes show the same balanced roughness and typical ductile fracture of the prototype. In the fifth pass, dimple depths are slightly reduced, indicating that the fracture mechanism changes to shear ductile fracture with continuing ARB passes. The right figures are the area of the left figure in zoom in more situations to close investigation.
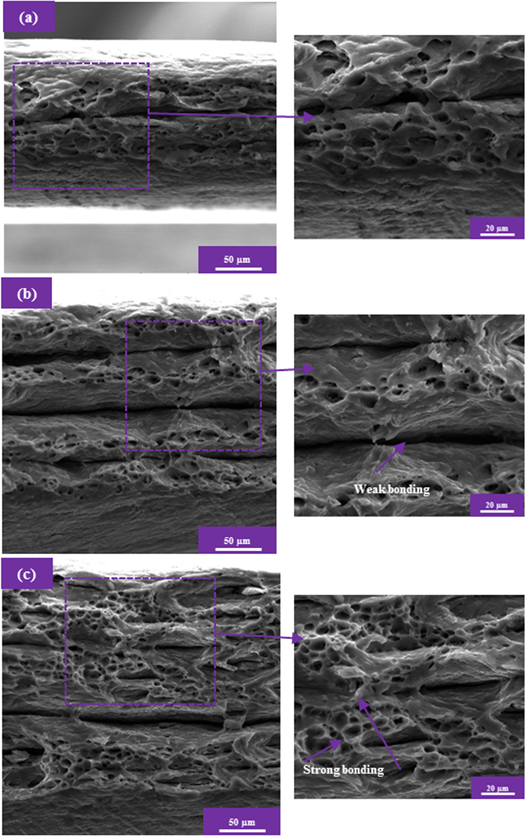
Figure 7. Tensile fracture surfaces for Al foils processed by ARB process: after (a) first, (b) third, and (c) fifth ARB pass (the right figures are the area of left figure in zoom in more).
Download figure:
Standard image High-resolution imageWith an increasing number of ARB passes, the bond quality between layers is improved, and the lamellar structure diminished after the last pass.
3.2. Mechanical properties
In figure 8, engineering stress-strain diagrams of Al foil samples after different ARB stages are demonstrated. According to figure 8, as rising the exerted strain, the strain stress curve's level increases, which indicates improved tensile strength, and via rising the ARB stages, the amount of tensile strength is enhanced continuously. The elongation at ultimate tensile strength (UTS) point and UTS in the various ARB cycles, extracted from the strain stress diagram, are presented in figure 9. According to figure 9, UTS increases by increasing ARB passes. It has been concluded that grain refinement and work hardening are two significant agents of strength variations of alloys under SPD processes [6, 7, 32]. After the first pass of ARB, specimen strength and elongation are sharply increased and decreased; respectively, the main influences are strain hardening and cold working. This mechanism is dominant in the first ARB passes, and at higher applied strains, its effect diminishes [33]. UTS increases with a milder slope in the next passes than at the initial pass, and the elongation rises with a lower rate, where grain refinement is the primary cause of these changes. Researchers have reported that at the high exerted strains in the SPD process, the misorientation of the dislocation boundaries reaches high angles, and grain refinement to the ultra-fine scale causes the increase in both strength and elongation, simultaneously [14, 34]. So, mechanical properties improvement results from the two mechanisms of strain hardening and microstructure modification. However, in the process's primary pass, the strain hardening mechanism, and the following passes, the grain boundaries reinforcement mechanism plays the dominant role. The maximum amount of the UTS in the fifth ARB pass is 393 MPa, which is more than 5.9 times higher than the initial state and, according to table 1, is the highest increase rate compared to other investigations. Elongation at break reaches 5.5% in the 5th pass, which is 1.7 times greater than after the first pass. The sharp decrease in the elongation rise is due to the substantial increase in the dislocation density and the accumulation of internal stresses, which promote the nucleation of cracks.
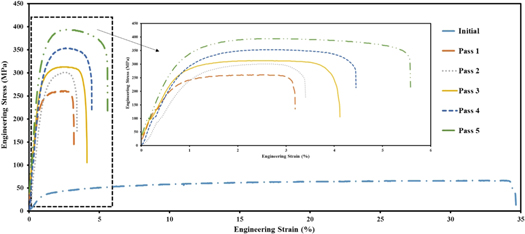
Figure 8. Stress-strain diagrams for aluminum foils processed by ARB.
Download figure:
Standard image High-resolution image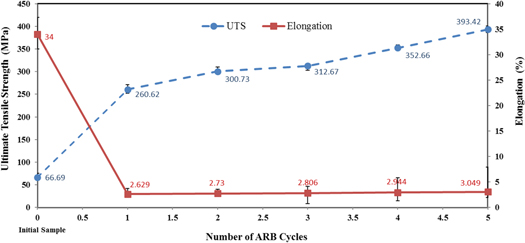
Figure 9. The variation of elongation and UTS during the tensile test for aluminum foils processed by ARB.
Download figure:
Standard image High-resolution imageTable 1. Results of the tensile strength of different samples during cycles of the ARB process.
| Material | Strength of initial samples (MPa) | Maximum Strength ARBed samples (MPa) | Increasing rate (%) | References |
|---|---|---|---|---|
| AA 1100 | 89 | 333 | 274 | [15] |
| Pure Al | 90 | 309 | 243 | [16] |
| AA 1050 | 65 | 228 | 251 | [1] |
| AA2024 | 188 | 450 | 139 | [34] |
| Cu | 213 | 445 | 109 | [35] |
| AA 6061 | 123 | 363 | 195 | [36] |
| Pure Al | 88 | 308 | 250 | [16] |
| Brass | 361 | 789 | 119 | [37] |
Figure 10 presents the variation in Vickers micro-hardness of aluminum foil samples during different ARB passes. According to the results, in the first ARB pass, the amount of micro-hardness increased sharply compared to the unprocessed aluminum foil, from 36 (VHN) to 53 (VHN), which indicates a 47% improvement. From the second to the fourth ARB pass, the micro-hardness increases with a relatively uniform slope with increasing ARB passes. As the number of ARB passes increase, the effect of work hardening reduces, and the role of grain refinement becomes more pronounced [11, 35]. This trend is decreasing in the fifth pass. The main reason is that the material reaches a steady-state density of dislocations. A dynamic balance between dislocation generation and annihilation due to dynamic recovery determines the steady-state density of dislocations during plastic deformation [38, 39]. The maximum amount of micro hardening in the fourth pass equals 81 Vickers, two times greater than that of the unprocessed aluminum.
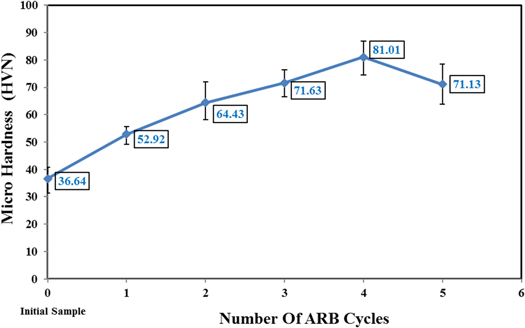
Figure 10. The variation of microhardness for aluminum foils processed by ARB process.
Download figure:
Standard image High-resolution image3.3. Forming limit diagram
After the fifth pass of ARB after deformation in the Nakazima test, aluminum foil specimens are given in figure 11. As can be seen, the Nakazima test was stopped before cracking and spreading, and local necking was considered as the criterion. For this purpose, as soon as a force drop was observed in the force-displacement diagram, the test was stopped. After reading the diameter of the created ellipses and strain calculations, the FLDs were drawn for different ARB passes. Figure 12 illustrates FLDs, obtained by the experimental Nakazima tests, for aluminum foils after different ARB passes. According to the FLDs, after the first ARB pass, the area below the FLD significantly decreases compared with the primary samples, indicating further restriction of the plasticity deformation. The leading cause of this decline of the FLD in the first pass is strain hardening, which decreases the movement of dislocations. Also, the decrease of the formability and ductility in figure 12 can be due to debonding in the interfaces. After the first pass, by rising the number of ARB passes, the area below FLD rises steadily and gradually. Finally, the best formability within the test program's scope was carried out at the end of the fifth ARB pass. Enhancing the FLDs by increasing the number of ARB cycles could be due to the diminution effect of strain hardening, grain boundaries breaking and the appearance of grain refinement, and other reasons such as the creation of stronger bonds and decreasing separation between Al layers [9].
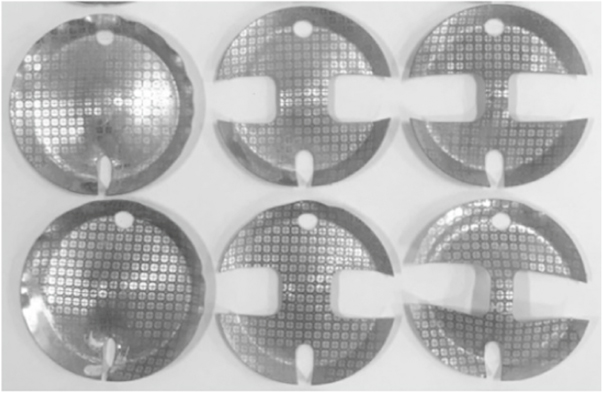
Figure 11. The aluminum foil specimens after deformation in the Nakazima test.
Download figure:
Standard image High-resolution image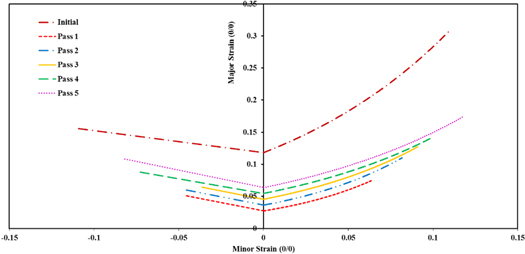
Figure 12. The FLDs for aluminum foils processed by ARB process.
Download figure:
Standard image High-resolution image
4. Conclusion
In this article, aluminum foil was processed by the ARB process up to 5 cycles, and for the first time, its formability was assessed experimentally using the Nakazima test. Also, the mechanical and fracture properties were investigated using tensile and microhardness tests and a scanning electron microscope (SEM). The following results were obtained:
- 1.SEM images of tensile fracture surfaces showed that the initial aluminum foil's fracture mechanism is an entirely ductile failure. With the increase of the applied strain, the number of micropores and dimples was reduced. They were stretched in different directions, indicating that the fracture mechanism changed from ductile to shear ductile.
- 2.As the number of ARB passes increased, the tensile strength increased steadily, and by the end of the fifth pass, the highest strength was obtained. The maximum ultimate tensile strength (UTS) obtained in the final pass was 393 MPa, which is approximately six times higher than of the initial foil sample, which is the highest increase rate compared to other investigations. After a sharp decrease in the first ARB cycle, the amount of elongation at fracture increased with increasing applied strain.
- 3.Microhardness changes in the aluminum foil layers were observed, almost similar to the tensile strength changes. After a sharp increase, it gradually increased until the fourth ARB pass and decreased in the fifth pass. The microhardness of the fourth pass was more than double that of the unprocessed aluminum foils.
- 4.Changes in mechanical properties in the ARB process mainly depend on the two mechanisms of strain hardening and microstructural improvement that significantly affect the improvement of mechanical properties in the initial and final ARB cycles, respectively. The effect of strain hardening decreases with increasing applied strain.
- 5.At the first ARB pass, the area below the FLD significantly decreased due to cold working compared to the unprocessed sample. Then, by raising the number of ARB passes, the area below the FLD increased steadily and gradually, and the best formability was reached at the end of the fifth ARB pass. Enhancing the FLDs by increasing the ARB cycles could be due to the diminution effect of strain hardening, grain boundaries breaking and the appearance of grain refinement, and other reasons such as creating stronger bonds and decreasing separation between Al layers.
Acknowledgments
This work has been supported by the Center for International Scientific Studies & Collaboration (CISSC), Ministry of Science Research and Technology.