
Abstract
Here, numerous oxygen-containing functional groups were grafted onto the surface of CNTs to improve their dispersibility in an electrolyte. The CNTs were characterized by FT-IR, Raman, XPS, FE-SEM, and TEM. The results revealed that the dispersibility of the functionalized CNTs in the composites was better than unfunctionalized CNTs. CNTs/Ni composites were deposited on a copper plate by pulsed electrodeposition and ultrasonic dispersion using an electrolytic bath with CNTs concentrations from 0 to 2 g l−1. The friction and wear behavior of the composite coatings were assessed using two different methods. In the first method, the coatings were scratched with a progressively higher load from 0–100 N, and the results demonstrate a 10 percent reduction in the coefficient of friction (COF) of the composite compared to pure nickel. The other method involved applying a constant load of 30 N, the COF and microscopic wear mechanism were investigated at different carbon nanotube contents, and the results confirmed that the COF of the composites was gradually reduced with the increase of carbon nanotube mass concentration, and the COF was only 0.343 when the carbon nanotube content was increased to 2 g l−1. According to the XRD results, increasing the CNTs contents changed the preferred growth orientation. Moreover, the FE-SEM images of the wear surface of the 1 g l−1 CNTs/Ni sample indicated that it had the best wear resistance and showed the smoothest wear trace without apparent cracks. The addition of CNTs enhanced the wear resistance of the nickel matrix due to the superior mechanical strength and lubricating effect of the CNTs. CNTs exposed to the matrix surface reduced the direct contact between the Ni matrix and the friction pair, acted as lubricants, and reduced the wear rate.
Export citation and abstract BibTeX RIS

Original content from this work may be used under the terms of the Creative Commons Attribution 4.0 licence. Any further distribution of this work must maintain attribution to the author(s) and the title of the work, journal citation and DOI.
1. Introduction
Carbon nanomaterials have had an unprecedented impact over the past three decades. Carbon nanotubes (CNTs) are one of the most typical unidimensional nanomaterials and have been the focus of research due to their many exciting physical and chemical properties since their discovery from a carbon arc discharge tube by Iijima in 1991 [1]. CNTs are small hollow tubes made of single or multilayered convoluted graphene sheets [1]. Due to their nearly perfect structure and strong sp2 hybridization, CNTs show a high strength with Young's modulus estimated to be between 300 GPa and 1500 GPa [2], which is comparable to diamond; thus, they are considered an ideal reinforcement for advanced composites. Because CNTs have good mechanical, electrical, and thermal properties, they can greatly improve the strength and toughness of a matrix material [3, 4].
Most previous studies of CNTs composites have focused on improving the mechanical and physical properties of polymers, ceramics, and metals [5]. As a CNTs-metal composite, CNTs/Ni composites have shown good mechanical properties, with Young's modulus, tensile strength, and fracture stress of 650 GPa, 2 GPa, and 780 MPa, respectively [6, 7]. CNTs/metal composites are mainly prepared by powder metallurgy and casting methods. Since Kuzumaki [8] first prepared CNTs/Al matrix composites by powder metallurgy, it has become the most mature and common method for preparing metal matrix composites. Casting has been used for the liquid fabrication of metal matrix composites in which the metal was first melted and then allowed to admix with a reinforcement phase. Kurnaz [9] prepared Mg-6 wt% Al alloys with different Cr and Ti contents using extrusion casting. The results showed that the addition of Ti and Cr effectively refined the grain size, and the friction coefficient of the alloys decreased upon increasing the Cr content. Composites with the best mechanical properties were obtained when the Ti content reached 0.2 wt%. Laha [10] prepared 10% CNTs/Al-23 wt% Si composites with cylindrical structures by plasma spraying. Despite these efforts, the dispersion of CNTs in matrixes has still not been improved due to the strong van der Waals forces and poor wettability.
During the preparation of composites, a high temperature may cause interfacial reactions between CNTs and the matrix, which can generate brittle phases. In addition, CNT agglomeration may decrease or insignificantly improve the performance of composites. Electrodeposition is one of the fastest and most effective methods for obtaining composite coatings, which involves two important steps. One is to deposit a metal on a cathode using a thin film of reinforcing phase as the cathode and a base metal plate as the anode [11, 12]. The other is to uniformly disperse one or more reinforcing phases in a composite solution containing a salt so that the reinforced phase and metal are co-deposited onto the cathode plate [13].
Fabrication by the electrodeposition of composite coatings containing inert nanoparticles has been developed to achieve various combinations of properties, such as improved wear and corrosion resistance, high-temperature inertness, and anti-oxidation properties [14–17]. Meng [18] used electrodeposition to prepare Cu/CNTs composites with a strength of 183 MPa and elongation of 30.9% at a CNTs content of 0.067 vol%. These values were far greater than those of MMCs prepared using common methods. In graphene oxide (rGO)-reinforced nickel matrix composites prepared by DC electrodeposition, a low volume fraction of graphene promoted the cathodic polarization potential and provided a large number of nucleation sites. The use of 2 ml of graphene/Ni produced a tensile strength of 864 MPa and a plastic elongation of 20.6%, which were 25% and 36% higher than those of pure nickel, respectively [19]. Electrodeposition can prevent the formation of brittle phases at high temperatures. Of course, electrodeposition can also have dispersion problems, but the dispersion of CNTs was improved by ultrasonication and stirring, and by adding dispersants to the solution.
Because they can improve the mechanical properties and their unique structure, CNTs can be used to fabricate composites and coatings with excellent friction properties [20]. CNTs offer better wear resistance than conventional materials due to their high hardness, low coefficient of friction, and lubricating properties [21]. Yet, due to their high surface energy, CNTs easily agglomerate, which prevents them from toughening composites and allows them to easily become a source of cracks, thus leading to a reduction in the mechanical properties and wear resistance of composites. If the surface of CNTs is suitably modified by grafting oxygen-containing functional groups, such as carboxyl and hydroxyl groups, they will electrostatically repel each other, which can help prevent their agglomeration and improve their dispersion. This also improves the wettability between the reinforcing phase and metal, which can improve their bonding strength. The dual effect of dispersion and improved wettability promoted the mechanical and frictional wear properties of composites.
Research on losses caused by friction and wear has recently attracted significant scientific attention in order to reduce worldwide energy consumption. According to literature, the addition of the CNTs can improve mechanical and wear properties [20] of nickel matrix composite coatings. Nickel matrix composites have high-temperature resistance, wear resistance, corrosion resistance, and excellent mechanical properties. CNTs have high strength, high specific modulus and very high chemical stability. Therefore, carbon nanotube nickel matrix composites have great application potential. CNT composite nickel is distinguished by its enhanced mechanical properties, making it a favorable candidate for tribological applications. However, there are very limited reports regarding the tribological mechanism of the CNT-strengthened nickel composite coatings. It is essential to understand the tribology of CNTs/Ni as it is highly used for many applications such as aerospace, military, petroleum, machinery, etc.
The analysis of the tribological properties of the samples enables us to predict the practical application of the manufactured composites. To use CNTs for technical applications, the mechanical properties and characteristics of friction and wear need to be investigated through the determination of the wettability between materials, the CNT content, the homogeneous dispersion conditions, and the proper manufacturing method. In this article, CNTs/Ni composites were prepared by functionalizing carbon nanotubes and then using the modified carbon nanotubes as a reinforcement phase. Their frictional wear behavior was investigated to explore the effect of carbon nanotubes on the wear mechanism, wear resistance, and friction coefficient of the CNTs/Ni composites.
2. Experimental procedures
2.1. Composite fabrication
Their high aspect ratio and high specific surface area allow CNTs to easily entangle and agglomerate, which accelerates their settling in an electrolyte. In addition, CNTs agglomerates are entrapped in the coating, which degrades its quality. Therefore, CNTs need to be functionalized prior to composite plating to achieve uniform distribution and improved surface wettability. As illustrated in figure 1, the surfaces of carbon nanotubes were functionalized with oxygen-containing functional groups such as hydroxyl and carboxyl groups. The functionalization of CNTs has been mentioned in many articles, but it was difficult to determine the best process, so several methods were combined in this article [8, 19, 22–26].
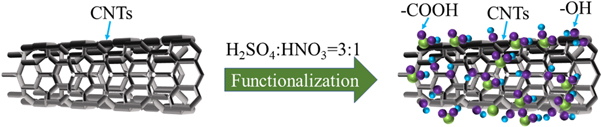
Figure 1. Diagram of the acidification process.
Download figure:
Standard image High-resolution imageThe CNTs used in this experiment were purchased from the Chengdu Organic Institute. By combining the approaches of various researchers, the CNTs were functionalized as follows: CNTs were added to a mixture of H2SO4 and HNO3 (3:1 volume ratio). After ultrasonication for 20 min, the slurry was placed for 5 h at 70 °C and then filtered and washed with distilled water until the pH reached 7. Finally, the CNTs were dried for 12 h at 80 °C.
The anode and cathode were a copper substrate covered with insulating tape and a nickel plate wrapped with gauze, respectively. Plating experiments were performed using a modified Watts solution, and the plating solution formulation is shown in table 1. The appearance of the composite prepared by pulsed electrodeposition is shown in figure 2. It can be seen that with the increase of carbon nanotube content, the color of the sample gradually darkens, and the roughness of the material increases.
Table 1. Plating bath composition (g l−1).
| Drug name | Chemical formula | Content |
|---|---|---|
| Nickel sulfamate | Ni(NH2SO3)2·4H2O | 350 |
| Nickel chloride | NiCl2·6H2O | 15 |
| Boric acid | H3BO3 | 30 |
| Hydroxypropyl cellulose (HPC) | Polymer | 0.02 |
| Sodium dodecyl sulfate (SDS) | NaC12H25SO4 | 0.05 |
| Functionalized Carbon Nanotubes | 0 ∼ 2.0 | |
| Current density | 1 A dm−2 |
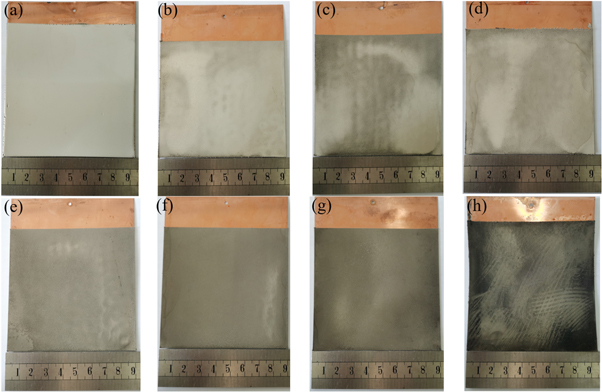
Figure 2. Appearance of the samples with different CNTs: (a) Pure Ni; (b) 0.1 g l−1 CNTs/Ni; (c) 0.2 g l−1 CNTs/Ni; (d) 0.3 g l−1 CNTs/Ni; (e) 0.4 g l−1 CNTs/Ni; (f) 0.5 g l−1 CNTs/Ni; (g) 1 g l−1 CNTs/Ni; (h) 2 g l−1 CNTs/Ni.
Download figure:
Standard image High-resolution image2.2. Material test methods
The morphology of the CNTs was analyzed by field-emission scanning electron microscopy (FE-SEM, Nova NANOSEM 450). Raman spectroscopy is sensitive to shifts in the symmetry of the carbon structure and therefore is an excellent tool for characterizing the structure of CNTs. In this work, a Raman spectrometer (LabRAM HR Evolution; laser wavelength = 532 nm) manufactured by HORIBA Jobin Yvon, France, was used. A Fourier-transform infrared (FTIR) spectrometer was used to analyze changes in the surface chemical bonds and the structure of CNTs in the frequency range of 500–4000 cm−1. X-ray photoelectron spectroscopy (XPS, PHI5000 Versa probe-II) was adopted to investigate the bonding characteristics of CNTs, and all XPS peaks were calibrated according to the C 1s peak (284.6 eV). Transmission electron microscopy (TEM, FEI Talos F200X, 200 kV) was used to characterize the distribution and interface between CNTs and Ni matrix. The contour arithmetic means difference (Ra) was further deliberated using Atomic Force Microscopy (AFM) (Bruker Dimension ICON) in the spot size area of 10 μm × 10 μm. The microhardness tester was produced by Shanghai R&R Optical Machine Technology Co, Ltd., model MC010. The samples were inlaid with polymer before being tested and then polished. Each sample was tested three times and more to reduce the experimental error. The preferred orientation was characterized by an x-ray diffractometer (XRD, EMPYREAN) using Cu Kα radiation with a wavelength of 1.78901 Å. The scanning angle (2θ) range was from 20°–120°.
2.3. Tribological tests
Friction tests were completed at the State Key Laboratory of Friction and Wear in Lanzhou, China. The test environmental conditions included ambient temperature (298 K) and relative humidity of about 40%. The scratches were tested in two different ways. The first involved scratching with a progressively increasing load (Method#1). The working principle was as follows: a load was continuously applied to the scratching needle by the automatic loading mechanism while moving the specimen so that the scratching needle crosses the coating surface; next, information on the acoustic emission (AE) signal, the changes in load and friction during the scratching process were obtained by means of sensors. To evaluate the friction coefficient of the composites, the UMT-2MT needle disc scratch instrument produced by CETE Company (USA) was used. The load range was set from 0–100 N, and loading rate was 100 N min−1, and the stroke length was 5 mm. Figure 3 shows the schematic diagram of the test machine used for Method #1. Where y is the glide direction, the x-direction was perpendicular to the y-direction, and z is the scratch depth. As the load Fn was increased in the z-direction, the front of the indenter and the edges of the coating were subjected to compressive stress (Fn ) and tangential friction force (Ff ), respectively. When the stress in the coating reached a critical value, radial and transverse cracks formed, and thus parts of the coating peeled off directly. Eventually, the internal stresses were released.
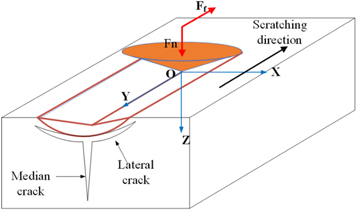
Figure 3. Schematic diagram of the stress distribution in the indenter area of the scratching device.
Download figure:
Standard image High-resolution imageIn the second type of test, the samples were subjected to a constant load (Method #2). In the absence of lubricating pairs, a silicon nitride ceramic indenter was used as a friction pair with a radius of 3 mm. The friction tests used equipment developed by the Lanzhou State Key Laboratory. Before starting the experiment, the samples were cut into 10 mm × 10 mm squares, inlaid with polymer, then polished with diamond abrasive paste, ultrasonicated for 15 min, and dried with a hairdryer. The experiment was tested three times and more. Table 2 shows the detailed parameters. The wear surfaces of the samples were investigated by FESEM and EDS.
Table 2. Friction and wear test parameters.
| Method | Normal load (N) | Load rate (N min−1) | Speed (m min−1) | Sliding distance (m) |
|---|---|---|---|---|
| #1 | 0–100 | 100 | — | 5 × 10⁻³ |
| #2 | 30 | — | 10 | 31.65 |
3. Results and discussion
3.1. Introductory study for the functionalization of CNTs
3.1.1. Structural characterization of pristine and surface-treated CNTs
To improve the dispersity of CNTs in electroplating liquid, the CNTs were acid treated. Oxidation forms a variety of functional groups such as carboxylic (–COOH), carbonyl (–C=O), and hydroxyl (–OH) groups on the surface of CNTs. In the plating bath, nickel ions were adsorbed on the surfaces of CNTs and surrounded the carboxylic groups on the surface of the CNTs to stabilize the system [27]. These functional groups promoted the chemical reactivity between CNTs and the matrix [28], which could enhance the dispersibility of CNTs in solution and allow them to be directly used for composite fabrication.
Figure 4(a) shows the FT-IR spectra of pristine carbon nanotubes (P-CNTs) and surface-treated carbon nanotubes (ST-CNTs). Different functional groups formed on the CNTs surface after functionalization. The peaks between 2800 cm−1 and 3500 cm−1 were characteristic of C–H and O–H bonds. The broad peak at approximately 3445 cm−1 was associated with the stretching vibration of O–H bonds in the carboxyl groups. The peak at 2800 cm−1 to 2900 cm−1 was attributed to the C–H stretching vibration. By comparing the P-CNTs and ST-CNTs spectra, the absorption peak intensity of the latter was higher due to the oxidation of amorphous carbon in the carbon nanotubes by H2SO4. The peak at 1641 cm−1 was attributed to carbonyl groups. The peak at 1394 cm−1 was related to C–O bonds [29], and the peaks at 1028 cm−1 to 1165 cm−1 were related to C–O–C bonds. These peaks appeared due to the oxidation of the amorphous carbon in the CNTs by H2SO4, which changed the bonding pattern. Since the electric dipoles in C–C bonds were extremely weak, no peaks associated with these bonds were observed [30]. The FTIR results show that acid treatment did not drastically change the functional groups in the CNTs, but the amorphous carbon and carbon nanoparticles in the CNTs were oxidized. Acid treatment removed impurities and graft carboxyl, hydroxyl, and other groups onto the surfaces of the CNTs, which further improved their dispersion in solution [31].
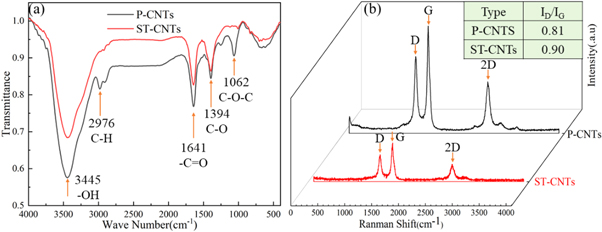
Figure 4. (a) FTIR spectra and (b) Raman spectra of P-CNTs and ST-CNTs.
Download figure:
Standard image High-resolution imageBecause the Raman spectra of CNTs were highly similar to those of graphite [32], Raman spectroscopy was used to characterize CNTs. Two characteristic peaks at approximately 1335 cm−1 and 1559 cm−1 are called the D and G peaks, respectively. The D band is related to structural defects including vacancies, impurities, and disorder, while the G band corresponds to the in-plane stretching vibrations of sp2-hybridized carbon. The relative intensity of the D and G peaks (ID/IG) is related to the defect and disorder degree of CNTs. A higher value of ID/IG represents more structural defects in the carbon atomic crystal. A higher D peak intensity implies the presence of defects at the edges of carbon nanotubes, which results in decreased symmetry. As illustrated in figure 4(b), the D and G peaks of CNTs are around 1330 cm−1 and 1575 cm−1, respectively. By comparing P-CNTs with ST-CNTs, it can be seen that the ID/IG values after treatment were higher than before treatment. In conclusion, the oxidation of carbon nanotubes broke some of their bonds. These results also indicated the presence of defects inserted in the nanotube structure, such as functional groups.
XPS was used to determine the contents and chemical states of oxygen-containing functional groups. The XPS survey spectra of P-CNTs and ST-CNTs are shown in figures 5(a) and (b). As shown in figure 5, in terms of the contents of chemical bonds, the concentration ratio of O=C increased because nitrate ions (NO3 +) attacked and broke some of the C=C bonds. Functional groups such as hydroxyl, carboxylic, and carbonyl groups were formed on the tube walls of CNTs. This reaction produced defects on the surface of CNTs and even fractured long CNTs into shorter ones [33]. Collectively, the XPS results are consistent with the FT-IR and Raman spectroscopy results. It was concluded that the CNTs were purified by acid treatment, and the surfaces and edges of the CNTs were modified by a large number of oxygen-containing functional groups. This improved the chemical activity and dispersibility of CNTs in aqueous solutions.
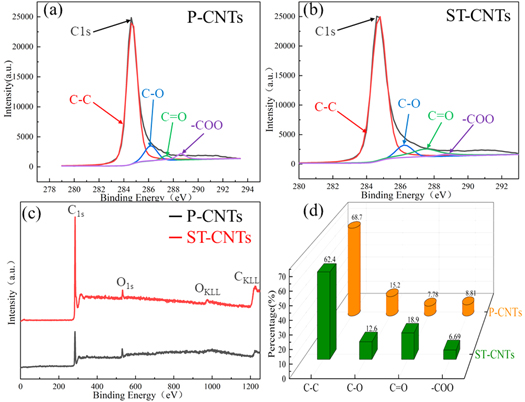
Figure 5. XPS spectra of (a) P-CNTs and (b) ST-CNTs: (c) full spectra; (d) chemical bond contents.
Download figure:
Standard image High-resolution image3.1.2. Influence of pretreatment on the morphology of CNTs
Figure 6 shows images of the microstructure of P-CNTs and ST-CNTs. As shown in figure 6(a), most of the CNTs were entangled with each other, which negatively impacted the dispersion of carbon nanotubes in the plating solution. By comparing figures 6(d) to (a), it can be seen that the ST-CNTs were more stretched than P-CNTs, and the agglomeration of CNTs was decreased. TEM was used to further study the effect of purification of the CNTs. Figures 6(b) and (c) and (e) and (f) show TEM images of P-CNTs and ST-CNTs, respectively. As shown in figures 6(b) and (c), the surfaces of 18-walled P-CNTs with a diameter of 20–40 nm were covered with large amounts of amorphous carbon, confirming that the sample was multi-walled carbon nanotubes. Nevertheless, the surfaces of the ST-CNTs were smooth in figures 6(e) and (f). Because most of the impurities were removed during the pretreatment process, there were no obvious amorphous carbon, carbon nanoparticles, catalysts, or other impurities on the CNTs surface. In addition, the ends of the CNTs were opened.
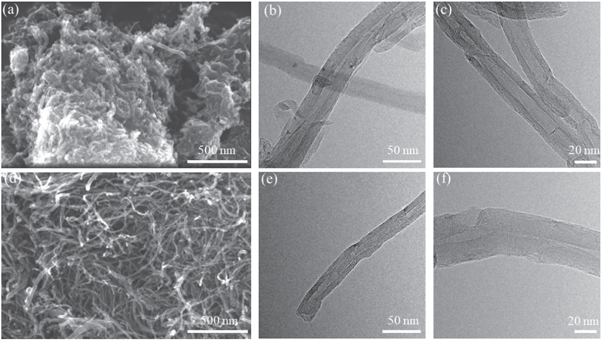
Figure 6. FE-SEM images of P-CNTs (a) and ST-CNTs (d). TEM images of P-CNTs (b) and (c) and ST-CNTs (e) and (f).
Download figure:
Standard image High-resolution imageThe pretreatment process removed the impurities from the surface of CNTs, giving them a clean surface, shortening the carbon tube length, and introducing defects, such as vacancies. However, due to the large specific surface area of CNTs, it was also difficult to avoid mutual entanglement. Consequently, surfactant was added to the plating solution, and it was stirred.
3.2. Coating structure and orientation
3.2.1. Surface roughness and hardness of composite materials
The surface roughness for samples was further investigated with a three-dimensional AFM image, as shown in figures 7(a)–(e). Here, a specific spot (10 μm × 10 μm) was identified during the analysis to provide accurate and consistent analysis to study the surface roughness analysis. The figures revealed that the 0.3 g l−1 CNTs/Ni composite coating has a more relatively smooth and compact surface morphology than another coating. A dimpled appearance was observed on the 2 g l−1 CNTs/Ni surface, possibly due to the aggregation of the CNTs. Furthermore, the average roughness (Ra) of the (0.3 g l−1–2 g l−1) CNTs/Ni coatings were evaluated to be about 129 nm, 223 nm, 318 nm, 473 nm, and 703nm, respectively. It can be concluded that the CNTs in the Ni matrix increased the surface roughness, and the roughness of the composite surface increased with the increase of carbon tube content.
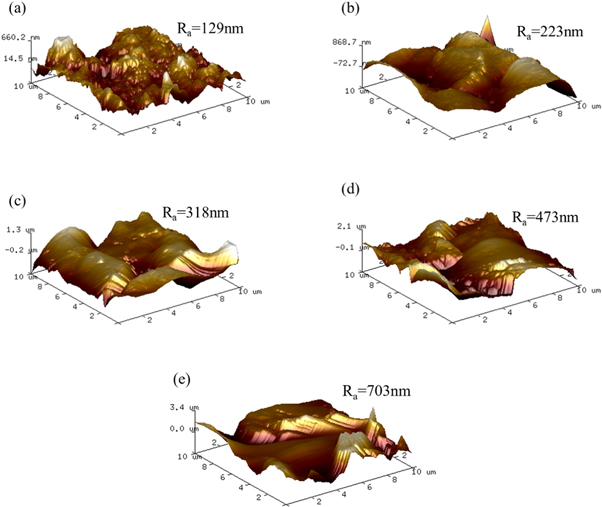
Figure 7. AFM three-dimensional images of composites: (a) 0.3 g l−1 CNTs/Ni; (b) 0.4 g l−1 CNTs/Ni; (c) 0.5 g l−1 CNTs/Ni; (d) 1 g l−1 CNTs/Ni; (e) 2 g l−1 CNTs/Ni.
Download figure:
Standard image High-resolution imageFigure 8 shows the microhardness of the composite at different concentrations of CNTs in the plating solution. As shown in the figure, the hardness value of pure nickel material was 99.9 Hv, and the hardness of the plated layer increases with the increase of carbon tube concentration when the concentration of CNTs is relatively low. The hardness reached a maximum value of 260.21 Hv when carbon nanotubes were added at 1 g l−1. Maintained adding CNTs, and the hardness started to drop. The decrease in hardness value when the carbon nanotube content stands 2 g/l was because too high CNTs caused entanglement, and agglomerates of carbon nanotubes lead to defects when deposited into the composite plating, thus reducing the hardness of the plated layer.
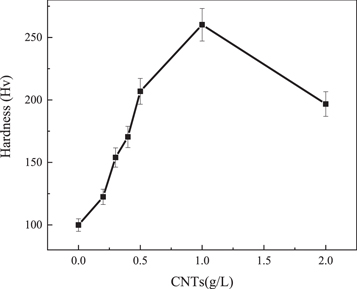
Figure 8. Microhardness of composites with different CNT contents.
Download figure:
Standard image High-resolution image3.2.2. Characterization of deposited coatings
In this experiment, to further improve the dispersion of CNTs via the cavitation effect of ultrasound, CNTs/Ni composites were prepared using ultrasonication and stirring. To investigate the effect of carbon nanotubes on the nucleation and growth of nickel, the CNTs/Ni composite surface was analyzed by FE-SEM, as shown in figures 9(a) and (b). The shape of the middle part of the sample revealed step-like growth, but, at the edges, nickel grew into a spherical shape. Many defects appeared on the exterior surface of CNTs such as vacancies [34]. Due to the tip effect of CNTs and the existence of defects on their surface, nickel ions were selectively adsorbed at the tips or defects. The resistance after adsorption was lower, so the nickel ions were more likely to accept electrons and be deposited. In other words, the tips and defects were higher in energy and in an active state than other sites, which was more conducive to the adsorption and reduction of nickel ions. This resulted in the spherical particles.
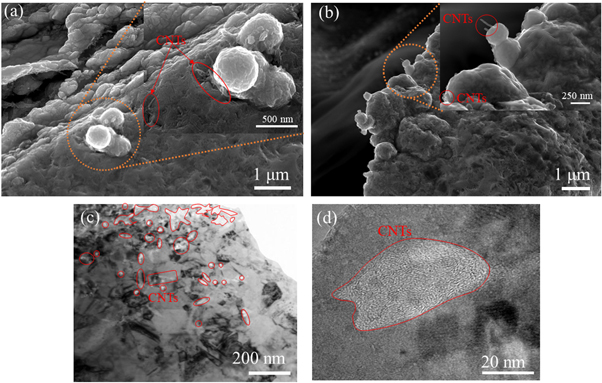
Figure 9. The morphologies and microstructures of CNTs/Ni composite coatings: (a), (b) FE-SEM images; (c), (d) TEM images. The orange circle indicates the enlarged area, and the inset in (b) shows a partial enlargement of the corresponding region. The red circles represent CNTs.
Download figure:
Standard image High-resolution imageTo further explore the dispersion of CNTs in CNTs/Ni composites and the bonding of CNTs to the substrate interface, TEM was used to investigate the CNTs/Ni composites. As presented in figure 9(c), the CNTs were in the coatings and were uniformly dispersed due to ultrasonication and stirring. At the same time, small-scale nickel crystals were observed. Furthermore, the addition of CNTs refined the grain size. The cross-sectional HRTEM image of the CNTs is shown in figure 9(d). It is clear from the image that the CNTs were approximately 20–40 nm in diameter had a circular texture, which is typical of multi-walled carbon nanotubes. Due to the surface treatment of CNTs, the wettability and tight bonding at the interface between CNTs and Ni were substantially improved, which promoted the overall performance of the composites.
3.2.3. XRD characterization
Figure 10 shows the XRD patterns of the CNTs/Ni composites and pure Ni prepared by electrodeposition. From the XRD patterns (figure 10(a)), the diffraction peaks of Ni (JPCDS card No. 04-0850), it can be seen that the CNTs changed the preferential growth orientation of nickel particles from (200) to (111). Furthermore, the peak intensity gradually decreased as the CNTs content increased. Diffraction peaks of CNTs were not detected due to their low loading. From the partially-enlarged details (figure 10(b)), the half-peak width of the CNTs/Ni composites increased, which was related to grain refinement and internal stress. In addition, the introduction of CNTs caused the splitting of the nickel diffraction peak (222) in contrast to pure nickel, which was related to the generation of twin crystals. According to Qu's work [35], suspended carbon nanoparticles adsorbed ions in the electrolyte, such as Ni2+. When carbon nanoparticles were wrapped into the nickel-based growth center, the adsorbed ions freed the growth center from the cation in the electrolyte and further prevented the growth of nickel particles [36]. In this case, the probability of nucleation on the (220), (311), and (222) planes increased so that their peak intensities were higher than those of pure Ni.

Figure 10. XRD patterns of composites with different CNTs contents (a) and their magnified diagram (b).
Download figure:
Standard image High-resolution imageFinally, relative texture coefficient (RTC) of each diffraction crystal plane (h k l) of the CNTs/Ni composites and pure nickel were calculated by equations (1) and (2).


where Is and Ip are the diffraction peak intensity of the CNTs/Ni composites and the non-deformed standard nickel powder, respectively. The correlated RTC(h k l) values are listed in table 3. Furthermore, the pure nickel coating had a strong [200] texture, and RTC(200) was calculated to be about 74.5%. However, RTC(200) of Ni/CNTs composites were lower than those of pure Ni. Moreover, upon increasing the CNTs concentration, the RTC (111) and RTC (200) of Ni/CNTs composites gradually decreased. This indicated that the CNTs played an important role during the co-deposition process.
Table 3. Calculated RTC values of the CNTs/Ni composites.
| CNT concentration (g l−1) | RTC (111) | RTC(200) | RTC(220) | RTC(311) | RTC(222) |
|---|---|---|---|---|---|
| 0 | 18.47 | 74.5 | 1.88 | 3.91 | 1.02 |
| 0.2 | 16.9 | 20.96 | 19.94 | 23.58 | 18.6 |
| 0.3 | 18.07 | 18.07 | 20.96 | 23.21 | 19.69 |
| 0.4 | 17.5 | 18.2 | 20.47 | 23.18 | 20.65 |
| 0.5 | 28.37 | 22.98 | 20.14 | 15.18 | 13.33 |
| 1g | 28.8 | 21.88 | 23.03 | 11.09 | 15.20 |
| 2g | 25.6 | 20.2 | 19.7 | 18.2 | 16.4 |
3.3. Tribological properties
3.3.1. Scratch experiments
The scratch test method has been used for a long time and is now capable of making quantitative measurements. The scratch test is based on the observation of the layer failures induced by a loaded indenter that scratches the surface of a sample. To evaluate their frictional behaviors, changes in the coefficient of friction (COF) of 0 g l−1 CNTs/Ni and 0.2 g/l CNTs/Ni are shown in figure 11(a). When a load was applied, the COF quickly reached a peak, and then the indenter began to slide from the maximum static friction. At this point, the COF represented kinetic friction, which gradually decreased to a minimum as the load was increased to 20 N. In the subsequent process, the COF gradually increased until it was essentially constant. Throughout the loading process, the curves of the CNTs/Ni composites remained below the pure nickel curve (figure 11(a)). At the end of loading, the COF were 0.5 and 0.45 for pure nickel and composite materials, respectively. Composite's COF was lowered by 10 percent compared to pure nickel, which revealed that the friction performance of the materials was improved.
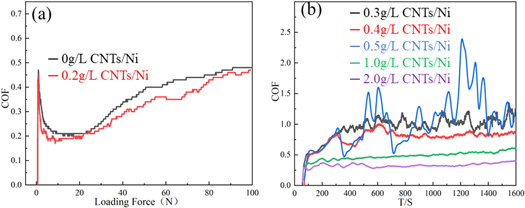
Figure 11. (a) COF with continuous load; (b) COF with constant load.
Download figure:
Standard image High-resolution imageFigures 12 and 13 show that the actual length of the scratch was approximately 5 mm, and the depth of the scratch was shallow without cracks at the initial phase of the scratch. As the load Fn increased, a large compressive stress was created at the top of the head, and then the scratch depth and width increased as the load increased. As Fn increased, the deformation become prominent, resulting in a sharp increase in the local stress and energy [37]. When the stress concentration exceeded the critical stress value when the load reached 100 N, the internal phase interface or crystals released the internal stress, which produced a large radial crack, as shown in figures 12(d) and 13(d).
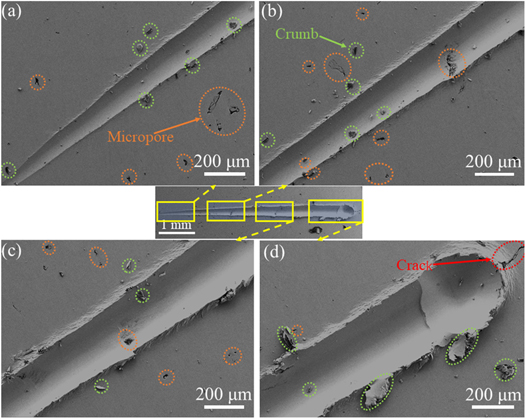
Figure 12. The 0 g l−1 CNTs/Ni microstructure induced by a tip with a continuous load. The yellow box indicates the enlarged area, and the arrow is the enlarged image. The orange, green, and red circles represent micropores, crumbs, and cracks, respectively.
Download figure:
Standard image High-resolution image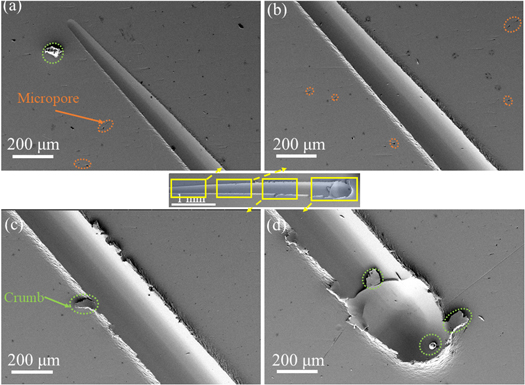
Figure 13. The 0.2 g/l CNTs/Ni microstructure induced by a tip with a continuous load. The yellow box indicates the enlarged area, and the arrow is the enlarged image. The orange and green represent micropores and crumbs, respectively.
Download figure:
Standard image High-resolution imageFor pure nickel, the partial magnification shows that the sample surface had a large number of micropores (figures 12(a)–(c)) as well as residual nickel metal debris with radial cracks at the maximum load (figure 12(d)). In contrast, after the introduction of CNTs, crumbs of metallic nickel accumulated at the edges of the scratch (figures 13(a)–(c)), and no microcracks appeared at the head of the scratch (figure 13(d)). The presence of a huge number of micropores may be one of the reasons for the reduced frictional properties of pure nickel.
3.3.2. Friction and wear experiment
Figure 11(b) shows the trend of COF with different CNT contents. 0.3 g l−1 CNTs/Ni, 0.4 g l−1 CNTs/Ni, and 0.5 g l−1 CNTs/Ni were unstable and fluctuated greatly over time, which may have been caused by the hierarchical structure generated from the deposition conditions. Moreover, Mohamed [38] et al argue that it was observed that the COF oscillates significantly with time owing to the stick-slip phenomenon during the sliding motion. The COF-T curves of 1 g l−1 CNTs/Ni and 2 g l−1 CNTs/Ni samples were quite similar, with no large jump after reaching the maximum value and remaining relatively stable thereafter. Due to the higher CNTs enhancing the self-lubricating layer formation on the rubbing surfaces, the COF of 1 g l−1 CNTs/Ni and 2 g l−1 CNTs/Ni composite had a slight fluctuation of the friction behavior. Table 4 shows the average friction coefficient of the samples. It can be clearly observed (table 4) that there was a decrease in COF when carbon nanotube mass concentration was increased from 0.3 g l−1–2 g l−1, and the COF was only 0.343 when the carbon nanotube content was increased to 2 g l−1. It can be seen that CNTs improved the friction wear resistance of the CNTs/Ni composites. When there were fewer CNTs in the Ni matrix, friction mainly occurred between the Ni matrix and friction pair, resulting in a higher COF. As the CNT content increased, the second phase of the surface increased, which reduced the coefficient of friction. The results showed that the wear resistance was closely related to the CNT content in the CNTs/Ni composites. Due to the formation of a carbon film on the wear surface, the self-lubricating effect of the carbon film decreased the friction coefficient of the composites, which is consistent with Choi's [39] work on Al-CNTs composites.
Table 4. Average friction coefficient of the samples.
| CNTs (g l−1) | Average COF |
|---|---|
| 0.3 | 1.064 |
| 0.4 | 0.798 |
| 0.5 | 1.083 |
| 1 | 0.497 |
| 2 | 0.343 |
To further investigate the wear mechanism, SEM characterization was performed. Figures 14 and 15 show the surface after 30 min wear at a constant load of 30 N and at 10m min−1 sliding speeds. Figure 14 shows FE-SEM images of the tribometer tracks of the 0.5 g l−1 CNTs/Ni composites. As shown in figure 14(a), stress was concentrated on the composite surface, producing microcracks and plastic deformation. The specimen presented the coarse worn surface, and it can be observed that spalling pits and peeling are adhesive wear characteristics [40]. As the wear time increased, peeled particles (figures 14(b)–(d)) were crushed and appeared at the wear interface, giving rise to distinct furrows on the wear surface. However, most of the frictional wear area remained as smooth furrows (figure 14(a)), despite the presence of sheet debris. Since the content of CNTs was low, the surface peeling was more severe during the wear process, cracks were formed, and severe plastic deformation occurred on the grinding surface (figure 14(c)). The area of plastic deformation of the surface visible in the figure was mainly the shell layer formed by the tearing and flaking of the nickel matrix during the friction process. Meanwhile, it can be seen from figures 14(b) and (d) that the scratches were deeper. There were more abrasive chips, and no CNTs were observed to be distributed on the sample surface, so only a tiny amount of carbon-based lubricating film was formed during the friction process, and the specimen was worn drastically. The wear mechanism was mainly manifested as abrasive wear and delamination wear.
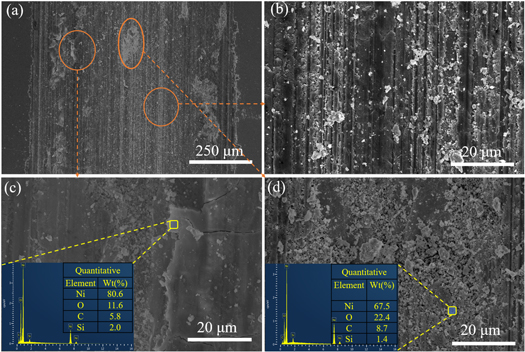
Figure 14. FE-SEM morphologies of the wear tracks and EDS analysis at different regions of the 0.5 g l−1 CNTs/Ni composites. The orange circle indicates the enlarged area, and the arrow is the enlarged image. The yellow rectangle is the point where the energy spectrum was obtained, and the insets in c and d are the corresponding EDS diagrams.
Download figure:
Standard image High-resolution image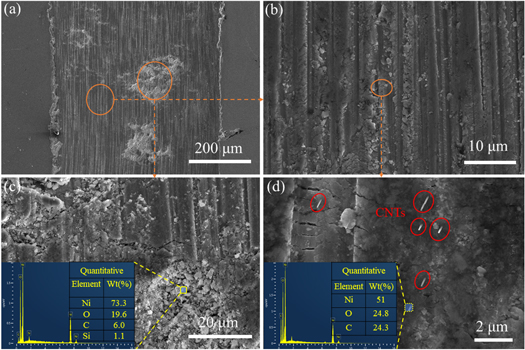
Figure 15. FE-SEM morphologies of the wear tracks and EDS analysis at different regions of the 1 g l−1 CNTs/Ni composites. The orange circle indicates the enlarged area, and the arrow is the enlarged image. The yellow rectangle is the point where the energy spectrum was obtained, and the insets in (c) and (d) are the corresponding EDS diagrams. The CNTs are inside the red circle.
Download figure:
Standard image High-resolution image
As shown in figure 15, the corresponding FE-SEM image (figure 15(a)) showed a small-width track with many worn metallic particles, which was pushed down under shear and smeared onto the contact surface to form a thick and continuous carbon film that reduced the friction. Exposed CNTs are shown in figure 15(d). One edge of these CNTs was deeply embedded in the nickel-based metal. In contrast, the other ends were exposed outside the nickel-based metal with a maximum diameter significantly smaller than the middle part, which was related to the loading, which ground most carbon nanotube into pieces and even broke some of them. The FE-SEM images (figures 15(b) and (c)) show that both surfaces produce large parallel furrows, mainly because abrasive dust was embedded in the sample surface, suggesting the occurrence of abrasive wear in the composite. At a low CNTs co-deposition, the surface roughness caused micro-contact between the ball and substrate, which caused wear on the asperities. However, increasing the CNTs content in the deposited coating resulted in both grain refinement and improved friction, which decreased the real contact area.
Judging from the abrasion's appearance, both 0.5 g l−1 CNTs/Ni and 1 g l−1 CNTs/Ni mainly underwent stick wear and abrasive wear, but the details were slightly different. With the increase of CNTs content, compared with the 0.5 g l−1 CNTs-Ni sample, the worn surface of the 1 g l−1 CNTs-Ni sample became smooth and delicate, and the texture was directional. The spalling layer was not found, indicating that the content of CNTs was an essential factor affecting the lubrication performance of the composites. The carbon-based lubricating film formed during the friction process of CNTs can effectively inhibit the spalling of the sample during the friction process and reduce the plastic deformation and scratch of the worn surface. The wear mechanism was mainly changed from delamination wear to abrasive wear.
As can be easily seen in figures 14(b) and (d), the material's surface has deep and wide furrows and some lamellar abrasions on the surface, which were caused by repeated plastic deformation of the material as a result of strain hardening. Figures 15(b) and (c) show the SEM with the addition of 1 g l−1 CNTs, where the plow grooves on the material's surface had become shallow. There was no noticeable presence of lamellar abrasive debris, indicating that the addition of CNTs had improved the plastic rheology resistance of the composite, which in turn had changed the wear resistance of the composite. This was due to the self-lubricating effect of CNTs. During the friction process of the composite material, CNTs will be extruded from the material to reduce the direct contact between the matrix and the friction pair. As the CNTs content increases, the extruded CNTs gradually increase, further reducing the direct contact between the matrix and the friction pair, thus gradually reducing the friction factor of the composite material. In addition, because the CNTs were tubular, there was rolling friction in the sliding friction of the material, thereby reducing the friction factor.
To further understand the wear mechanism of the CNTs/Ni composites, EDS analysis of the wear chips was carried out by FE-SEM (figures 14(c) and (d) and 15(c) and (d)). The main elemental composition of the scrap included Ni, C, O, and Si. The Si may have originated from the indenter or from the incomplete cleaning of the sample after grinding and polishing. The wear track showed a significant amount of carbon across the wear surface, which may be due to the formation of a carbon film on the sample during the wear test. The self-lubricating effect of this film reduced the coefficient of friction of the material.
3.3.3. Abrasion mechanism
Friction wear is usually a complex mechanism that involves several different mechanisms occurring simultaneously. When the composite surface first contacted the friction pair, adhesive wear occurred, and then the sample surface was peeled and broke under the positive pressure and friction resistance, thereby forming grinding debris. Furthermore, CNTs were pulled out under the tangential force and then produced free CNTs debris. During friction pair sliding, the free CNTs fragments were constantly enriched on the friction subsurface, avoiding the direct contact between the composites and the friction pair, and providing a good lubrication effect. Kim [41] also believed that the carbon film acted as a solid lubricant when it covered the sample surface, thus reducing the coefficient of friction. When the CNTs content was low (0–0.5 g l−1), there were not enough damaged CNTs to form a carbon film on the friction subsurface. Meanwhile, a small amount of free CNTs fragments constantly scratched the sample surface and then aggravated damage to the sample surface, which increased the roughness of the sample surface, thus increasing the COF of the composites. Upon increasing the CNTs content, broken CNTs fragments were constantly enriched on the friction subsurface. When there were enough CNT fragments, the enriched CNTs fragments formed a continuous carbon film on the subsurface, which prevented the direct contact between the composites and the friction side, thus greatly reducing the COF. Furthermore, because some of the carbon nanotubes protrude from the surface, the direct contact between the metals was cut off, and the friction coefficient will be decreased, while the carbon nanotubes still adhere to the coating and the friction pair after breaking off, which can still play the role of lubrication. In addition, the CNTs in the coating were distributed in the form of network and winding, which increased the bonding force of the composite phase and made it less likely to be pulled out and fall off during wear, thus improving the wear resistance of the material.
4. Conclusion
CNTs were functionalized and the carbon nanotube nickel-based composites were prepared by pulsed electrodeposition, and the mechanism of anti-friction of the materials with different carbon nanotube contents was investigated. This investigation indicated the potential applications of CNTs for enhancing the friction and abrasion properties of the metal matrix. The following conclusions can be made from our study.
- Pulsed electrodeposition and ultrasonic dispersion appear to be promising methods for fabricating CNTs/Ni composites;
- ST-CNTs had better dispersion and matrix wettability, and they bound well to the nickel interface and were uniformly dispersed in the matrix;
- Roughness increases of the material surface with the rise of carbon nanotube content. Microhardness values for CNTs/Ni samples were found to increase with an increase CNTs concentration. The hardness of 1 g l−1 CNTs/Ni composites showed a maximum value. On the contrary, excessive carbon nanotube content decreases the hardness value of the composite;
- The preferential orientation of the material was changed due to the addition of carbon nanotubes from (200) to (111) crystalline planes;
- Scratch experiments demonstrated that incorporating carbon nanotubes improved the frictional properties of the material and reduced the friction coefficient. Compared to pure nickel, the COF of 0.2 g l−1 CNTs/Ni composite was decreased by 10%;
- The COF decreases with the increase of carbon nanotube content, mainly due to the carbon film formed by carbon nanotubes and the lubricating film formed by the nickel matrix during the friction process.
Acknowledgments
This research was supported by the National Natural Science Foundation of China (Grant no. 51861013) and Yunnan Ten Thousand Talents Plan Young & Elite Talents Project (YNWR-QNBJ-2019-284).
Data availability statement
All data that support the findings of this study are included within the article (and any supplementary files).
CRediT authorship contribution statement
Ping Yang: Investigation, Methodology, Data curation, Writing—original draft.
Ning Wang: Validation, Visualization.
Jian Zhang: Data curation, Formal analysis.
Yun Lei: Investigation, Methodology.
Baipo Shu: Resources, Investigation, Writing—review & editing, Supervision, Funding acquisition.
Declaration of competing interest
The authors declare that they have no known competing financial interests or personal relationships that could have appeared to influence the work reported in this paper.