
Abstract
Visualizing structures smaller than the eye can see has been a driving force in scientific research since the invention of the optical microscope. Here, we use a network of neural networks to create a neural lens that has the ability to transform 20× optical microscope images into a resolution comparable to a 1500× scanning electron microscope image. In addition to magnification, the neural lens simultaneously identifies the types of objects present, and hence can label, colour-enhance and remove specific types of objects in the magnified image. The neural lens was used for the imaging of Iva xanthiifolia and Galanthus pollen grains, showing the potential for low cost, non-destructive, high-resolution microscopy with automatic image processing.
Export citation and abstract BibTeX RIS

Original content from this work may be used under the terms of the Creative Commons Attribution 3.0 licence. Any further distribution of this work must maintain attribution to the author(s) and the title of the work, journal citation and DOI.
1. Introduction
There are many approaches to microscopy, each with distinct advantages and disadvantages. The optical microscope is convenient, and relatively low-cost, but has a resolution limited by the diffractive properties of light. Scanning near-field optical microscopy [1] can achieve tens of nanometre resolution, but requires long scan times and has the physical restriction of requiring the placing of probes within the evanescent field of the sample. Photo-activated localization microscopy [2] and stimulated emission depletion [3] can achieve resolutions ten times that of optical microscopes, but require samples to be labelled with fluorescent molecules. Super-oscillatory lenses [4] have been shown to achieve a resolution better than λ/6 but require working distances on the order of microns. A scanning electron microscope (SEM) can achieve resolution well below the diffraction limit of visible light [5], but this approach is expensive and often requires samples to be placed under vacuum conditions. Atomic force microscopy [6] and scanning tunnelling microscopy [7] can produce sub-nanometre resolution, but only over small areas in a workable time period.
While parametric modelling approaches have been applied in order to enhance medical imaging [8], recent work using deep learning approaches has also shown the potential for the application of neural networks (NNs) for enhancing image resolution. Examples for such an application include, a 4x upscaling on photographic images [9], optical microscopy (improving the resolution from 40x to 100x) [10], dental imaging [11], phase imaging [12], fluorescence microscopy [13], magnetic resonance imaging [14], SEM imaging [15, 16], positron-emission tomography [17], stochastic optical reconstruction microscopy [18], and ultrasound imaging [19]. NNs are also well-suited to the classification of objects in images, and accordingly the classification of biological, pollution and colloidal particles from images and scattering patterns has also been demonstration [20–24].
Such approaches generally use convolutional neural networks (CNNs) [25–27] or conditional generative adversarial networks (cGANs) [28–30], where CNNs are based on the application of a single NN, and cGANS are based on two NNs that are trained via an adversarial methodology [31–35].
In this work, we demonstrate a novel microscopy technique via deep learning, referred to here as a neural lens, which offers the low-cost and convenience of an optical microscope, but with a resolution not limited by the optical diffraction limit, whilst also providing the capability for automatic labelling and enhancement of desired features. Specifically, as well identifying pollen grains from 20× optical microscope images, we demonstrate the magnification of 20× optical microscope images of biological particles, namely, Iva xanthiifolia and Galanthus pollen grains, into 1500× resolution images, where the features in the generated 1500× images were the statistically most likely to occur. The neural lens was formed as a network of NNs in order to provide the flexibility for multiple outputs.
2. Concept
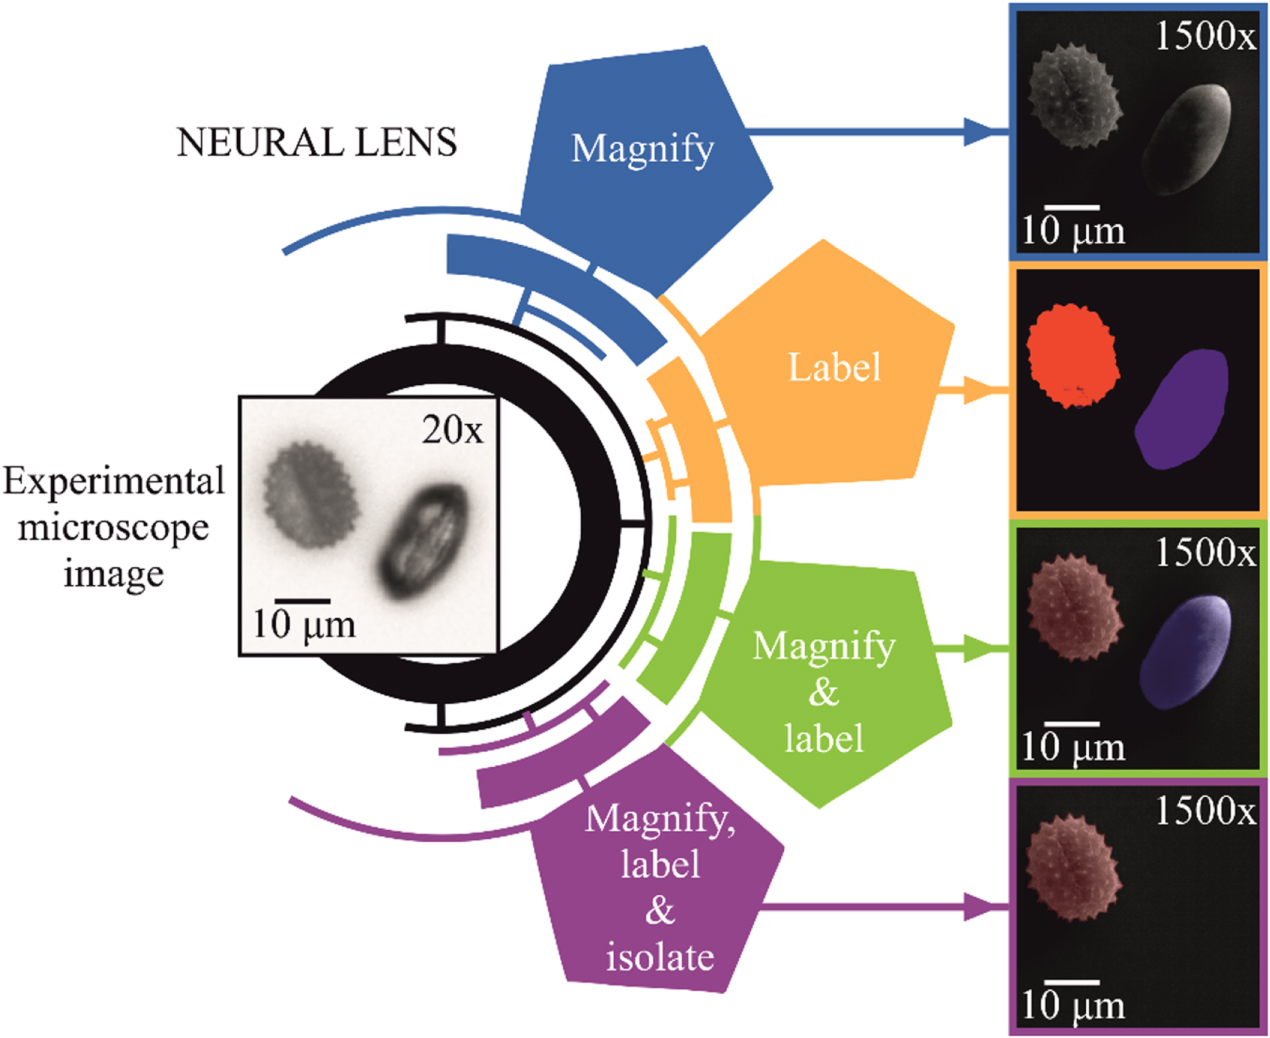
The concept of the neural lens is shown in figure 1, which shows the processing of an experimental 20× microscope image of two pollen grains of different types. For this input image, the neural lens produced a range of different outputs, namely a 1500× image, a sample map showing the location of the different pollen types, a colour-labelled 1500× image, and a coloured 1500× image filtered for only one specific type. The neural lens is fully deterministic, as the randomness from the latent variable was removed after training. The colour labelling for the Iva xanthiifolia and the Galanthus pollen grains were red and blue, respectively. No post-processing was applied to any of the input or output images in this manuscript. The 20× microscope image used in figure 1 was not used during the training of the neural lens and hence this result demonstrates the application of the neural lens to a previously unseen microscope image.

Figure 1. Concept of the neural lens. An experimental 20× microscope image was processed by the neural lens, which automatically produced an array of different output images. Some of the capabilities of the neural lens are shown, including the ability to magnify, label and isolate images of pollen grains. The two types of pollen, Iva xanthiifolia, and Galanthus, are identified and labelled by the neural lens as red and blue, respectively.
Download figure:
Standard image High-resolution imageThe training data in this case was a dataset containing pairs of low resolution microscope images and associated SEM images. During training, each input image was sequentially processed by the NN, which then generated a higher-magnification image. This generated output image was compared with the SEM image from the training dataset, and the error between the images was determined. An automatic optimisation process, known as backpropagation [36], was then used in order to reduce the error for subsequent iterations.
3. Experimental methods
3.1. Sample fabrication and imaging
Pollen grains from Iva xanthiifolia (supplied by Sigma Aldrich) and Galanthus (collected by the authors) were deposited on a silica slide via a pipette, and were therefore randomly orientated and positioned on the silica slide. The particles were imaged using a Nikon microscope with an image magnification of 20× (Nikon, LE Plan, NA = 0.4, WD = 3.5 mm) and CMOS camera (Thorlabs DCC1645C). The SEM images of the pollen were recorded using a Zeiss Evo SEM to produce 2048 pixels by 1536 pixels sized images, which were subsequently cropped to 1024 by 1024 for ease of computing. Microscope images and associated SEM images were paired via scaling and cropping of the microscope images, where the offset and scaling factor was calculated via phase correlation.
3.2. Conditional generative adversarial network
The neural lens consisted of four interconnected NNs that were each trained using a cGAN architecture. The cGANs each consisted of two NNs, referred to as a generator and a discriminator, which operated in tandem, where the generator transformed input images into generated output images and the discriminator would be fed either the experimental SEM image or the generated image and learn to discriminate between the two. During training, both the generator and discriminator improved in effectiveness, and hence each cGAN became more effective at encoding the required image transformation. At the start of training, the neuron weightings for the generator and discriminator were randomly initialised, and hence they encoded zero information about the training data. After each of the cGANs were trained, the associated generators were extracted and combined to form the neural lens architecture. The cGAN framework, known as pix2pix [37], was used as the base implementation for the paper, with an extension to a 10-layer generator architecture in order to enable an image resolution of 1024 by 1024 pixels. The network was trained using a learning rate of 0.0002 and drop-out of 0.5.
4. Neural lens architecture and training
Within the neural lens, there were three types of NN. Firstly, a labelling NN was trained in order to identify the specific type of pollen, hence transforming a 20× image into a coloured sample map. Secondly, a magnifying NN was trained to transform a 20× image into a 1500× image with a black background. In this case, there was a magnifying NN for each of the pollen types. Thirdly, a shadowing NN was trained to generate the shadowing effect on any 1500× image that had a black background. Although the labelling processes demonstrated here could have been achieved via a neural network designed specifically for this purpose, for example SegNet [38], here we chose to use the same architecture at every step of the pipeline for elegance. Figure 2 shows a schematic of the internal network of the neural lens, illustrating how each type of NN interacted and combined with the others. To connect the NNs inside the neural lens, some basic mathematical functionality, such as the addition or pixel-wise multiplication of images, was included. However, in practice, this basic functionality could also have been implemented as a NN. In the neural lens, the only input data was a single 20× microscope image, and hence all subsequent images were generated automatically.

Figure 2. Schematic of the internal network of the neural lens. Through a series of interconnected NNs, the input 20× microscope image was magnified to a 1500× image, whilst the imaged pollen grains were simultaneously identified, labelled, colour-enhanced and isolated. A labelling NN transformed a 20× microscope image into a colour-labelled sample map. A magnifying NN transformed a 20× microscope of a single type into the equivalent 1500× image on a black background. A shadowing NN added shadows to an image of objects on a black background. The 20× microscope image was the only required input, and all other images were generated automatically.
Download figure:
Standard image High-resolution imageThe labelling NN was trained on 20× microscope images (input) and red/blue sample maps (output), where the sample maps were created using Canny-edge detection [39] and human-identification on the associated SEM images. A separate magnification NN was used for each of the pollen types, where each was trained on microscope images of a single type (input) and the associated SEM images on a black background (output). The SEM images with a black background were created by combining the SEM images with the associated red/blue sample map. The shadowing NN was trained on SEM images with a black background (input) and SEM images with shadows (output).
The training dataset for the neural lens consisted of fifty 20× microscope images and associated 1500× SEM images, red/blue colour maps and black background SEM images, where the images covered both single pollen grains of Iva xanthiifolia and Galanthus as well as mixtures of Iva xanthiifolia and Galanthus pollen grains. The neuron weightings in each of the NNs were randomly initialised, and hence before training the neural lens had zero encoding of the training data. Each of the NNs inside the neural lens was trained until the training errors reached a minimum, after approximately 200 epochs (where a single epoch is defined as the processing of all training data exactly once), taking approximately 3 days each. The training data was augmented from 50 images to 2500 images via random translation of the training image pairs across the 1024 by 1024 input size. The processing time for the neural lens for a single input microscope image was approximately 10 s. Details of the code of the neural network are available in the DOI link at the end of this manuscript.
5. Experimental results and discussion
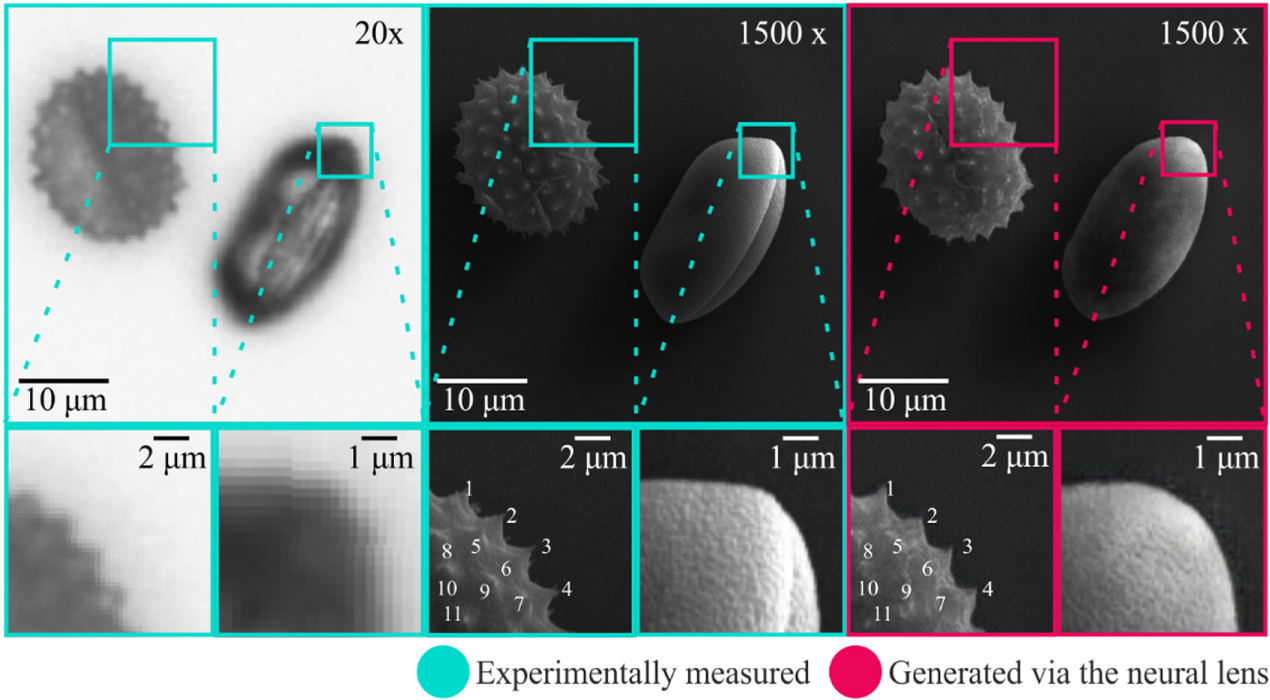
Demonstration of using the neural lens on data that was not present in the training data set (unseen data) is shown in figure 3, which displays a comparison between an experimental 20× image and associated experimental 1500×, along with the generated 1500× image produced using the neural lens. The neural lens correctly determined the positions and orientations for the two pollen grains, and also generated an appropriate lighting and shadowing effect. For the Iva xanthiifolia pollen grain, the number, distribution and shapes of the spines, along with the sulcus (groove), was accurately created. Whilst the shape of the Galanthus pollen grain was correct and a nano-scale surface structure was generated, the sulcus was missing, which was attributed to the complexity of quantifying the external features from an image of a translucent object. The structures observable in the 20× image of the Galanthus pollen grain corresponded predominantly to internal structures, and hence these features were not present in the SEM image. Therefore, the transformation of the Galanthus pollen from 20× to 1500× was particularly challenging. With additional training data, which would provide additional information regarding the appearance of internal and external features, it is anticipated that the sulcus would have been generated.

Figure 3. Evaluation of the neural lens, showing a 20× microscope image along with the associated experimental and generated 1500× images. The neural lens correctly determined the position and orientation of the two pollen grains, and produced a realistic lighting and shadowing effect. The generated surface texture on the Galanthus closely matched the experimental image. The spikes are labelled in the experimental and generated 1500× images of Iva xanthiifolia.
Download figure:
Standard image High-resolution imageThe neural lens enabled a resolution that was considerably superior to the resolution of the original 20× microscope images. It is important to realise that the features in the generated 1500× images were the statistically most likely feature, given the information contained in the 20× image. In other words, the effectiveness of the neural lens resided in the encoding of the statistical correlation between the occurrence of features in the 20× and the associated 1500× images that was learnt during the training process. Therefore, for the Iva xanthiifolia pollen grain, the spines that can be observed in the 20× images, for example around the perimeter of the grain, along with those that are less clear in the 20× image, such as those on the top surface of the grain, are generated realistically in the 1500× images. This effect can be similarly observed when comparing the surface texture of the generated and experimental 1500× images for the Galanthus. However, despite the statistical nature of the neural lens, the generated outputs are comparable. For larger training datasets, the accuracy would almost certainly be further improved.
Table 1 shows the relative position of each spike of Iva xanthiifolia labelled in figure 3. The standard deviation of the positional error for the 11 spikes, was 5.0 pixels (∼415 nm) in X, and 4.3 pixels (∼360 nm) in Y.
Table 1. Position of experimental and generated spikes labelled in figure 3, in number of pixels relative to bottom-left of the images, along with the difference between them (the error) in pixels.
| Experimental position (pixels) | Generated position (pixels) | |||||
|---|---|---|---|---|---|---|
| Spike | X | Y | X | Y | X error (pixels) | Y error (pixels) |
| 1 | 33 | 112 | 29 | 115 | 4 | −3 |
| 2 | 58 | 92 | 58 | 89 | 0 | 3 |
| 3 | 81 | 68 | 79 | 65 | 2 | 3 |
| 4 | 101 | 34 | 98 | 34 | 3 | 0 |
| 5 | 43 | 80 | 43 | 70 | 0 | 10 |
| 6 | 72 | 58 | 69 | 54 | 3 | 4 |
| 7 | 81 | 28 | 85 | 30 | −4 | −2 |
| 8 | 14 | 72 | 10 | 71 | 4 | 1 |
| 9 | 53 | 43 | 47 | 44 | 6 | −1 |
| 10 | 20 | 50 | 14 | 56 | 6 | −6 |
| 11 | 33 | 13 | 44 | 15 | −11 | −2 |
Figure 4 shows the neural lens magnification of a single Iva xanthiifolia pollen grain. In the image, it is clear that on comparing the experimental microscope image and the experimental SEM image, many of the spikes, for example those labelled '2 spikes' and '3 spikes' on the figure, are not resolvable in the microscope image. However, the neural lens has been able to generate the spikes, despite not being observable in the microscope image.

Figure 4. Evaluation of the capability of the neural lens, showing a 20× microscope image along with the associated experimental and generated 1500× images. The generated SEM image shows features that were not resolvable in the experimental microscope image.
Download figure:
Standard image High-resolution image
6. Conclusion
In conclusion, we have demonstrated a new microscopy technique, formed from a network of NNs, which we have referred to here as a neural lens. The neural lens was shown to transform 20× microscope images of pollen grains into 1500× images with a resolution comparable to an SEM. Once trained, the power of the neural lens was shown to reside in its capability to perform magnification whilst simultaneously identifying, labelling, enhancing and even removing specific features in the images. The neural lens provides the flexibility and low-cost of optical microscopy, the resolution of electron microscopy, and the functionality of automated image processing. The neural lens learns via the observation of experimental data, and hence there is no requirement for understanding the physical laws of light propagation and light–matter interaction. Whilst two types of pollen grains were shown here, the modular design of the neural lens means that this approach could easily be extended to detect additional object types and include more complex image processing features. Computationally, the modular design means the neural lens was not constrained to executing on a single graphics-processing unit, and hence offers significant potential for parallelisation. The neural lens could be applied to real-time, non-destructive imaging and characterising a variety of objects, such as living biological matter.
Acknowledgments
We gratefully acknowledge the support of NVIDIA Corporation with the donation of the Titan X GPU used for this research, donated through NVIDIA GPU Grant Program.
Funding
BM was supported by an EPSRC Early Career Fellowship (EP/N03368X/1). DH was supported by an EPSRC Doctoral Prize (EP/N509747/1). ML was supported by a BBSRC Future Leader Fellowship (BB/P011365/1). The RDM data for this paper can be found at DOI: 10.5258/SOTON/D0442.