

Abstract
Simultaneous self-focusing and compression of ultrashort weakly-relativistic Laguerre–Gaussian laser pulses in dense plasma is investigated theoretically and numerically. A simple theoretical model is developed and used to identify parameter regimes of interest, and then three-dimensional particle-in-cell simulations are carried out to examine the physics in detail. Rapid self-focusing and compression are observed, leading to pulse collapse even for laser pulse energy at the ten millijoule level. Long-lived ring-shaped post-soliton structures are left at the location of the first collapse, and the residual laser energy is scattered into the plasma. Filamentation and re-focusing occur beyond this point, the structure of which depends on the beam parameters but is observed to be only weakly dependent upon the mode of the laser. Circularly-polarised light is found to produce particulary symmetric plasma density structures. In all cases, bursts of MeV electrons with thermal-like spectra are observed at points of collapse.
Export citation and abstract BibTeX RIS

Original content from this work may be used under the terms of the Creative Commons Attribution 4.0 licence. Any further distribution of this work must maintain attribution to the author(s) and the title of the work, journal citation and DOI.
1. Introduction
Laguerre–Gaussian (LG) beams [1] have been a subject of study for decades. The defining physical property of LG beams is the fact they carry orbital angular momentum (OAM), sometimes referred to as a nonzero topological charge. This differs from the more commonly encountered spin-angular momentum (SAM) carried by circularly polarised (CP) light. In fact, LG beams are capable of carrying both SAM and OAM, and may impart this angular momentum to optical media. The generation of LG beams may be achieved by various methods. Perhaps the simplest method is to reflect a pure Gaussian (PG) beam off a specially constructed stepped mirror [2], which introduces an azimuthal variation in the phase, subsequently resulting in the characteristic LG beam structure. The quality and mode of the resulting LG beam depend on the number of steps anmd the quality of the incident beam. More recently, this method has been adapted to produce LG beams of relativistic intensity [3]. An alternate method of generating LG beams involves, again, reflecting a PG beam off a specially constructed surface, in this case a hologram [4]. When properly constructed, this can produce an LG beam of extremely high quality, and a similar technique can be employed to produce beams of relativistic intensity by using an expanding plasma mirror in place of a solid target [5]. Once a LG beam has been produced, be it relativstic intensity or not, stimulated Raman scattering (SRS) may be employed to amplify the beam further [6]. There are multiple applications of intense LG beams, many of which overlap with the applications of PG beams. The main interest in using LG over PG beams is the potential to transfer OAM to any accelerated particles or secondary radiation arising from the interactions. High-harmonic generation (HHG) has been studied with LG beams [7–11] as well as numerical studies of hole-boring in solid targets [12]. OAM-imparted particle acceleration is major field of study, for both protons [13, 14] via irradiation of solid targets and electrons via laser wakefield acceleration [15, 16], which also allows for the study of LG beam driven x/γ-ray sources [17, 18].
In this work, we investigate the more fundamental processes of relativistic self-focusing and self-compression of LG beams in dense plasma, where the nonlinear effects associated with ponderomotive force, relativistic electron mass increase, as well as electron plasma wave excitation and electron acceleration are involved. Self-focusing of LG beams has been studied previously both numerically and experimentally in Kerr media [19, 20], with a key result being the filamentation of the beam based on the input power, and seeded by inhomogeneities in the beam or medium [21]. The physical principles of self compression of LG beams are essentially the same as self-compression for PG beams, however the altered transverse profile means the interaction proceeds quite differently. Comparing with the self-focusing dynamics of LG beams in Kerr media, unique features are found in plasma such as laser pulse collapse, spectral boardening, energetic electron generation and post-soliton formation [22]. Post-solitons are the final stage of a nonlinear process arising from frequency downshift of the laser during propagation [22, 23]. Eventually, the frequency of the light drops sufficiently that it can no longer propagate through the plasma and becomes trapped. This trapped light (soliton) oscillates in place, ponderomotively displacing electrons and gradually digging out an isolated cavity in the plasma, surrounded by a shell of displaced electrons. Eventually the soliton decays, but the cavity (post-soliton) remains, expanding slowly due to residual ion motion.
In section 2, an analytical model is presented to estimate the conditions for simultaneous relativistic self-focusing and self-compression of LG beams. In section 3, we present three dimensional (3D) particle in cell (PIC) simulation results to show the key features of LG beam propagation in plasma under a variety of laser and plasma conditions. The paper concludes with a summary in section 4.
2. Theory model
In this section, we present a theory model to describe the evolution of the LG laser analytically via an envelope model. Previously [24] we have found that such models typically have low predictive power in terms of the quantitative evolution of the laser, therefore rather than making direct comparisons between the theory and the eventual simulation results, we will use the model to identify the parameter regime of interest in order to produce the strongest potential focusing and compression, and give only qualatative predictions on the tendency of the laser in the plasma.
Laguerre–Gaussian lasers are characterised mathematically by the presence of a Laguerre polynomial  in the radial part of the envelope, and an azimuthal dependence in the phase. These are governed by the azimuthal l and radial p indices of the polynomial. For this work we will consider modes with p = 0 only, such as may be produced with a spiral phase plate. In this case, the envelope has only a single radial amplitude antinode and the generalised Laguerre polynomial becomes
  , greatly simplifying the analysis. Very often when describing LG lasers, a mathematical description is used which normalises the amplitude such that the total energy of the laser is independent of the LG mode involved [1]. As we are interested in the peak amplitude and energy content of the beam, we instead use a simplified description in which amplitude is not normalised. We hence write the laser fields and envelope in cylindrical coordinates as

where k and ω are the laser wavenumber and angular frequency, w0 is the initial beam waist, d0 is the initial beam duration and a0 = eE0/(me
c
ω) is the normalised amplitude of the electric field where E0 is the laser electric field strength, and e, me
, and c have their usual values. The total energy  in Joules of a laser with wavelength λ0 in meters and period τ0 = λ0/c can be given by

where  and
and  are the normalised laser dimensions, and the final value is scaled by the real wavelength λ0. This value is calculated for linearly-polarised (LP) light, and should be doubled for circularly-polarised (CP) light. In the case that ∣l∣ = 0, the PG mode is recovered and a0 corresponds to the usual peak field value one would expect. However when ∣l∣ > 0 this value no longer describes the peak amplitude of the laser due to the modified envelope. In such cases the radial location rLG and value aLG of the peak amplitude may be calculated via differentiation of (1),


Illustrated in figure 1(a), it is clear that as ∣l∣ increases, both a0 and w0 cease to be meaningful on their own. Using (3) and (4) we can approximate the radial part of the laser envelope as a 2D Cartesian PG envelope, with amplitude aLG offset from the axis by rLG, and the spot size reduced to  . Hence, the radial part of a may be approximated by;

This is illustrated in figure 1(b) for the first three LG modes. The approximation is good in overall agreement, but the LG envelope is slightly skewed, resulting in the amplitude close to the axis being overestimated, and the amplitude far from the axis being underestimated. Obviously, this approximation is only applicable when m = 0, and there is only a single radial intensity antinode. Geometrically, we may conceptualise this approximation as a toroidal laser envelope, where the major radius is given by rLG, and the minor radius by wLG. Thus, rather than the envelope centroid being a single point, it instead a ring of radius rLG. This approximation is slightly better at high ∣l∣, as the laser energy moves away from the axis, and there is less cutoff in the approximated profile at r = 0. From here, we may make use of the azimuthal symmetry to develop the envelope evolution equations for a 2D PG laser of the form

where a(x), w(x) and d(x) are parameter functions with the initial values a(0) = aLG, w(0) = wLG, d(0) = d0.
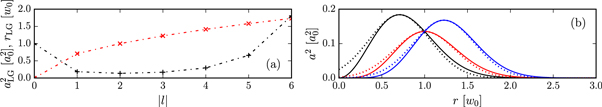
Figure 1. (a) Relative intensity (black plusses) and radial position (red crosses) of the intensity maxima for various LG modes compared to a PG mode. (b) A comparison of LG mode radial intensity profiles (solid lines) to PG approximations (dotted lines), for ∣l∣ = 1 (black), 2 (red), 3 (blue).
Download figure:
Standard image High-resolution imageThis simplification brings with it a departure from quantitative correctness to the results, as the azimuthal variations to the phase are excluded. It is impossible to capture all physics in a simplified theoretical framework such as the paraxial envelope model, hence the use of PIC simulation is necessary to provide the more physically correct result. More complex models dealing with LG beams exist and, short of computationally expensive simulations, typically rely on solving the underlying nonlinear Schrodinger equation (NLSE) numerically [25]. As previously stated we will be primarily be using the results of our model to determine the parameter regimes of interest. We therefore continue with the understanding that the aim of this model is to capture the coupling between d and w, while quantitative predictions on the evolution are dubious.
By considering the laser moving through a homogeneous plasma with density n0 = ne /nc , we may apply a variational method, using a suitable envelope equation [24, 26]

where ψ is the envelope of the laser, and we are working in comoving time ξ = t − z/βg
, with  a constant relating to group-velocity dispersion,
  is the normalised group velocity of the laser and
  is the normalised plasma density. The nonlinear term is derived considering relativistic nonlinearity only, by Taylor-expanding the electron Lorentz factor
  . In this formulation, distance is normalised to the laser wavelength and comoving time to the laser period. To retrieve the energy conservation and evolution equations of the envelope parameter functions we employ a Gaussian test envelope function derived from (6) occupying two spatial (x, ξ) and one propagation (z) dimensions

where the parameter functions w(z), d(z), B(z) and C(z) are real functions of z, and a(z) is a complex function of z. The functions w and d describe the evolving pulse spot size and duration, a describes the amplitude, and B and C represent phase changes arising from phasefront curvature and longitudinal chirp, respectively. The variations of a allow us to retrieve the energy conservation relation

where  is the normalised energy density of a radial slice of the beam and remains constant over the propagation. As LG beams behave as 2D beams in terms of their energy conservation, the peak amplitude of a LG beam will change more slowly under focusing or defocusing than a PG beam of similar parameters. The end point of the variational method is to retrieve the evolution equations


which describes the evolution of the parameter functions d and w. The amplitude a has no explicit evolution equation, but it can be implied from the solutions of (10) and (11) via (9). In practice the results from these equations are a poor way to predict beam behaviour, generally over-estimating the beam power required to ellicit self-focusing or compression. As such we will not be drawing comparisons between the simulation results and the results of (10) and (11). However, although the magnitude of (10) and (11) is inaccurate, the coupling between w and d is well-reproduced in simulation [24].
Of particular interest to this work is the regime in which the transverse and longitudinal evolution occurs at the same rate, as this leads to the highest potential increase in laser intensity. This regime is found by setting (10) and (11) equal to zero, and equating the results. We find the relation d2 =  w2, which represents the conditions under which the pulse shape does not change. As the amplitude is eliminated, this does not have any bearing on changes to the tendency of the evolution. The aspect ratio of the pulse becomes fixed, but the whole pulse may grow or shrink in scale. In this way we may write in terms of the initial laser parameters

which gives the conditions for matched evolution.
Some example solutions are shown in figure 2, demonstrating first in (a), the well known [27] quasi-infinite pulse result for self-focusing in 2D geometry, resulting in spot size oscillation, and then the matched pulse case in (b), in which w and d evolve identically. In this case no oscillation is observed, and pulse collapse occurs after a short distance. This case is analagous to a quasi-infinite pulse focusing, where here the longitudinal dimension takes the place of the second transverse dimension. Conversely, (c) shows the case for a pulse which is also matched, but the amplitude does not meet the threshold for focusing/compression. In this case the pulse radially diffracts and longitudinally disperses, once again at the same rate.
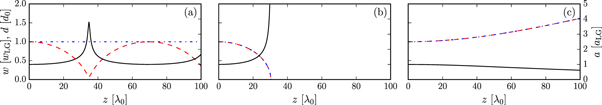
Figure 2. Example solutions to the evolution equations (10) and (11). The spot size evolution w is shown in red dashed line, the duration evolution d shown in blue dot-dashed line, and the amplitude calculated from (9) is shown a in solid black. All the examples use n0 = 0.5 and vary the other parameters. (a) Long-pulse regime, a0 = 0.5, w0 = 5, d0 = 500 (1 ps) in which self-focusing dominates. (b) The matched pulse regime, a0 = 0.5, w0 = 5, d0 = 5, as per (12), with a pulse amplitude above the focusing/compression threshold. (c) As (b), except with an amplitude well below the focusing/compression threshold, a0 = 0.001.
Download figure:
Standard image High-resolution imageA related problem is that of copropagating beams [28–30] in which parallel propagating laser beams may drift together and eventually merge into a single beam. An LG beam may be thought of as a 2D case of this problem with azimuthal symmetry. In this case, merging is not possible, due to the phase singularity at the axis, however we might expect to see some constriction of the beam over a long propagation distance. This phenomenon is worth mentioning, however as we are considering low energy lasers over very short propagation distances, the effect is negligible in this particular instance.
3. Simulation results
3.1. From self-focusing and compression to collapse
We investigate the envelope dynamics of LG beams via the 3D PIC code Osiris [31]. In the simulations we characterise length scales by the laser wavelength λ0 and time scales by the laser period τ0 = λ0/c. For the purposes of comparison, we may take λ0=800 nm. We choose a resolution of 16 × 16 × 32 cells per cubic wavelength, and 40 iterations per laser period. The simulation box spans 36λ0 × 36λ0 × 55λ0, with a uniform plasma occupying most of the box. At the edges of the box is a 5λ0 vacuum gap before the plasma where the laser antenna is situated, and a 0.5λ0 gap around the remaining transverse faces. There is a short linear ramp of 1λ0 in the plasma density profile to inhibit reflection. The plasma is represented by 4 electrons and 4 ions per cell, with mi
/me
= 1836 and  . We choose this quite high density in order to observe the self-focusing and compression over a short distance, whilst maintaining the weakly-relativistic approximation of the laser.
The first laser simulated is LP along x, propagating in the forward z direction. The laser is in LG01 mode, with a0 = 1.166 (aLG = 0.5), w0 = 7λ0 and d0 = 5τ0 (13 fs), corresponding to a pulse energy of 12 mJ and the theoretical case shown in figure 2(b). Figure 3(a) shows a snapshot of the plasma ion density at the end of the simulation. The data is inverted, so the figure actually shows areas of low density. This gives a time-accumulated look at the path of the laser, as areas of high ion evacuation represent areas in which strong ponderomotive force, i.e. high laser intensity, has been exerted. By the end of the simulation at t = 150τ0, the laser has long since left the box, and any charge imbalances are neutralised, the overall ion and electron density distributions are essentially the same. We choose to plot the ion density rather than the electrons simply because it is less noisy. Due to the intricate 3D nature of the evolution of LG beams, supplementary movies have been produced to accompany the static 3D renders in this section, in order to better elucidate the structures.
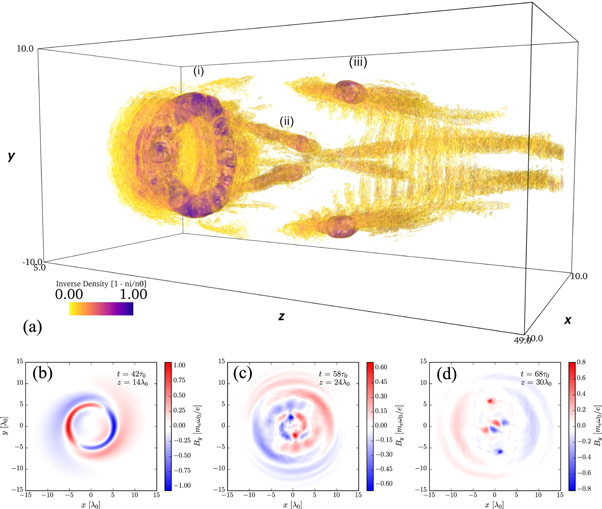
Figure 3. (a) 3D render of the ion density cavities left by the laser at the end of the simulation t = 150τ0. The ion density is first normalised to the plasma plateau density, then inverted, and the values clipped such that they lie in the range 0 ≤ 1 − ni /n0 ≤ 1. In this way a value of 0 indicates unpeturbed plasma, and 1 indicates complete evacuation of all ions. The first isosurface occurs at a value of 0.1 in order to omit small fluctuations in density. (b)–(d) Individual field slices of the transverse magnetic field as the beam centroid passes the positions (i), (ii), (iii) labelled in the upper plot, respectively. Exact z locations and simulation times of each slice are noted on the corresponding plot.
Download figure:
Standard image High-resolution imageIn the early stages of propagation we see a smooth focusing and compression down to a toroidal structure with a poloidal diameter of approximately λ0, illustrated by the field slice in figure 3(b), where we show the transverse magnetic field of the laser pulse. We choose to show the magnetic rather than electric field in order to avoid confusing the snapshots with space-charge fields from the newly-forming cavities. When showing the transverse magnetic field it is also possible we may see components of quasistatic azumithal magnetic fields arising from longitudinal current relating to the laser focusing in dense plasma [32], however in this case this effect is still smaller than space-charge fields. The amplitude of the pulse rises slowly at first from it's initial value of a0 = 0.5, becoming more rapid as the focusing and compression accelerate, eventually peaking at a0 ≈ 1.8, roughly a factor of 10 increase in intensity in the moments before pulse collapse occur. Focusing and compression occur over similar distance scales, in agreement with the model derived in section 2, with the pulse duration and poloidal scale reducing to single wavelength scales at the same rate. As the pulse dimensions reduce, the ponderomotive force is greatly increased in turn, resulting in plasma electron density cavitation. Within a few laser periods of this, the pulse starts to undergo collapse. At this point and beyond we must be cautious when analysing the field values. The extremely short pulse duration and very tightly focused regions of field mean that very high peak values appear but disperse quickly, becoming trapped or diffracting away. The dynamics of the propagation become quite chaotic, with the pulse losing much of its cylindrical symmetry as the wings of the beam that were not subject to collapse continue to propagate, and the remnants of the pulse that did undergo collapse diffract in all directions, with a convergence of laser energy close to the axis, visible in figure 3(c). The remains of the laser energy continuing on from the collapse site filaments, and refocuses again as beamlets as seen in figure 3(d), resulting in multiple post-soliton-like structures [33] visible as areas of low density at (iii) in figure 3(a).
For LP light, in the LG01 mode there are two intensity antinodes around the azimuth at any given longitudunal slice, corresponding to peak positive and negative electric field. Along the length of the beam, this becomes a tight double helix structure of high intensity which, when averaged over a long envelope where d ≫ τ0 results in the usual ring-shaped transverse intensity profile, with the laser energy distributed evenly around the azimuth. However, as the beam is compressed down to the single period regime, the laser energy is no longer evenly distributed on average, and instead is concentrated mostly at two points around the azimuth. This results in the high degree of bilateral symmetry seen in the field and density structures after the first collapse. Figure 4 shows a slice through the axis of the progression of the laser pulse leading up to and after collapse. Figure 4(a) shows the electric field leading up to collapse, with smooth symmetrical focusing. Figure 4(b) shows the electric fields near the the point of collapse, as the pulse is near to the single-cycle regime. Finally, figure 4(c) shows the fields immediately post-collapse, with two soliton-like structures visible at z = 15. These structures eventually decay, leaving the ring-shaped post-soliton visible at position (i) in figure 3(a). This collapse distance of 15λ0 can be compared directly with the prediction of (10) and (11) in figure 2(b) to highlight the inaccuracy of the model, in which a collapse distance of 30λ0 is predicted. Post-collapse a portion of the laser energy is directed towards the axis, and refocuses to form the two colliding density cavities at (ii) in figure 3(a). The laser energy which continues in the forward direction goes on to refocus more slowly, and form the two large outer density tracks and secondary post-soliton-like structures seen in figure 3(d). As there is more energy in this portion of the residual laser pulse, this reaches a higher peak amplitude after focusing than the inward-travelling portion, as seen by comparing figures 3(b)–3(d).
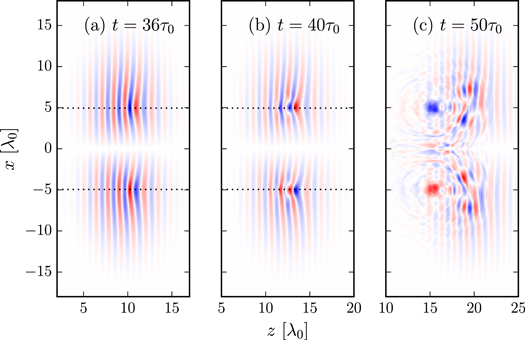
Figure 4. Illustrative trajectory of the laser E-field leading up to and post-collapse. The dotted line shows rLG.
Download figure:
Standard image High-resolution image3.2. Collapse and re-focusing
At the points of collapse, we observe ponderomotively expelled electrons ranging over a few MeV. Figure 5 shows the electron momentum distributions just following the first collapse. The majority of the accelerated electrons are in the forward direction, produced from a combination of wakefield acceleration resulting from sudden cavitation just prior to collapse, and ponderomotive expulsion. Figure 5(a) shows the forward momentum, with broad spectrum electrons in the forward direction reaching up to 3 MeV, and figure 5(b) shows the transverse momentum distributions. The majority of the electrons show small amount of transverse momentum, oscillating in the laser electric fields along the x-direction. More energetic electrons have no particular directional bias, indicating the collapse bursts are ponderomotively driven. The overall energy spectrum is shown in figure 5(c), which appears to be a thermal-like spectrum up to 3 MeV. Electron sources of this nature may be of relevance to space-radiation studies [34]. The energy of the pulse is continually depleted as the pulse propagates, being lost to trapped solitons and energetic particles. As a result, although there is enough energy left after the first collapse, the scattered laser does not focus to an amplitude of more than a0 = 1 after this point.
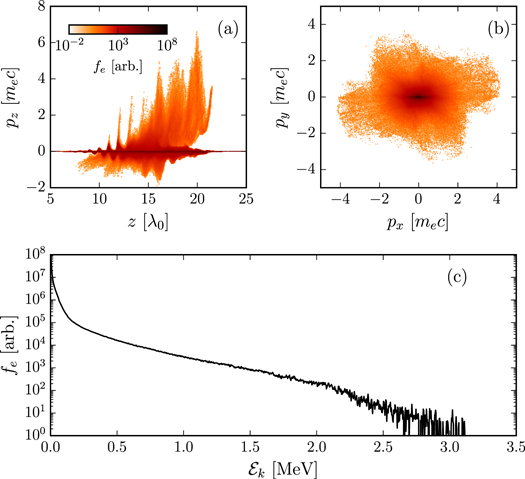
Figure 5. Electron momentum phasespaces just after the first collapse t = 50τ0. (a) Longitudinal momentum against position, (b) transverse momentum distribution. (c) Overall kinetic energy distribution.
Download figure:
Standard image High-resolution imageWe acknowledge that major features of the density structures are conspicuously aligned along the cardinal axes of the simulation grid. In order to affirm that this was not due to some numerical artefact, an identical simulation was performed with the laser polarisation rotated by 45 degrees. The propagation characteristics and density structures were well reproduced at this new orientation, so we are confident these results are physical.
3.3. Effects of laser polarisation and higher LG modes
Simulations were also performed for CP light. The simulated CP laser pulse is of identical shape and total energy to the LP case. The only adjustment required is a  reduction in the amplitude. Shown in figure 6, in contrast to LP light, the major difference is that as the pulse is compressed, the laser energy remains evenly distributed around the azimuth. This results in very symmetrical propagation even post-collapse. After the first collapse the remaining laser energy splits into evenly distributed filaments, each carrying a roughly equal amount of energy.
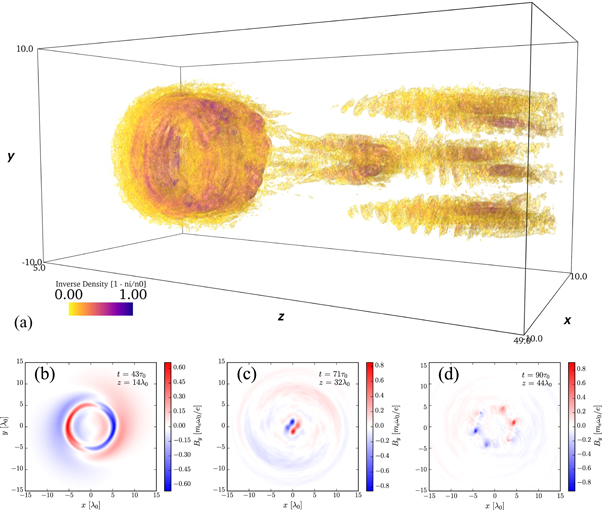
Figure 6. (a) 3D render of the ion density cavities left by the laser at the end of the simulation with CP light at t = 150τ0. The data is processed and visualised in the same manner as in figure 3(a). (b)–(d) Individual field slices of the magnetic field at progressive times and positions. Exact z locations and simulation times of each slice are noted on the corresponding plot. Except for the different polarisation, the laser pulse has the same energy, pulse duration, and transverse dimensions as in figure 3.
Download figure:
Standard image High-resolution imageAs in the LP light case, the laser focuses down to a ring, shown in figure 6(b), ultimately peaking at an amplitude of a0 ≈ 1.3, an enhancement of intensity almost the same as the linearly polarised case, when considering the lower initial amplitude. The pulse then collapses and diffracts as before, with laser energy first refocusing close to the axis, shown in figure 6(c), and the the residual laser energy in the halo refocusing later, shown in figure 6(d). We note that although the beam splits into multiple filaments, the phase structure is largely preserved, i.e. the beamlets retain their relative phase based on their position around the azimuth. This is seen in figure 6(d), where we can clearly identify six distinct filaments, with the phase of each beamlet differing according to its position around the azimuth, and representing one complete rotation of the phase as expected.
This result is supplemented by an additional CP simulation with a much larger spot size pulse, w0 = 12λ0 (wLG ≈ 8.5) in order to study how filamentation is governed. This pulse contains around five times more energy 150 mJ in order to maintain the peak intensity. A snapshot of the ion density at the end of the simulation is shown in figure 7, where many filaments can be seen after collapse, arranged evenly around the azimuth. This suggests that filamentation is governed by envelope shape rather than LG mode. The peak amplitude of the pulse at maximum compression is also around a0 = 1.3 as before.
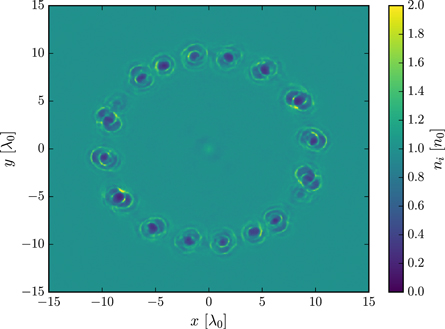
Figure 7. Transverse density slice from a CP simulation with a broad spot. The ion density at the end of the simulation t = 150τ0, and longitudinal position z = 50λ0 is shown, clearly displaying the cavities left by the passage of many laser filaments, evenly spaced around the azimuth.
Download figure:
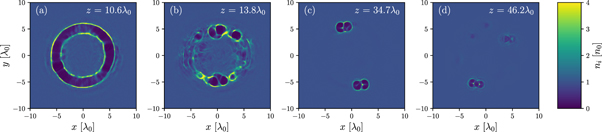
Standard image High-resolution imageThe effect of raising the LG mode further was also investigated. An LG02 mode laser of equal energy and almost equal dimensions to the original LG01 case was simulated. Small adjustments were made to the amplitude and spot size in order to maintain the total energy. The result is qualitatively more similar to the LP LG01 case, with the amplitude beginning at a0 = 0.5 and rising to a0 ≈ 1.8. As this is another LP simulation we do not observe the uniform distribution of filaments as seen in the CP simulations. However, due to the different field structure around the axis, the beam filamentation dynamics are quite different. A series of ion density slices are shown in figure 8. All snapshots are taken at the end of the simulation, and show progressive z positions indicated on each plot. Beginning in figure 8(a) at the collapse point, we see the very uniform, toroidal post-soliton structure. Immediately following this, the pulse begins to filament. Figure 8(b) is placed only 3λ0 after the collapse and already the density structure becomes highly asymmetric, indicating pulse breakup. At this point diffraction is very strong, and the various filaments propagate and refocus along new trajectories. Figure 8(c) and 8(d) show slices from further into the box, and illustrate that different filaments refocus at different rates and in different positions, in an unpredictable way, reminicent of the results obtained by [21]. As we kept the total energy the same as the LG01 case, each filament carries less power than the LG01 simulation and therefore the resulting ponderomotive force is lower, resulting in the more sparse density peturbations in the post-collapse regions of the plasma.
Figure 8. Ion density slices taken at the end of a LG02 simulation. All slices are taken at t = 150τ0, and the z position of each slice is marked on the corresponding plot.
Download figure:
Standard image High-resolution image
The OAM and SAM carried by the lasers across the simulations also give rise the the possibility of observing the inverse Faraday effect (IFE) in the form of quasistatic longitudinal magnetic fields arising from the transfer of angular momentum (AM) to the plasma electrons [35]. However, there are no significant long-lived longitudinal magnetic fields observed in the simulations. This is likely due to the weakly-relativistic nature of the pulse, and very short pulse duration. This results in energy transfer to the plasma being minimal until significant focusing occurs, and as the pulse diffracts rapidly after such focusing, the window in which AM is imparted to the plasma is small. The strongest longitudinal magnetic fields occur at the points of tight focusing, and in the downshifted solitons as they decay, illustrated in figure 4(c). It is our speculation that if considered under a fully-relativistic regime, much stronger longitudinal fields would be observed, as pump depletion would cause continuous and significant energy transfer to the plasma.
While the fundamental nonlinear effects observed in these simulations are common to all intense laser-plasma interactions, appearing in both the weakly and fully relativistic regimes. Specific differences arise from the envelope shape of Laguerre–Gaussian lasers when compared to PG lasers. As laser energy tends to accumulate towards existing maximums under focusing/compression, this results in a sharpening of the initial envelope shape. For such toroidal structures this results in the LG-specific evolution we see. For example, the filamentation structures we see are unique to the LG envelope. Typically for a PG laser the multifilamentation instability [36, 37] occurs only for much broader spot size, growing from small variations in the laser amplitude and medium refractive index. For lasers with relatively low energy and tight focusing, these variations are too small for the growth rate to be appreciable over short timescales. The presence of such structures highlights the differences between LG and PG dynamics in this isntance.
4. Conclusions
Using a simplified pulse evolution model for the LG envelope, we have identified parameter regimes of interest, which couple self-focusing and self-compression over the same distance scale. This process is studied numerically in plasma via PIC simulation for a variety of pulse configurations. The same fundamental nonlinear processes are observed in LG pulses as standard Gaussian pulses, but with structures unique to LG pulses. We find several commonalities between different LG pulses of similar energy, around tens of millijoules in the present work. In the early stages, laser self-focusing and pulse compression are found, as with standard Gaussian lasers, leading to shrunk toroidal structures and the formation of toroidal plasma density cavities, rather than focusing down to a point. The density cavities appears symmetric along the azimuthal direction, suggesting that the self-focusing itself is transversely symmetric. At later time, pulse collapse occurs, causing significant disruption to the symmetric toroidal field structures and the production of post-soliton-like structures. Unique features relating to the use of LG mode lasers appear in the form of multifilamentation, which is not typically observed in standard Gaussian pulses in this parameter regime. This scenario is found for both LP and CP laser pulses. In the case of CP light, the filaments and post-soliton structures can be ordered, and semi-predictable based on the pulse energy and spot size. The broad-spectrum accelerated electrons produced from these interactions reach into the MeV range, and can be produced by millijoule-class lasers. Higher LG modes show similar behaviour. Experimental studies of this work could be realised by first generating an intense LG beam [3–6] combined with a dense plasma, such as that employed in kHz experiments [38].
Acknowledgments
The authors acknowledge the OSIRIS consortium, a United Kingdom Science and Technology Facilities Council grant No. ST/P002056/1, the Engineering and Physical Sciences Research Council (EPSRC) grant No. EP/M009386/1, and the National Science Foundation of China (NSFC) grant No. 12135009. The numerical simulations were carried out on ARCHER via the Plasma HEC Consortium supported by EPSRC grant Nos. EP/L000237/1 and EP/R029148/1.
Data availability statement
All data that support the findings of this study are included within the article (and any supplementary files).
Turntable animation 1 (29.5 MB MP4) Ion cavity turntable animation for the simulation shown in Figure 6
Turntable animation 2 (29.7 MB MP4) Ion cavity turntable animation for the simulation shown in Figure 3
Turntable animation 3 (5.8 MB MP4) Ion cavity turntable animation for the simulation shown in Figure 7
Turntable animation 4 (30.1 MB MP4) Ion cavity turntable animation for the simulation shown in Figure 8