

Abstract
Many studies have focused on the relationship between the digital economy and carbon emissions at the macro level. However, there is a relative dearth of research on this relationship at the micro level. In this study, we determined the impact of the digital economy on the carbon emissions of individual companies and the mediating role of resource allocation in this relationship using data from listed Chinese manufacturing companies between 2011 and 2019. This analysis yielded three main findings. First, based on firm-level carbon emissions and the borderless organization theory, we found that the digital economy significantly reduced corporate carbon emission intensity. Second, the digital economy reduced resource misallocation and improved resource efficiency, which in turn reduced corporate carbon emission intensity. Third, market drivers and government regulations improved and hindered the ability of the digital economy to reduce corporate carbon emission intensity, respectively. These findings provide evidence for the need for government investment in the development of digital technologies and corporate digitization; the use of digital technologies by businesses to improve resource and energy efficiency; and minimal government regulation of the digital economy in favor of self-regulation through market forces. These measures are important for economic transformation and the achievement of carbon neutrality in emerging developing countries, including China.
Export citation and abstract BibTeX RIS

Original content from this work may be used under the terms of the Creative Commons Attribution 4.0 licence. Any further distribution of this work must maintain attribution to the author(s) and the title of the work, journal citation and DOI.
1. Introduction
In 2019, the total carbon emission in China was 14,093 million t. Contributing over 27% to total worldwide emissions, China is the world's largest carbon-emitting economy. Therefore, changing the established economic model of a country is crucial to achieving the goal of carbon neutrality by 2060. Information and communication technology (ICT), the collection and analysis of big data, robotics, and the blockchain have given rise to the digital economy. The digital economy is a new economic model that combines traditional economic sectors as the basis and digital technology as a supporting element to facilitate the achievement of structural optimization and sustainable development. According to the 2020 China Digital Economy White paper, from 2015 to 2020, the contribution of the Chinese digital economy to the national gross domestic product (GDP) increased from 27.0% to 38.5%, indicating an increase in related economic development. Thus, it is important to understand the role of the digital economy in the reduction of carbon emissions.
Studies on the relationship between the digital economy and carbon emissions have come to different conclusions (Kovacikova et al 2021, Zhang et al 2022). Digital technologies are associated with high energy consumption, which can increase carbon emissions if the energy consumed is generated by burning fossil fuels (Zimnukhova et al 2019). However, the digital economy can also optimize industrial processes and increase energy efficiency, thus reducing carbon emissions (Dahlman et al 2016). Most studies are based on macro-level analysis and do not consider firms at the micro level (Li et al 2021). For example, Li and Wang (2022) found a non-linear relationship between the digital economy and carbon emissions using citywide data from 2011 to 2018.
Resource allocation plays an important role in the digital economy and corporate carbon emission reduction. For example, Wang et al (2021) found that resource allocation significantly reduces carbon emissions using provincial panel data from 2007 to 2016. In contrast to single-resource indices, such as research and development (R&D) investment, technological innovation, and energy efficiency, resource allocation provides a comprehensive view of the resource utilization of a firm (Harrison et al 2017). Although some scholars have found that the digital economy can improve resource allocation, no corresponding econometric literature supports this finding (Wang et al 2022); since most studies on resource allocation and carbon emissions have focused on the macro level (Bian et al 2019).
Therefore, in this study, we aimed to gain a better understanding of the relationship between the digital economy and carbon emissions at the micro level through the following steps: (1) measuring the carbon emissions of firms in relation to the digital economy, (2) examining the pathways through which the digital economy affects resource allocation, and (3) analyzing the role of government regulation and market forces. The novelty of this study lies in its focus on the digital economy at the firm level, which provides more detailed information for policymakers and business managers.
Section 2 of this study comprises a literature review. Section 3 describes the data and model used in this study. Section 4 presents the regression results of the model and discussion thereof. Lastly, section 5 provides a summary of major findings, makes associated policy recommendations, and highlights the limitations of this study.
2. Literature review
2.1. Digital economy and carbon emissions
In this study, the impact of the digital economy on carbon emissions was analyzed using the borderless organization theory (Ashkenas et al 2015), which states that information, resources, ideas, and energy can quickly cross the boundaries between enterprises, allowing managers to swiftly react to environmental changes. Digital technologies can break down the geographical and knowledge boundaries between firms (Hanelt et al 2021) and make it easier to access information and capital, which can affect carbon emissions (Zhao et al 2021). Omri and Hadj (2020) and Usman et al (2021) found that ICT facilitates knowledge flow between firms to reduce their environmental impact. Lange et al (2020) found that ICT reduced energy consumption through increased energy efficiency and associated sectoral reforms.
Research on the digital economy and carbon emissions has mainly been conducted at the macro level (Khan et al 2020). For example, using panel data from 30 Chinese provinces between 2006 and 2017, Ma et al (2022) found that a larger digital economy led to lower provincial carbon emissions. Investment in R&D not only curbs carbon emissions but also has a moderating effect. Ren et al (2021) constructed a provincial internet development index for China using the entropy weight method and found that internet development reduced energy consumption and associated carbon emissions by changing the energy structure, economic growth, and investment in R&D and human capital.
Based on the above literature, we propose a hypothesis (H1; figure 1): The digital economy reduces corporate carbon emissions.
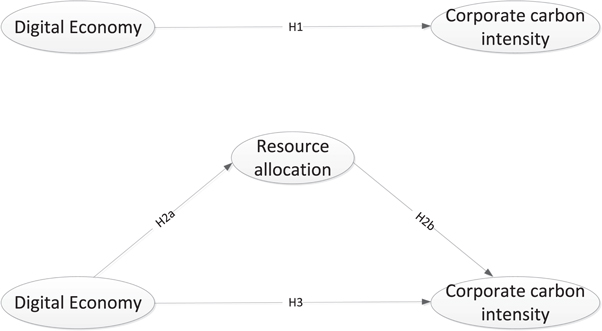
Figure 1. Hypotheses of this study.
Download figure:
Standard image High-resolution image2.2. Mediating role of resource allocation
According to the resource-based view, firms have heterogeneous resources, which results in different resource allocation pathways (Wernerfelt 1984). The digital economy is driven by the adoption of numerous digital technologies, which have disrupted the traditional patterns of resource utilization (Ma et al 2022). Various firms have different preferences for adopting digital technologies (Walter et al 2007), which improve resource allocation and increase energy efficiency (Aral and Weill 2007). Digital technologies also help managers monitor the dynamics between producers, consumers, and suppliers to facilitate the adjustment of their production schedules and achieve an efficient allocation of resources (Kotabe et al 2008). For example, Lu et al (2020) found that digital technologies can promote the flow of knowledge, skills, and capital.
There is an increasing amount of studies being conducted on the relationship between resource allocation and carbon emissions. Based on resource allocation theory (Hsieh and Klenow 2009), resource mismatch affects firms' production performance and environmental governance (Brandt et al 2013). Hao et al (2020) analyzed provincial panel data from 30 Chinese provinces from 2005 to 2016 and found that resource mismatch (capital and labor) can reduce the energy efficiency of a region and its adjacent regions. It follows that more efficient resource allocation leads to greater energy efficiency. Similarly, Du and Li (2021) found that the misallocation of land resources increased pollution emissions from firms because of over-investment and production inefficiency.
Based on the above literature, we proposed the following hypothesis (H2; figure 1): Efficient resource allocation further increases the reduction in carbon emissions associated with the digital economy.
3. Data and model design
3.1. Sample data
In this study, we used a sample of listed Chinese manufacturing companies from 2011 to 2019. The companies' financial data were obtained from the China Securities Market and Accounting Research Database and Wind databases. Carbon footprint data were obtained from the China Energy Statistical Yearbook and Industrial Statistical Yearbook. City-specific variables were obtained from the China City Statistical Yearbook. Excluding companies with a significant lack of data, we analyzed 10,934 annual datapoints.
3.2. Variables
3.2.1. Dependent variable: corporate carbon emission intensity(CEI)
According to the Intergovernmental Panel on Climate Change (2006), total carbon emissions( ) is the sum of direct and indirect carbon emissions originating from fossil fuel combustion (
 ) and industrial processes (
 ), respectively, as shown in the following equation(Wu et al
2019):
), respectively, as shown in the following equation(Wu et al
2019):

Carbon emissions originating from fossil fuel combustion in each sector were calculated according to the methodology of Shan et al (2018) using the following equation:

where  represents carbon emissions from the consumption of all types of energy in a given sector j (Mt CO2);
  denotes the consumption of energy type e by the corresponding sector j (t);
  is the net calorific value of energy type e (pJ/
 t);
t);  represents carbon emissions per unit of net calorific value (ton C/TJ); and
  is the rate of carbon oxidation (unit of measurement).
Carbon emissions originating from industrial production processes include carbon indirectly produced by various reactions (physical or chemical). They were calculated using the following equation:

where  is the sum of indirect carbon emissions associated with sector j;
  is the production of good m by sector j (unit of measurement); and
  is the carbon emission factor of sector j in the production of good m (Wei et al
2022).
is the carbon emission factor of sector j in the production of good m (Wei et al
2022).
We subsequently calculated sub-sectoral carbon emissions at the firm level based on the approach of Ren et al (2022) using the following equation:

where  represents the carbon emissions of corporation i;
  denotes the total carbon emissions of the corresponding sector j;
  denotes the operating costs of corporation i; and
  is total cost of business of sector j (Shen and Huang 2019).
Lastly, we applied the traditional method of measuring carbon emission intensity at the macro level to the firm level (Zhang et al 2020) using the following equation:

where  is the carbon emission intensity of corporation i in year t;
  denotes the carbon emissions of corporation i; and
  is the operating income of corporation i.
3.2.2. Independent variable: digital economy
We analyzed data from individual firms in relation to digital economy data from the firm's registered location. To that end, we selected telecommunication business revenue, computer-based information transmission services and software, households with broadband internet access, mobile phone subscribers, and the financial inclusion index to measure the variable of the city-level digital economy using principal component analysis. The financial inclusion index was derived from the Peking University China Digital Financial Inclusion Index (Guo et al 2020).
3.2.3. Mediation variables: resource allocation(RA)
We used resource misallocation to measure the mediating variable of a firm's resource allocation. Resource misallocation was measured using the variance of a firm's total productivity factor (LP method; Wang et al 2021, Yang et al 2022). Sufficiently free-flowing resources were deemed 'efficiently allocated' and in a state of Pareto optimality (Bian et al 2019). In contrast, higher misallocation rates corresponded to less efficient resource use.
3.2.4. Control variable
Consistent with the study by Li et al (2022), we used six control variables: firm age (the natural logarithm of firm age), firm size (the natural logarithm of firm staff), return on assets (net profit after tax as a percentage of total assets), R&D investment intensity (R&D investment as a percentage of operating income), debt ratio (total liabilities as a percentage of total assets), and fixed asset ratio (net fixed asset as a percentage of total assets).
3.3. Model design
We used the following double fixed-effect model to determine the effect of the digital economy on carbon emissions:

where CEI is the carbon emission intensity. DE is the digital economy. Control is control variables.  and
and  are vectors of a firm i and year t, respectively, employed as dummy variables to minimize the influence of un-observable factors on regression results (Lee and Nelder 2009).
To test the mediating role of resource allocation in the relationship between the digital economy and carbon emissions, the following model was developed.


4. Results and discussion
4.1. Descriptive statistics
Table 1 shows the statistical summary of each variable. The mean, minimum, and maximum values of carbon emission intensity were 0.211, 0.002 and 4.357, respectively. This indicates that carbon emission intensity differs between enterprises, the majority of which had a low corresponding value. The mean, minimum, and maximum values of the digital economy were 10.053, 6.092 and 12.803, respectively, indicating that although the digital economy is unequally developed across China, most regions are at a higher level of development. The multicollinearity test found that the mean VIF value was 1.96, which is less than 10 and indicates that there is no multicollinearity.
Table 1. Descriptive statistics.
| Variables | Obs | Mean | Std. Dev. | Min | Max |
|---|---|---|---|---|---|
| CEI | 11,150 | 0.211 | 0.619 | 0.002 | 4.357 |
| DE | 11,150 | 10.053 | 1.272 | 6.092 | 12.803 |
| RA | 10,934 | 0.520 | 0.163 | 0.007 | 1.383 |
| Age | 11,150 | 2.763 | 0.368 | 1.099 | 3.951 |
| Size | 11,150 | 7.845 | 1.100 | 5.598 | 10.441 |
| ROA | 11,150 | 0.037 | 0.076 | −2.646 | 0.381 |
| RD | 11,150 | 0.041 | 0.033 | 0 | 0.155 |
| Lev | 11,150 | 0.403 | 0.192 | 0.064 | 0.845 |
| Fix | 11,150 | 0.236 | 0.138 | 0.0002 | 0.810 |
4.2. Baseline regression
Table 2 shows the results of the baseline regression with the stepwise addition of control variables. It is evident that the digital economy significantly reduced corporate carbon emission intensity. As seen in column 7, the coefficient of the digital economy was −0.0454 at the 1% significance level. This means that for every 1% increase in the digital economy, corporate carbon emission intensity decreased by 0.0454%. This supports hypothesis H1.
Table 2. Baseline regression results.
| (1) | (2) | (3) | (4) | (5) | (6) | (7) | |
|---|---|---|---|---|---|---|---|
| Variable | CEI | CEI | CEI | CEI | CEI | CEI | CEI |
| DE | −0.0475 a | −0.0468 a | −0.0469 a | −0.0463 a | −0.0452 a | −0.0456 a | −0.0454 a |
| (0.003) | (0.003) | (0.003) | (0.003) | (0.003) | (0.003) | (0.003) | |
| Age | 0.057 a | 0.0579 a | 0.053 a | 0.049 a | 0.044 a | 0.044 a | |
| (0.011) | (0.011) | (0.011) | (0.011) | (0.011) | (0.011) | ||
| Size | −0.003 | −0.001 | −0.003 | −0.013 a | −0.013 a | ||
| (0.004) | (0.004) | (0.004) | (0.004) | (0.004) | |||
| ROA | −0.390 a | −0.391 a | −0.291 a | −0.288 a | |||
| (0.050) | (0.050) | (0.053) | (0.054) | ||||
| RD | −0.445 a | −0.315 b | −0.312 b | ||||
| (0.140) | (0.142) | (0.142) | |||||
| Lev | 0.123 a | 0.123 a | |||||
| (0.025) | (0.025) | ||||||
| Fix | 0.017 | ||||||
| (0.032) | |||||||
| C | 0.685 a | 0.534 a | 0.558 a | 0.566 a | 0.596 a | 0.625 a | 0.621 a |
| (0.034) | (0.045) | (0.052) | (0.052) | (0.053) | (0.053) | (0.053) | |
| Firm | Yes | Yes | Yes | Yes | Yes | Yes | Yes |
| Year | Yes | Yes | Yes | Yes | Yes | Yes | Yes |
| Obs | 11,150 | 11,150 | 11,150 | 11,150 | 11,150 | 11,150 | 11,150 |
| R-sq | 0.600 | 0.601 | 0.601 | 0.603 | 0.604 | 0.604 | 0.604 |
a indicates significance at the p < 0.01. b indicates significance at the p < 0.05. c indicates significance at the p < 0.1.
4.3. Mediating role of resource allocation
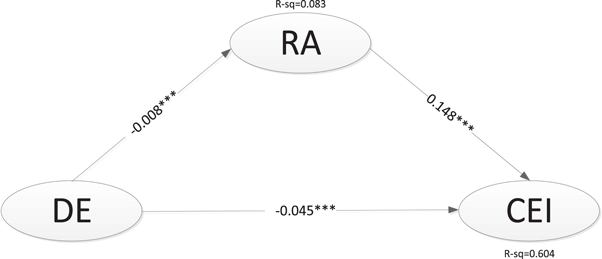
Figure 2 shows the pathways of action of the digital economy. The impact of the digital economy on resource misallocation was −0.008 at the 1% significant level. The effect of resource misallocation on the carbon emission intensity of firms was 0.148 at the 1% significant level. The direct effect of the digital economy on the carbon emission intensity of firms was −0.045 at the 1% significant level. Therefore, resource misallocation increased carbon emission intensity, thereby partially undermining the reduction in carbon emission intensity caused by the digital economy. As determined using the Sobel test  the indirect effect of the digital economy was −0.00125 (p < 0.001). Lastly, as determined using 1,000 bootstraps, the stability of the mediation model was −0.00118 (p < 0.001). This is consistent with hypothesis H2.
Figure 2. Pathways of action of the digital economy.
Download figure:
Standard image High-resolution image
4.4. Robustness of the model
In table 3, columns 1 and 2 show the regression results after replacing the original dependent variable (carbon emission intensity) with the natural logarithm of carbon emissions as the new dependent variable. Columns 3 and 4 show the robustness of the model after excluding provincial capitals, which receive more policy support (Liu et al 2020). Column 5 shows the regression results obtained using the instrumental variables approach to determine endogeneity. To that end, we used the number of post offices per million people in each city as the instrumental variable (Ma and Zhu 2022). Columns 6 and 7 show the regression results obtained using the two-stage method to test for selection bias. Firms may consider their own corporate characteristics and city-related factors to determine their place of incorporation, which can lead to selection bias. Table 3 shows that the instrumental variables selected were valid and that there was selection bias. Using these four methods, we found that the regression results were plausible.
Table 3. Robustness test.
| Substitution of dependent variable | Exclude provincial capitals | IV | Two-stage method | ||||
|---|---|---|---|---|---|---|---|
| (1) | (2) | (3) | (4) | (5) | (6) | (7) | |
| Variables | RA | CE | RA | CEI | CEI | DE | CEI |
| RA | 0.552 a | 0.102 a | |||||
| (0.068) | (0.023) | ||||||
| DE | −0.008 a | −0.058 a | −0.010 a | −0.040 a | −0.258 a | −0.022 a | |
| (0.001) | (0.009) | (0.002) | (0.003) | (0.099) | (0.008) | ||
| Lamda | 0.330 a | ||||||
| (0.103) | |||||||
| C | 0.822 a | 1.675 a | 0.816 a | 0.463 a | 0.062 | 0.252 b | |
| (0.022) | (0.164) | (0.027) | (0.055) | (0.138) | (0.123) | ||
| Control | Yes | Yes | Yes | Yes | Yes | Yes | Yes |
| Firm | Yes | Yes | Yes | Yes | Yes | Yes | Yes |
| Year | Yes | Yes | Yes | Yes | Yes | Yes | Yes |
| Under identification test | 54.221 a | ||||||
| Weak identification test | 54.728 | ||||||
| Obs | 10,934 | 10,934 | 7,230 | 7,230 | 6329 | 11,150 | 10,934 |
| R-sq | 0.083 | 0.770 | 0.099 | 0.655 | 0.099 | 0.940 | |
a indicates significance at the p < 0.01. b indicates significance at the p < 0.05. C indicates significance at the p < 0.1.
4.5. Effect of government regulation and market drivers
Considering that the digital economy is affected by both government regulation and market forces, we introduced two variables: government intervention and market drivers. We used city-level fiscal expenditure as a percentage of regional GDP to measure government intervention (Huang and Du 2017). We developed a city-level marketization index evaluation system based on a study by He and Wu (2017), which was then compared with firm data.
In table 4, columns 1 and 2 show the regression results after incorporating government intervention. The coefficient of the digital economy was −0.007 at the 1% significance level and the coefficient of the quadratic term ( ) was 0.001 at the 1% significance level. This means that government intervention decreases the ability of the digital economy to reduce resource misallocation and, by extension, carbon emission intensity. Columns 3 and 4 show the regression results after the inclusion of market drivers. The coefficient of the digital economy was −0.007 at the 1% significance level and the coefficient of the quadratic term (
 ) was −0.0003 at the 10% significance level. This implies that the market improves the ability of the digital economy to reduce resource misallocation and, by extension, carbon emission intensity. Lastly, columns 5 and 6 show the regression results obtained when both government intervention and market drivers were considered, which was consistent with the previous findings.
Table 4. Moderating role of government intervention and market driven.
| (1) | (2) | (3) | (4) | (5) | (6) | |
|---|---|---|---|---|---|---|
| Variables | RA | CEI | RA | CEI | RA | CEI |
| RA | 0.144 a | 0.147 a | 0.142 a | |||
| (0.024) | (0.024) | (0.024) | ||||
| DE | −0.007 a | −0.035 a | −0.007 a | −0.037 a | −0.007 a | −0.031 a |
| (0.001) | (0.004) | (0.002) | (0.004) | (0.002) | (0.004) | |
 Goi Goi | 0.001 b | 0.008 a | 0.001 c | 0.005 a | ||
| (0.0004) | (0.001) | (0.0005) | (0.001) | |||
 Mad Mad | −0.0003 c | −0.003 a | −0.001 c | −0.027 a | ||
| (0.0004) | (0.001) | (0.001) | (0.003) | |||
 Mad Mad | −0.0008 | −0.015 a | ||||
| (0.001) | (0.002) | |||||
| C | 0.827 a | 0.555 a | 0.815 a | 0.437 a | 0.823 a | 0.439 a |
| (0.022) | (0.058) | (0.024) | (0.064) | (0.026) | (0.067) | |
| Firm | Yes | Yes | Yes | Yes | Yes | Yes |
| Year | Yes | Yes | Yes | Yes | Yes | Yes |
| Obs | 10,922 | 10,922 | 10,926 | 10,926 | 10,922 | 10,922 |
| R-sq | 0.084 | 0.606 | 0.083 | 0.605 | 0.084 | 0.609 |
a indicates significance at the p < 0.01 b indicates significance at the p < 0.05 c indicates significance at the p < 0.1.
4.6. Discussion
This study makes several contributions to the literature on digital economy and carbon emissions. First, our results indicate that the digital economy can significantly reduce corporate carbon emission intensity at the micro level. This is consistent with the findings of Ma et al (2022), who demonstrated that the digital economy can reduce urban carbon emissions. One possible explanation for this is that the digital economy may help traditional industries to access external resources, which can be used to transform processes and upgrade technology in ways that reduce their carbon intensity. Alternatively, the digital economy often changes traditional business models in a way that reduces the waste of non-essential resources, thereby decreasing carbon emissions linked to production and services. Due to one or both of these processes, these results provide strong evidence for policymakers and business managers.
Second, this study shows that resource allocation has a significant impact on the relationship between the digital economy and corporate carbon emission intensity. Specifically, the digital economy improves resource allocation and resource utilization efficiency, thereby decreasing carbon emission intensity. The use of digital technologies, such as big data, the Internet of Things, and robotics can help business managers to monitor real-time changes related to product production, sales, and supply, which would facilitate the adaptation of their strategies for improved resource utilization efficiency (Ulas 2019). Furthermore, digital technology can promote technological innovation, which improves resource allocation efficiency (Brissimis et al 2010). In contrast, higher degrees of resource mismatch corresponded to higher corporate carbon emission intensity. One possible explanation for this is that resource misallocation is linked to the over-allocation of labor and under-allocation of capital, which reflects distortions in factor markets (Jefferson et al 2006). Such distortions can affect industrial structures and technological upgrades, which in turn affect energy efficiency (Lv et al 2017).
Third, we found that market driver and government intervention improved and hindered the ability of the digital economy to decrease corporate carbon emission intensity, respectively. This is consistent with the findings of most studies (Joo et al 2018, Zhao et al 2018). Government intervention often works against the profit goal of firms in favor of political objectives, which can lead to inefficient resource allocation (Chen et al 2011). The influence of market drivers is linked to the free movement of market factors (Leys 2001). This allows firms to break down organizational boundaries and gain access to external support, such as capital and technology, to improve resource allocation efficiency and thus reduce carbon emissions (Pundziene et al 2021).
5. Conclusions, recommendations and limitations
This study analyzed the impact of the digital economy on the carbon emissions of individual businesses and the mediating role of resource allocation in this relationship. The main findings of this analysis were as follows: (1) the digital economy significantly reduced corporate carbon emission intensity; (2) the digital economy reduced resource misallocation, which in turn reduced carbon emission intensity; and (3) market drivers improved the ability of the digital economy to reduce corporate carbon emission intensity, whereas government intervention had an opposing effect.
Based on these findings, we make the following policy recommendations for developing countries. First, the government should invest in the development of digital technologies, such as the Internet, Internet of Things, big data, and the sharing economy, to facilitate corporate digitization. In addition, the government should establish and/or improve information flow and cyber security systems. Second, corporate management should use digital technologies, such as robotics, cloud computing, and the blockchain, to monitor dynamic changes in production lines and sales to improve energy efficiency. The government should therefore prioritize the development of green finance systems to support such corporate transformation. Finally, the government should minimize direct intervention in business operations and defer to the self-regulation of the market economy.
In conclusion, this study had several limitations. First, it was difficult to determine spillover effects at the firm level, as this study utilized unbalanced panel data. This study focused exclusively on resource allocation as a mediating factor in the relationship between the digital economy and carbon emissions. Second, this study focused exclusively on resource allocation as a mediating factor in the relationship between the digital economy and carbon emissions, without considering the potential roles of technological innovation, R&D investment, and the energy structure. Finally, this study did not account for corporate and regional heterogeneity. Therefore, future research should focus on these aspects to further explore the effects of the digital economy on carbon emissions at the micro level.
Data availability statement
The data that support the findings of this study are available upon reasonable request from the authors.
Competing interests
The author declare that they have no competing interests
Funding
The author declare that this research was not funded