
Abstract
Magnesium alloys have wide application in aerospace and automotive industries due to their high strength to weight ratio and desired mechanical properties. In this present research, the effects of three input parameters of the wire electrical discharge machining (WEDM) process, including pulse on time, pulse current, and servo feed rate were studied on the performance characteristics namely; material removal rate, kerf width, and surface roughness during machining of AZ91 magnesium alloy. This research is the first comprehensive study of the electrical discharge machining of magnesium alloys and aims to analyses the machinability and behavior of materials with low melting point and high thermal conductivity during WEDM. For this purpose, 15 experiments were designed by the design of experiments technique. Using response surface methodology, mathematical models were developed and the contribution percentage of each variable input parameter on output parameters was found. Analysis of variance results revealed that pulse on time and pulse current have the most effect on process output parameters, respectively, while the effect of the servo feed rate was insignificant. The experimental results showed that the material removal rate and the kerf width during the WEDM of magnesium is considerably higher than hard materials and it can be reached to about 180 mm3 min−1 while kerf width and surface roughness are about 0.450 and 4.683 μm, respectively. Despite the high cutting rate, the surface roughness is appropriate and comparable to hard materials, indicating high machinability of magnesium alloys by WEDM. To study the surface topography and microstructural changes, atomic force microscope, scanning electron microscope and EDX analysis have been used. SEM micrographs show that the number of microcracks, indicating the surface damage, is low in the machined surface which shows WEDM capability in producing non-damaged work surfaces. The maximum recast layer thickness is about 6.91 μm and minimum is 3.09 μm.
Export citation and abstract BibTeX RIS
1. Introduction
Magnesium alloys, along with aluminum and titanium alloys, are lightweight materials that have attracted more attention in the automotive and aerospace industry for fuel consumption reduction due to their high strength to weight ratio. In the automotive industry, magnesium alloys are used in parts such as body, chassis, gearbox and internal components. The weight reduction of the car structure does not only reduce fuel consumption but also increases vehicle control and acceleration [1, 2].
Furthermore, the use of magnesium alloys in the fabrication of medical equipment has been expanding as a result of biocompatibility [3]. The AZ91 alloy is the most widely used magnesium alloy, which has good corrosion resistance and castability in addition to high strength to weight ratio [4]. However, this alloy application is limited because of high processing costs, low workability due to hexagonal close-packed (HCP) structure and mechanical properties losing at elevated temperatures [5]. Although the machinability of magnesium alloys by conventional machining processes is high due to their physical and mechanical properties, but when it is needed to reach the desired dimension with the least material elimination or complex and 3D intricate shapes production with high geometrical accuracy and productivity, tradition machining processes are insufficient in terms of precision and efficiency, hence non-traditional machining methods should be developed.
Wire Electrical Discharge Machining (WEDM) is a thermo-electric based advanced machining process, which widely used in mold and tool fabrication, aerospace, automotive and other advanced industries both in macro and micro scales. WEDM has been proved its ability in machining of hard to cut materials with poor machinability such as conductive ceramics, titanium, and superalloys in addition to the fabrication of complex shapes with high dimensional accuracy. In this non-tradition process, the occurrence of controlled electrical discharges in a gap between a thin wire and conductive work piece (with an electrical resistance less than 100 Ohm cm−1) in the presence of dielectric fluid results in material removal via fusion and vaporization [6]. In comparison to mechanical machining methods such as broaching, in this process sparks play the role of cutting edges of the cutting tool. Unlike the Die-Sink EDM process, the deionized water is used as a dielectric medium in the WEDM process due to its low viscosity and high cooling rate [7]. Figure 1 shows the schematic of the WEDM process. In WEDM, the non-contact material removal mechanism causes to the elimination of machining forces, tool vibration, chatter, and mechanical residual stresses during cutting [8]. Despite the noted advantages, the WED machined surfaces undergoing undesirable metallurgical changes. Erosion based nature of the process results in the generation of thermal residual stresses, heat affected zone (HAZ), recast layer and altered microstructure in the machined component. These defects lead to reduce mechanical properties and mechanical stability such as fatigue strength [9].

Figure 1. Schematic of wire electrical discharge machining process.
Download figure:
Standard image High-resolution imageIn electrical discharge machining, to obtain high productivity with minimum surface damage, it is needed to set the input parameters properly. To study the effect of the input parameters of WEDM on the performance characteristics during machining of different materials, many studies have been carried out and optimal parameters have been developed based on statistical and mathematical techniques. Using Taguchi method, Caydas and Ay [10] studied the effects of cutting parameters on the cutting quality during machining of inconel 718 superalloy. Their experimental results indicated that the pulse current and pulse on time have the greatest effect on the cutting rate, surface roughness, and kerf width. Sharma et al [11] evaluated the material removal rate and surface characteristics of the inconel 706 during WEDM. The results of their investigation showed that the optimal values for wire feed rate and dielectric pressure were 6 m/min and 1.96 bar, respectively, and as these values increased, wire vibration comes into play and affects the process. In WEDM, to increase the process stability and dimensional accuracy, the wire tension must be high enough not to be flammable due to external forces. Using the response surface methodology (RSM) and the CCD design, Mouralova et al [12] developed the correlation between cutting speed and surface roughness during WEDM of 16MnCr5 steel. Antar et al [13] reported that zinc-coated copper wires utilizing during the machining of the Ti6264 alloy increased the productivity of process up to 70% compared to standard uncoated brass wires. Pramanik et al [14] conducted an experimental work on the 6061 aluminum alloy WEDM taking into account the pulse on time and wire tension as process variables. From previous studies Li et al [15, 16] it is concluded that several passes with low spark energy (trim-cut) in WEDM improves the surface integrity and results in the elimination and reduction of generated micro cracks, micro cavities, recast layer, splashes, and residual stresses.
As can be seen in the review section, most of the WEDM studies have been performed on materials with a high modulus of rigidity and melting point and low thermal conductivity. To achieve sufficient performance characteristics in WEDM it is needed to select input parameters accordance with the nature of the material [17] and due to the expansion increasing of this process, it is necessary to study the behavior of various materials with different properties such as soft materials like magnesium alloys during electrical discharge machining. This paper presents the first comprehensive research on the WEDM of magnesium alloys and aims to study the influence of selected input parameters namely; pulse on time, pulse current and servo feed rate on material removal rate (MRR), kerf width (KRFW) and surface roughness (SR) in addition to evaluation of microstructural, metallurgical changes and Surface integrity of machined surfaces. Doing this research, leads to a better understanding of the behavior of materials with low hardness, melting point, elastic modulus, and high thermal conductivity during thermo-electric based machining processes.
2. Experimental procedure
2.1. Material
In this investigation, AZ91 magnesium alloy was used as experimental material [18]. This alloy is produced by die casting. Die casting process is one of the most effective methods for producing magnesium parts especially in the automotive industry. The chemical composition, physical and mechanical properties of AZ91 are presented in tables 1 and 2, respectively. Prior to conduct the WEDM experiments, the work piece dimension reached the desired dimension (140 * 60 * 14 mm) by the grinding process.
Table 1. Chemical composition of AZ91 magnesium alloy (Wt%).
| Element | Al | Zn | Mn | Si | Si | Fe | Cu | Ni | Be | Mg | |
|---|---|---|---|---|---|---|---|---|---|---|---|
| Wt% | Min | 8.5 | 0.45 | 0.17 | 0.025 | 0.025 | 0.04 | 0.0005 | Bal. | ||
| Max | 9.5 | 0.9 | 0.4 | 0.08 | 0.08 | 0.025 | 0.001 | 0.003 |
Table 2. Physical and mechanical properties of AZ91.
| Property | Value |
|---|---|
| Density | 1.81 g cm−3 |
| Melting point range | 470 °C–595 °C |
| Electrical resistance | 170 nΩ m |
| Thermal conductivity | 72 W m−1 k |
| Specific heat capacity | 1.25 kJ kg−1K−1 |
| Modules of elasticity | 45 Gpa |
| Tensile strength | 230 Mpa |
| Yield strength | 150 Mpa |
| Elongation (in 2 inch) | 3% |
| Hardness | 63 HB |
2.2. Machining conditions
The machining process was performed on the 310 Robofil Charmilles Technologies WEDM machine. This machine uses isopulse type generator. In this experimental investigation, three parameters of the WEDM process including pulse on time (TON), pulse current (IP) and servo feed rate (SF) were considered as variable input parameters. The levels and values of these variable parameters are shown in table 3. The constant parameters of machining are presented in table 4. Selected parameters values were chosen from prior experiences and based on device capacity. Zinc coated brass wire with 0.25 mm diameter was used as electrode tool while de-ionized water used as a dielectric fluid. The EDX analysis of the wire electrode is shown in figure 2. During cutting of each sample, the cutting speed (V) was obtained from machine monitor and recorded after that machining conditions reached steady state. The cutting length was 40 mm in all experiments.
Table 3. Variable input parameters and their levels.
| Levels and values | ||||
|---|---|---|---|---|
| Parameter | Symbol | −1 | 0 | 1 |
| Pulse on time (μs) | Ton | 0.2 | 0.7 | 1.2 |
| Pulse current (A) | IP | 4 | 8 | 12 |
| Servo feed rate (mm/min) | SF | 6 | 9 | 12 |
Table 4. Constant machining parameters during WEDM.
| Parameter | Value |
|---|---|
| Open circuit voltage (V) | −80 |
| Machining voltage (V) | 40 |
| Pulse off time (μs) | 6 |
| Wire speed (m/min) | 6 |
| Wire tension (N) | 12 |
| Injection pressure (Bar) | 2 |
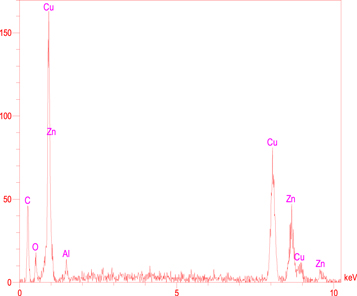
Figure 2. EDX analyses of wire electrode.
Download figure:
Standard image High-resolution image2.3. Design of experiments
In order to reduce the number of experiments needed to examine the effect of input parameters on output parameters and analysis of results, the design of experiments (DOE) technique and statistical analyses were used. To do that, the response surface methodology (RSM) with the Box-Behnken design was employed in this study. In the RSM, statistical and mathematical techniques are used for experimental modeling and expression of the correlation between an output variable (response variable) with one or more input variables (independent variables). Also, by using ANOVA, the contribution content of each input parameter on the output parameter can be found [19]. Design of experiments and analyzing of the results were done with the help of Design Expert 10 software. Overall 15 experiments with 3 factors in 3 levels were conducted. The DOE run order with experimental results of 3 response variables including MRR, KRFW, and SR is shown in table 5.
Table 5. Design of experiments and results for output parameters.
| Std | Run | A:T_On (μs) | B:IP (A) | C:SF (mm min−1) | MRR (mm3 min−1) | KRFW (mm) | SR (μm) |
|---|---|---|---|---|---|---|---|
| 6 | 1 | 0.2 | 8 | 6 | 47.8085 | 0.340 | 2.779 |
| 13 | 2 | 0.7 | 4 | 6 | 71.0108 | 0.396 | 3.923 |
| 3 | 3 | 0.7 | 12 | 12 | 81.389 | 0.403 | 4.150 |
| 2 | 4 | 1.2 | 8 | 6 | 152.381 | 0.435 | 4.501 |
| 14 | 5 | 0.7 | 8 | 9 | 72.9827 | 0.40 | 4.078 |
| 7 | 6 | 1.2 | 8 | 12 | 162.623 | 0.436 | 4.471 |
| 8 | 7 | 0.7 | 12 | 6 | 80.0949 | 0.41 | 4.245 |
| 1 | 8 | 0.7 | 8 | 9 | 75.6389 | 0.401 | 4.12 |
| 9 | 9 | 1.2 | 12 | 9 | 179.874 | 0.450 | 4.683 |
| 15 | 10 | 0.2 | 12 | 9 | 49.6164 | 0.35 | 2.939 |
| 11 | 11 | 1.2 | 4 | 9 | 116.701 | 0.430 | 4.378 |
| 5 | 12 | 0.7 | 8 | 9 | 69.7647 | 0.398 | 4.068 |
| 10 | 13 | 0.2 | 4 | 9 | 46.706 | 0.33 | 2.505 |
| 4 | 14 | 0.2 | 8 | 12 | 47.1241 | 0.336 | 2.666 |
| 12 | 15 | 0.7 | 4 | 12 | 77.0194 | 0.39 | 3.824 |
2.4. Equipment used
The kerf width was measured by an optical microscope with a resolution of 0.001 mm. Kerf was measured at three different places and their average was taken as a final response. The surface roughness was measured using 'Perthometer-M2, Mahr, Germany' device. Average roughness (Ra) which is common in manufacturing and production was used to the expression of surface roughness. Surface roughness was measured at 5 different positions and their average value was reported as Sr 3D images obtained by the Atomic Force Microscope (AFM) were used to examine the topography of machined surfaces. To do that 'Nanosurf Mobile S' device was used. Scanning electron microscope (SEM) images and EDX analysis were used to investigate the microstructure and metallurgical changes at the WED machined surface. To recast layer observation, the cross-section of WED machined surface was polished with 336 to 1500 SiC papers. SEM images were achieved by 'MIRA3- FEG, Tescan, Czech Republic'.
3. Result and discussion
3.1. Evaluation of material removal rate
The MRR in the electrical discharge machining process indicates the process productivity. The main limitation of this process, which in some cases prevents competition with other machining methods, such as broaching, is the low rate of cutting. Equation (1) was used to obtain MRR.

Figure 3 shows the response surface plots for the MRR. It is obvious in figure 3(a) that the MRR increases with the increase in pulse on time and pulse current. In this process, the amount of material removal per spark depends on the thermal energy of spark. As the energy of the sparks increases, the amount of applied heat to the work piece increases and more volume of the material melts and evaporates which resulting in high MRR [10]. The energy of the sparks is calculated from equation (2).

Where, Ton = pulse duration (s),I = pulse current (A),V = machining voltage (V), andE = spark energy (J)

Figure 3. Response surface plots of MRR versus (a) Ton, IP; (b) Ton, SF; (c) IP, SF.
Download figure:
Standard image High-resolution imageAccording to equation (2), with the increase in pulse current and pulse on time the thermal energy of sparks and the intensity of heat will be increased and consequently more amount of workpiece material will be melted from the workpiece. Figures 2(b) and (c) show that the servo feed rate does not have an effect on the MRR since the applied thermal energy to the workpiece have no relation with the servo feed rate. Table 6 presents the analysis of variance (ANOVA) table for MRR. According to the presented data, the effect of factors A, B, AB, and A2 on the MRR is significant because the P-value is less than 0.05 and the pulse on time has the greatest effect on the material removal rate due to 84.14% contribution in MRR. This phenomenon can be explained by the fact that because of high thermal conductivity of magnesium alloys heat is distributed rapidly into work material and the increase in sparking time leads to more distribution of heat which in turn causes to more volume of work affected by heat. According to results, during WEDM of magnesium, the MRR (thickness = 14 mm) reaches to 180 mm3 min−1, while according to Soundararajan et al [8] maximum material removal rate in A413 aluminum alloy (thickness = 15 mm) was 36.241 mm3 min−1 and almost 6 mm3 min−1 in IN706 superalloy (thickness = 10 mm) based on Sharma et al [11]. The main reasons for this difference could be due to low melting point and a high thermal conductivity of magnesium alloys. According to these results, the use of wire-cut in mass production of magnesium parts can be promising due to the high cutting rate. Equation (3) expresses the predicted mathematical model for MRR.

Table 6. ANOVA table for material removal rate.
| Factor | Sum of square | df | F Value | P-value | Contribution % |
|---|---|---|---|---|---|
| Model | 26248.19 | 9 | 35.28 | 0.0005 | 100 |
| A- Ton | 22084.25 | 1 | 267.18 | < 0.0001 | 84.14 |
| B- IP | 790.77 | 1 | 9.57 | 0.0271 | 3.01 |
| C- SF | 35.55 | 1 | 0.43 | 0.5409 | 0.13 |
| AB | 907.90 | 1 | 10.98 | 0.0211 | 3.45 |
| AC | 29.83 | 1 | 0.36 | 0.5742 | 0.11 |
| BC | 5.56 | 1 | 0.067 | 0.8058 | 0.02 |
| A2 | 2357.22 | 1 | 28.52 | 0.0031 | 8.98 |
| B2 | 0.097 | 1 | 1.173E-003 | 0.9740 | 0.00 |
| C2 | 72.17 | 1 | 0.87 | 0.3930 | 0.27 |
| Residuals | 413.29 | 5 | |||
| Lack of Fit | 395.98 | 3 | 15.25 | 0.0621 | |
| Pure Error | 17.31 | 2 | |||
| Cor Total | 26248.19 | 14 |
R-Squared = 0.9845, Adj R-Squared = 0.9566, Pred R-Square = 0.7609.
3.2. Evaluation of kerf width
The width of the formed kerf in the WEDM process through the wire transition indicates the dimensional accuracy of the process [20]. In WEDM, in order to avoid short circuit and also dielectric fluid injection into the cutting area, there is a need for a gap between the wire and the work piece. Due to the specific distance between the wire and work piece sides, the width of the slit that will be created after the wire transition will be larger than the wire diameter. The kerf width is calculated from equation (3).

Figure 4 shows the kerfs created in 6 samples of the experiments. It is clear from these images that the maximum kerf width is related to figure 4((b); ninth experiment) and the lowest kerf width is related to figure 4((f); thirteenth experiment). In these samples, the maximum and minimum thermal energy have been applied to the work piece, respectively. By comparing figure 4((a); tenth experiment) and figure 3((b); ninth experiment), it is obvious that by increasing the pulse on time, the kerf width increases. Also, the comparison of figure 4((c); third experiment) and figure 4((d); fifteenth experiment) shows that increase in pulse current leads to the kerf width increasing whereas figure 4((d); fifteenth experiment) and figure 4((e); seventh experiment) comparison reveals that although there is no significant difference in kerf widths, it could be resulted that increasing in servo feed rate caused kerf width to decrease. These results also can be obtained from figure 6 which indicates the RSM plots of kerf width. From table 7 it is found that pulse on time with 95% contribution in KERW response has the most effect on kerf width. According to ANOVA table for kerf width in addition to factor A factors B and A2 also have a significant effect on kerf width (P-value less than 0.05). Increase in pulse on time and pulse current lead to increase in the depth of heat penetration in to work material and in turn it causes to more material removal from wire sides and large kerf. Similar to material removal rate, the kerf width in magnesium alloy is much higher than the other materials, which results from a low melting point and high thermal conductivity. These results are in perfect agreement with the results presented for WE43 Mg WEDM [7]. The developed mathematical model for kerf width is presented in equation (4).

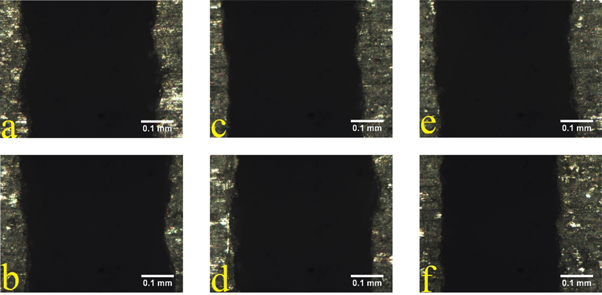
Figure 4. Kerf width in different machining conditions (a) Ton = 0.2 μs, IP = 12 A, SF = 9 mm min−1, (b) Ton = 1.2 μs, IP = 12 A, SF = 9 mm min−1, (c) Ton = 0.7 μs, IP = 12 A, SF = 12 mm min−1, (d) Ton = 0.7 μs, IP = 4 A, SF = 12 mm min−1, (e) Ton = 0.7 μs, IP = 12 A, SF = 6 mm min−1, (f) Ton = 0.2 μs, IP = 4 A, SF = 9 mm min−1.
Download figure:
Standard image High-resolution imageTable 7. ANOVA table for kerf width.
| Factor | Sum of square | df | F Value | P- value | Contribution % |
|---|---|---|---|---|---|
| Model | 0.020 | 9 | 327.40 | < 0.0001 | 100 |
| A- Ton | 0.019 | 1 | 2802.83 | < 0.0001 | 95 |
| B- IP | 3.781E-004 | 1 | 55.74 | 0.0007 | 1.89 |
| C- SF | 1.012E-005 | 1 | 1.49 | 0.2763 | 0.05 |
| AB | 6.250E-006 | 1 | 0.92 | 0.3812 | 0 |
| AC | 6.250E-006 | 1 | 0.92 | 0.3812 | 0.03 |
| BC | 1.600E-005 | 1 | 2.36 | 0.1852 | 0.08 |
| A2 | 4.954E-004 | 1 | 73.03 | 0.0004 | 2.47 |
| B2 | 3.703E-005 | 1 | 5.46 | 0.0667 | 0.18 |
| C2 | 6.564E-006 | 1 | 0.97 | 0.3704 | 0.03 |
| Residuals | 3.392E-005 | 5 | |||
| Lack of Fit | 2.925E-005 | 3 | 4.18 | 0.1991 | |
| Pure Error | 4.667E-006 | 2 | |||
| Cor Total | 0.020 | 14 |
R-Squared = 0.9983, Adj R-Squared = 0.9953, Pred R-Square = 0.9761.
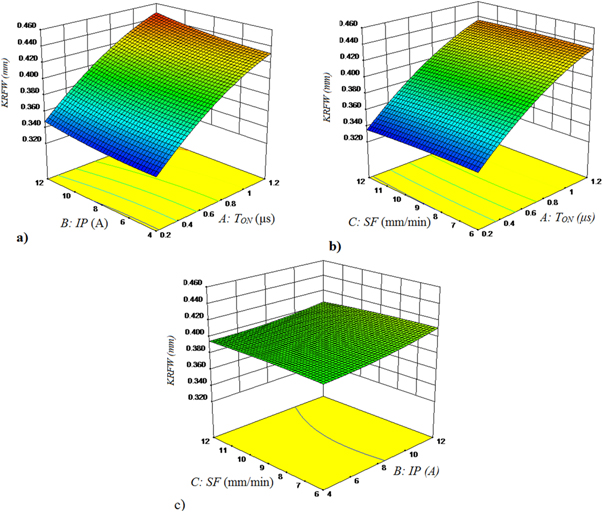
Figure 5. Response surface plots of KRFW versus (a) Ton, IP; (b) Ton, SF; (c) IP, SF.
Download figure:
Standard image High-resolution image3.3. Evaluation of surface roughness
Some of the mechanical and physical properties of machined parts, such as corrosion resistance, friction, fatigue strength and loading capacity depend on the roughness of the machined surface. Therefore, this parameter plays a crucial role in the function of parts. Due to that, one of the most important parameters to determine the machinability of materials is surface roughness. The surfaces machined by the WEDM process are full of micro cavities, and craters. These craters are formed when the sparks hit the work piece. Figures 5(a) to (c) shows the response surface plots of surface roughness. It is found from response plots that SR increases with increase in pulse on time and pulse current whereas slightly decreases with increase in servo feed rate. These results can be explained by the fact that with an increase in pulse current and pulse on time, the intensity of heat and the duration of this amount of applied heat into work piece increases that in turn leads to larger and deeper craters formation on the surface and high surface roughness. ANOVA table for SR (table 8) indicates that pulse on time and pulse current have 86.44 and 3.25% contribution in SR respectively, whereas servo feed rate does not notably affect the surface roughness (0.19% contribution). It seems that increase in servo feed rate leads to decrease in the number of impacted sparks per unit area of the surface and in turn causes to decrease in Sr figures 6(a) and (b) show the surface topography images of WED machined surface obtained by AFM at highest and lowest spark energy, respectively. Generated craters are obvious in these images. It is clear from these images that the surface which machined by high thermal energy (figure 7(a)) has rough surface condition while the specimen which machined by low energy has a fine surface. Predicted mathematical model for SR is presented in equation (5).

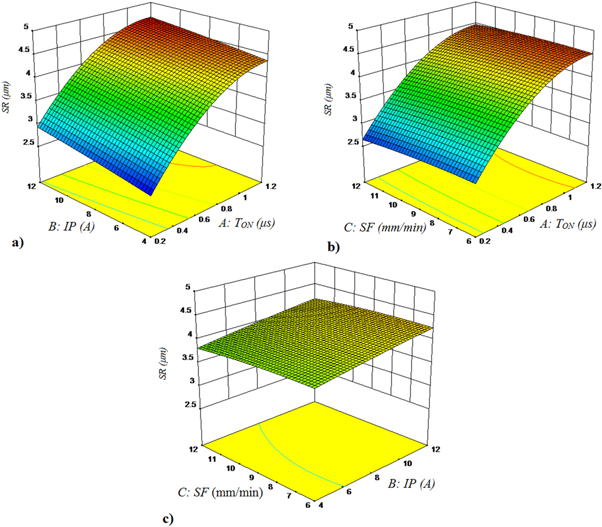
Figure 6. Response surface plots of SR versus (a) Ton, IP; (b) Ton, SF; (c) IP, SF.
Download figure:
Standard image High-resolution imageTable 8. ANOVA table for surface roughness.
| Factor | Sum of square | df | F Value | P- value | Contribution % |
|---|---|---|---|---|---|
| Model | 7.38 | 9 | 1052.34 | < 0.0001 | 100 |
| A- Ton | 6.38 | 1 | 8188.59 | < 0.0001 | 86.44 |
| B- IP | 0.24 | 1 | 308.66 | < 0.0001 | 3.25 |
| C- SF | 0.014 | 1 | 18.22 | 0.0079 | 0.19 |
| AB | 4.160E-003 | 1 | 5.34 | 0.0688 | 0.06 |
| AC | 1.722E-003 | 1 | 2.21 | 0.1972 | 0.02 |
| BC | 4.000E-006 | 1 | 5.134E-003 | 0.9457 | 0.00 |
| A2 | 0.74 | 1 | 946.25 | < 0.0001 | 10.03 |
| B2 | 8.966E-004 | 1 | 1.15 | 0.3324 | 0.01 |
| C2 | 5.215E-003 | 1 | 6.69 | 0.0490 | 0.08 |
| Residuals | 3.895E-003 | 5 | |||
| Lack of Fit | 2.373E-003 | 3 | 1.04 | 0.5246 | 0.03 |
| Pure Error | 1.523E-003 | 2 | |||
| Cor Total | 7.38 | 14 |
R-Squared = 0.9995, Adj R-Squared = 0.9985, Pred R-Square = 0.9944.

Figure 7. Surface topography of WED machined surfaces obtained by AFM (a) Ton = 1.2 μs, IP = 12 A, SF = 9 mm min−1 (b) Ton = 0.2 μs, IP = 4 A, SF = 9 mm min−1.
Download figure:
Standard image High-resolution image3.4. Evaluation of microstructure
The machined surfaces by WEDM are filled with micro cracks, carters, cavities, voids, splashes, melted debris. By applying the enough voltage between the two electrodes (wire and work piece), after dielectric fluid resistance breakage, due to the ionization of the medium molecules, plasma channel is created and the temperature of this channel reaches to 8000 °C–12000 °C, which is enough for melting and evaporation of every material [13]. After the end of pulse on time period and plasma channel collapse, due to the high exploding pressure, a few molten materials are thrown out of the melt hole and flushed away by a dielectric fluid from the machining zone and the remaining melted materials that have not been removed by dielectric are rapidly cooled due to water coolant effect and result in debris, splashes and micro voids formation [21]. Figure 8 shows the SEM images of machined surfaces. It is clear from this images that ninth experiment (figure 8(b)) which has been machined with the highest level of pulse on time and pulse current has the roughest surface condition and the number of micro cavities and amount of debris and splashes is more than the other specimens. Surfaces which machined by the lowest level of pulse on time (figures 8(a) and (f)) have the better and uniform surface condition. By reducing the pulse on time, the duration of applying heat into workpiece reduces and a small amount of material is melted and dielectric fluid flushes the molten material away from machining zone better, so it is expected that the surfaces become more uniform and fine. Comparison of figures 8(c) and (d) results in that increase in pulse current leads to a non-uniform surface with more micro cavities and holes. Increase in pulse current results in an increase in heat intensity which in turn causes to more material fusion however because of constant dielectric liquid pressure and injection rate during all machining condition, dielectric liquid efficiency decreases with increase in more material fusion. Decreasing in dielectric liquid efficiency leads to more debris and splashes generation in the surface. Based on figures 7(c) and (e), there are no significant differences in microstructures which indicate that micro structure condition does not change notably by servo feed rate.

Figure 8. SEM images of WED machined surface microstructure (a) Ton = 0.2 μs, IP = 12 A, SF = 9 mm min−1, (b) Ton = 1.2 μs, IP = 12 A, SF = 9 mm min−1, (c) Ton = 0.7 μs, IP = 12 A, SF = 12 mm min−1, (d) Ton = 0.7 μs, IP = 4 A, SF = 12 mm min−1, (e) Ton = 0.7 μs, IP = 12 A, SF = 6 mm min−1, (f) Ton = 0.2 μs, IP = 4 A, SF = 9 mm min−1.
Download figure:
Standard image High-resolution imageEDX analysis (figure 9) shows the elemental analysis of WED machined surface. As can be seen, in addition to the base metal components, oxygen and carbon are observed and content of Zn and Cu have been increased whereas the content of magnesium and aluminum has been decreased. The presence of oxygen is due to the decomposition of water molecules and the increase in the percentage of copper and zinc elements are due to the transformation of wire materials to the machined surface. In this process, both the cathode and the anode are melted, and when the machining zone is washed, some of the zinc coated brass wire materials are solidified together with the work piece materials at the sample surface and resulted in Cu and Zn reaching. In WED machined surfaces thermal induced micro cracks are produced because of high-temperature sparks. It is worth to say that as seen in microstructure images the number of these micro cracks even in high thermal sparks energy is low. The main reason for this phenomena could be high thermal conductivity of magnesium alloy that prevents thermal energy concentration on the surface.
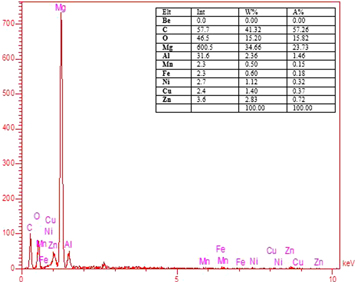
Figure 9. EDX analyses of WED machined surface (Ton = 1.2 μs, IP = 12 A, SF = 9 mm min−1).
Download figure:
Standard image High-resolution image3.5. Evaluation of recast layer
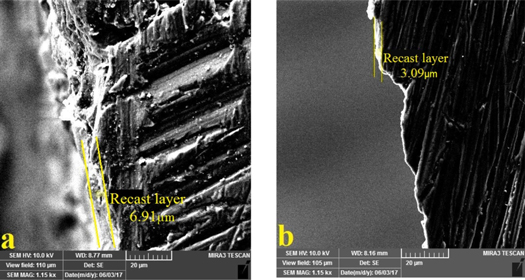
The main feature of WED machined parts is the presence of a thin white layer on the surface of the parts. After the electrical discharge, it is not possible to remove all molten material from the melt hole, and the remaining materials are re-solidified by a dielectric fluid and lead to the formation of a recast layer on the top surface of the work piece [22]. The thickness of this layer is non-uniform throughout the surface. Figure 10 shows the depth of recast layer in 2 samples (ninth and thirteenth experiments) which machined with the highest and lowest input energy, respectively. As can be seen in figures 9(a) and (b), by increasing pulse on time and pulse current the recast layer thickness increases. When the pulse duration and the current are at the highest level, the amount of molten material increase and by the fact that pulse interval time and dielectric liquid pressure are constant in all machining conditions, in turn, more molten material results in the more re-solidified material. Heat affected zone (HAZ) is at the bottom of recast layer. Due to the heating and rapid cooling, the characteristics of the recast layer and the HAZ are different from the base metal, and these areas are dangerous in terms of mechanical function because the micro structure has been changed, thermal residual stresses have been generated and impurity has been penetrated [23]. In sensitive applications such as the aerospace industry, this layer is harmful and should be removed as much as possible. To remove this layer, it is needed to trim-cut with low spark energy after rough-cut in WEDM or utilizing other non-tradition machining techniques such as chemical machining (ChM), electrochemical machining (ECM) or abrasive flow machining (AFM).
Figure 10. Recast layer of WED machined specimens (a) Ton = 1.2 μs, IP = 12 A, SF = 9 mm min−1; (b) Ton = 0.2 μs, IP = 4 A, SF = 9 mm min−1.
Download figure:
Standard image High-resolution image
4. Conclusions
In this present research work, the machinability of the AZ91 magnesium alloy during wire electrical discharge machining has been investigated. Response surface methodology has been used to design of experiments and analyses of results. Pulse on time, pulse current and servo feed rate has been selected as variable input parameters while MRR, KRFW, and SR were selected as performance characteristics. The results obtained from this study can be summarized as follows:
- 1.Among the selected three variable input parameters, the pulse on time has the greatest effect on the material removal rate, kerf width, and surface roughness. Increasing pulse on time cause to increase in all of these output parameters values.
- 2.After the pulse on time, the pulse current had the greatest effect, with increase in this input parameter, all three of output parameters values increase. The effect of the servo feed rate on the output parameters was insignificant.
- 3.Material removal rate and kerf width in AZ91 magnesium alloy machining were higher than the other materials. In this study, the MRR and kerf width reached to 180 mm3 min−1 and 0.450 mm, respectively. The main reasons for this phenomena are the low melting point and high thermal conductivity of magnesium alloys.
- 4.Despite the high rate of cutting, the roughness of surfaces was appropriate which indicates the high machinability of magnesium alloys during WEDM. The highest value for SR was 4.683 μm.
- 5.SEM images of WED machined surfaces indicated that increase in pulse on time and pulse current (i.e. sparks thermal energy) leads to more splash, melted debris, non-uniform and rough surface. Better surface quality with least surface damages was obtained in Ton = 0.2 μs
- 6.The result of EDX analysis indicated that, after WEDM, the content of Zinc, Copper, Oxygen in the machined surface is increased whereas the content of magnesium and aluminum elements is decreased. The reason for the increase in zinc and copper percentage is sticking some of the melted materials from zinc-coated brass wire to the work piece surface and the reason for the increase of oxygen is the decomposition and sticking to surface of the dielectric fluid (deionized water) molecules.
Acknowledgments
This research was supported by the VAHEDI Industrial Group in laboratory and financial aspects under the standard and reliable scales.