


ABSTRACT
The all sky surveys done by the Palomar Observatory Schmidt, the European Southern Observatory Schmidt, and the United Kingdom Schmidt, the InfraRed Astronomical Satellite, and the Two Micron All Sky Survey have proven to be extremely useful tools for astronomy with value that lasts for decades. The Wide-field Infrared Survey Explorer (WISE) is mapping the whole sky following its launch on 2009 December 14. WISE began surveying the sky on 2010 January 14 and completed its first full coverage of the sky on July 17. The survey will continue to cover the sky a second time until the cryogen is exhausted (anticipated in 2010 November). WISE is achieving 5σ point source sensitivities better than 0.08, 0.11, 1, and 6 mJy in unconfused regions on the ecliptic in bands centered at wavelengths of 3.4, 4.6, 12, and 22 μm. Sensitivity improves toward the ecliptic poles due to denser coverage and lower zodiacal background. The angular resolution is 6 1, 64, 65, and 120 at 3.4, 4.6, 12, and 22 μm, and the astrometric precision for high signal-to-noise sources is better than 015.
Export citation and abstract BibTeX RIS
1. INTRODUCTION
The Wide-field Infrared Survey Explorer (WISE) will complete a mid-infrared survey of the entire sky by 2010 mid-July with much higher sensitivity than previous infrared survey missions. The most comparable previous mission, the InfraRed Astronomical Satellite (IRAS; Neugebauer et al. 1984; Beichman et al. 1988) was launched in 1983 and mapped the whole sky in four bands with 62 individually wired detectors. The AKARI mission (Murakami et al. 2007) used an ingenious technique to survey the mid-IR sky at 9 and 18 μm with sensitivities of 50 and 100 mJy (Ishihara et al. 2010) with better angular resolution than IRAS. WISE is mapping the whole sky in four infrared bands W1,...,W4 centered at 3.4, 4.6, 12, and 22 μm using a 40 cm telescope feeding arrays with a total of 4 million pixels. The increased number of detectors leads to a much higher sensitivity: WISE is achieving a sensitivity more than 100 times better than IRAS in the 12 μm band. While IRAS had two far-infrared bands at 60 and 100 μm, WISE has two mid-infrared bands at 3.4 and 4.6 μm. In these bands, the only all-sky survey that has been done is from the Diffuse InfraRed Background Experiment (DIRBE) on the COBE satellite, and DIRBE used only a single pixel per band observing a 0 7 beam. A point source catalog was constructed by Smith et al. (2004) from the DIRBE data with flux limits of 60 and 50 Jy at 3.5 and 4.9 μm, and WISE should reach flux limits that are 5 × 10⁴ times lower in these bands.
2. IMPLEMENTATION
WISE is a MIDEX (medium class Explorer) mission funded by NASA. The project is managed and operated by the Jet Propulsion Laboratory (JPL) for the PI, Edward L. Wright. Major components of the project were built by contractors, with the Space Dynamics Laboratory (SDL) of Utah State University building the instrument and Ball Aerospace & Technologies Corporation building the spacecraft. See Liu et al. (2008) for more details about the development of the WISE flight system. The data processing and analysis is being done by the Infrared Processing and Analysis Center (IPAC). Education and Public Outreach activities for WISE are led by the UC Berkeley Space Sciences Lab (Méndez 2008).
The WISE flight system is 285 cm tall, 200 cm wide, and 173 cm deep. It has a mass of 661 kg. It uses 301 W of power, while the solar panels can provide over 500 W. The 40 cm diameter telescope sits inside a solid-hydrogen cooled cryostat. The cryostat plus telescope and camera have a mass of 347 kg, and the solid hydrogen has a mass of 15.7 kg at launch. Figure 1 shows the flight system in operational configuration.

Figure 1. Diagram showing the WISE flight system in survey configuration with cover off. The spacecraft bus to the left of the bipod supports was provided by BATC, and the cryogenic instrument to the right of the bipods was provided by SDL.
Download figure:
Standard image High-resolution image2.1. Mission Design
It is easiest to observe sources when the Sun is not in the same part of the sky, since maximizing the elongation from the Sun makes it much easier to keep optics cool and to avoid scattered light from the Sun. But to scan the entire sky one must observe the ecliptic poles, which are always 90° from the Sun. Thus, WISE adopted a basic strategy of scanning great circles with a center located at the Sun, which keeps the solar elongation at 90°. These circles scan from the North Ecliptic Pole (NEP) to the South Ecliptic Pole, crossing the ecliptic at longitudes ±90° from the Sun. The entire sky is covered by this scan pattern in half a year as the Earth–Sun line turns by 180°.
Confusion noise would prevent detection of key WISE science targets unless the beam size were less than 50 arcsec2, and since there are 5 × 10¹¹ arcsec2 in the sky, WISE clearly needs to transmit large quantities of data to the ground. This led to choosing a low Earth orbit to minimize the transmission loss. The actual WISE orbit started with a mean radius of 6909 km in 2009 mid-December, and the radius had decreased by 0.8 km due to atmospheric drag by 2010 mid-June. In a polar orbit, the average geoid height is (Req + Rp)/2 = 6368 km, so the average altitude above the geoid is 540 km. This altitude was chosen to reduce the exposure to trapped radiation belts in the South Atlantic Anomaly (SAA). Since looking at the Earth would both blind the detector arrays and overwhelm the cryogenic system, a Sun synchronous orbit was chosen, with an inclination (975) chosen to give a precession rate of 360° in one year. The right ascension of the ascending node was chosen so that the local time at the equator crossings is either 6 AM or 6 PM. For the actual WISE launch at 14:09:33 UT on 2009 December 14 the ascending node is at 6 PM local time. Since the end of the orbit normal close to the Sun is at −75 declination for dawn launch from the Western Test Range (at Vandenberg AFB, CA), during June the angle between Sun and the orbit normal can be as large as 31°, and eclipses occur over the South pole. COBE was in a 99° inclination orbit at 900 km altitude with a June-centered eclipse season. The alternative of a 6 PM launch from the WTR gives an eclipse season centered on the December solstice, as was the case for IRAS.
By synchronizing the scans and the orbit so the telescope is pointed at the NEP when the satellite is closest to the North pole of the Earth, one achieves a scan pattern that covers the entire sky, with the LOS never closer to the Sun than 90° and never further than 31° from the zenith.
WISE has adopted the Two Micron All Sky Survey (2MASS) strategy of moving the telescope at a constant inertial rate and using a scan mirror to freeze the sky on the arrays for the integration time. The field of view (FOV) of WISE is 47', and by choosing to have a small (10%) overlap between frames, the cadence between frames is set at 11.002 s per frame. For WISE 8.8 s of this is spent integrating and it takes about 1.06 s to read out the arrays. The LOS then jumps forward 42' in 1.1 s. There are about 15 orbits per day, so the scan circle advances by about 4' per orbit, giving about 12 orbits where the FOV hits a given source. Figure 2 shows how the redundancy builds up, while Figure 3 shows scans on the celestial sphere. Figure 4 shows the relationship between the WISE orbit, the Earth–Sun line, and WISE line of sight (LOS) during the eclipse season.

Figure 2. Coverage by WISE in one frame (every 11 s), in one orbit, in two orbits, and in many orbits. The gray levels show the depth of coverage with the darker areas having more coverage.
Download figure:
Standard image High-resolution image
Figure 3. Schematic showing WISE coverage on the sphere for one orbit, for two consecutive orbits, and for two orbits separated by 20 days, illustrating the highly redundant coverage at the ecliptic poles.
Download figure:
Standard image High-resolution image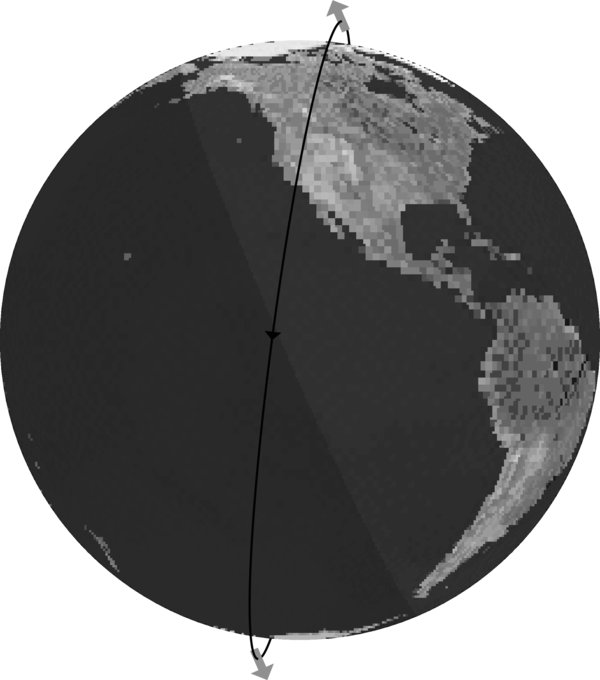
Figure 4. WISE pointing and orbit during the June solstice. Note that WISE points perpendicular to the Earth–Sun line and not toward the zenith.
Download figure:
Standard image High-resolution imageThe Moon crosses the scan circle twice a month, and this would leave gaps in the sky coverage because the Moon is bright enough to cause stray light problems when it is less than 15° from the LOS. Thus, WISE uses a modified scan pattern where the scan circle gets slightly ahead before the Moon interferes and then drops slightly behind to recover the region the Moon blotted out. The Moon moves 13° per day in ecliptic longitude, so with a 15° exclusion zone WISE needs to be 12 ahead just before the Moon crosses the scan circle, and then drop back to 12 behind. In addition, the SAA affects part of four orbits per day, and to mitigate reductions in the sky coverage due to the SAA, a small toggle of  is added to the longitude of the scan circle center, with the sign changing with a two orbit period. Finally, the scan circle central longitude is biased by +5° on the side of the scan where the Sun is approaching the scan, which is the 6 PM side of the orbit. This means that the scans are actually 90° and 95° from the Sun when crossing the ecliptic, allowing for a 5 day recovery period after a satellite anomaly without causing a gap in sky coverage.
The WISE mission design provides at least eight frames on over 99% of the sky in a 6 month survey interval after allowing for data lost to the Moon and the SAA. Heinrichsen & Wright (2006) describe the mission operations system in more detail. Figure 5 shows the survey progress versus date. In 2010 mid-July, WISE completed its first pass over the sky, but will continue to survey until its cryogen runs out.

Figure 5. WISE survey coverage vs. date. As of 2010 July 15 more than 99% of the sky had been covered to depth of eight frames or more. The fraction of the sky covered to a depth of 4, 12, or 16 frames is also shown. The dotted portions of the curves show the anticipated coverage until the expected exhaustion of the cryogen. The vertical dashed line shows when the 22 μm channel saturated after the actual exhaustion of the secondary tank. The small slowdowns in the survey progress occur when the Moon crosses the scan path. The dashed line shows a simple prediction of the sky coverage based only on the longitude of the Sun, starting on 2010 January 14.
Download figure:
Standard image High-resolution imageDuval et al. (2004) and Mainzer et al. (2005) describe the WISE hardware design.
2.2. Instrument
The WISE telescope, imager, dichroic beamsplitter, detectors, and cryostat were built by the SDL of Utah State University with major subcontracts from Lockheed Martin Advanced Technology Center, L3 Communications SSG-Tinsley, and DRS Technologies. Larsen & Schick (2005) describe the WISE science payload in more detail. The instrument was tested, then passed a vibration test, and was tested again, before being delivered to Ball Aerospace in 2009 May for final integration with the spacecraft. The testing included a determination of the optimal focus, a measurement of the point-spread function (PSF), and a determination of both the relative spectral response and the absolute sensitivity of the system.
The WISE short-wavelength channels employ 4.2 and 5.4 μm cutoff HgCdTe arrays fabricated by Teledyne Imaging Sensors with 1024 × 1024 pixels each 18 μm square. For the long-wavelength channels, the detectors are Si:As BIB arrays from DRS Sensors & Targeting Systems with the same 1024 × 1024 pixel format and pitch. The first four and last four pixels in each row and column are used as non-illuminated reference pixels, so the effective size of the arrays is 1016 × 1016 pixels. The median pixel scale is 2757 pixel−1 with a range of ±0.6% among the different axes and arrays. The band 4 data are binned 2 × 2 on board, giving 55 pixel−1. All four arrays image the same FOV simultaneously using three dichroic beam splitters.
All of the arrays use sampling up the ramp. The 11 s cadence between frames is divided into 10 parts. A reset-read of the arrays occurs during the first 1.1 s, followed by eight read cycles each 1.1 s apart and a final reset cycle while the scan mirror flies back. For the W3 and W4 arrays, the nine reads are multiplied by weights of −4, −3, −2, −1, 0, 1, 2, 3, and 4 and summed to give the slope of the ramp. The W1 and W2 arrays showed excess noise in the first sample so the weights used are 0, −7, −5, −3, −1, 1, 3, 5, and 7.
The long-wavelength arrays show long lasting latent images in the flat field which are removed by annealing these arrays twice per day. The annealing heaters are on for 90 s and heat the arrays from their 7 K normal operating temperature to 15 K, which removes the latent images.
The spectral response of the system has been determined in three different ways: the whole system response was measured using a Fourier transform spectrometer (FTS), the system response was estimated using the product of component data (measured with an FTS), and the response was computed from component design calculations. Since the sharp edges in the response function cause ringing and negative values in the FTS spectrum, a "best" combined estimate of the relative spectral response was computed as follows: first, a power law was fit to the ratio of the total system measured response to either the component prediction or the design prediction. The predictions were then adjusted to better match the measured transmission using these fits. The fits were weighted by the square of the response function times a 1/σ2 statistical weight, so the correction is best in the filter passbands. After the adjustment the three methods gave consistent responses. Finally, the best estimate for the spectral response was made using a weighted mean of the measured, predicted from components, and design values. In the weighted mean, zero or negative responses were given zero weight, the design and component predictions were given unit weight, and the measurements were given weights of signal-to-noise ratio (S/N)2. This weighted mean relative spectral response is shown in Figures 6 and 7. The curves in the logarithmic plot have been normalized to a peak value of 1. Note that the small red leak in the W3 transmission is based on data with a low S/N and may not actually exist.

Figure 6. Weighted mean WISE relative spectral response functions in electrons per photon.
Download figure:
Standard image High-resolution imageWISE measures the signal S given by

since the relative spectral response R is electrons per photon and dnγ ∝ Fνdν/(hν) ∝ Fνdln ν.
Specifying a central wavelength for broad bands like the WISE filters, especially the very wide W3 band, is always ambiguous. We have chosen to specify the isophotal wavelengths for our filters. The isophotal wavelength and magnitude zeropoint are defined by requiring that a constant F°λ gives the same signal as Vega in a WISE band, and that F°λ = FVegaλ(λiso). Tokunaga & Vacca (2005) give a clear definition of the isophotal wavelength and values for Mauna Kea Observatory filter set. Cohen et al. (1992) give the IR spectrum of Vega, based on a model from Kurucz (1991; M. Cohen 2010, private communication). It is important to remember that WISE saturates on Vega, so the magnitude zeropoint is actually based on fainter stars calibrated to the Vega system. Therefore, the debris disk around Vega (Aumann et al. 1984) is relevant only if it has affected the calibration used to determine the magnitudes of the fainter standards. A convenient and accurate fit to the continuum of our Vega spectrum in the 2.5 < λ < 29 μm range we use is given by

where Bλ is the Planck function, which matches the continuum spectrum to an average absolute error of 0.045%. The temperature in this ad hoc fit is much higher than the effective temperature of Vega and the solid angle is much lower than the real solid angle due to the increase with wavelength of the free–free and bound–free opacities. Absorption lines reduce the in-band fluxes by only 0.73, 0.57, 0.28, and 0.14% in bands 1 through 4. To avoid possible multiple solution we use the continuum spectrum when solving for λiso. The isophotal wavelengths so defined are 3.3526, 4.6028, 11.5608, and 22.0883 μm for W1,..., W4. The measured system transmissions were smaller than the expected values at long wavelengths, leading to an effective wavelength for WISE band 4 of 22 μm instead of the expected 23 μm. Absolute measurements of Vega by MSX (Price et al. 2004) show that a 2.7% upward offset from the model spectrum is needed at 21.3 μm (Cohen 2009). We have applied this correction to the WISE 22 μm band, giving magnitude zeropoints on the Vega system in the WISE passbands of F°λ = 8.180 × 10⁻¹⁵, 2.415 × 10⁻¹⁵, 6.515 × 10⁻¹⁷, and 5.090 × 10⁻¹⁸ W cm−2 μm−1, which convert to F°ν = 306.681, 170.663, 29.0448, and 8.2839 Jy in W1,...,W4 using F°ν = (λ2iso/c)F°λ. There is an overall systematic uncertainty of ±1.5% from the Vega spectrum in these flux zeropoints.

Figure 7. Weighted mean WISE relative spectral response functions after normalizing to a peak value of unity on a logarithmic scale.
Download figure:
Standard image High-resolution imageWe have also observed in-flight a discrepancy between red (typically sources with Fν ∝ ν−2) and blue (stars with Fν ∝ ν2) calibrators in W3 and W4, the 12 and 22 μm bands. This amounts to about −17% and 9% in the fluxes for W3 and W4, with the red sources appearing too bright in W4 and too faint in W3. The flux differences could be resolved by adjusting the effective wavelength of W3 and W4 3%–5% blueward and 2%–3% redward, respectively. This would change the zero magnitude F°ν by about −8% in W3 and +4% in W4. But the zeropoints and isophotal wavelengths reported here are based on the relative spectral responses derived from ground calibration without any such adjustment. The instrumental zeropoints that define the conversion from counts to magnitudes have been based on standard stars, which are the blue calibrators. Given the discrepancy between red and blue calibrators we estimate that the conversion from magnitudes to Janskys are currently uncertain by ±10% in W3 and W4. Updated values will be provided in the Explanatory Supplement accompanying the preliminary data release.
This definition of the isophotal wavelength and flux zeropoint means that the color correction term for a source with a different spectrum than Vega vanishes by construction when Fλ is a constant (Fν ∝ ν−2) and very nearly vanishes for Rayleigh–Jeans sources with Fλ ∝ λ−4 or Fν ∝ ν2. These spectral energy distributions bracket the vast majority of WISE sources, so the color corrections are generally small. But the extremely wide W3 filter does lead to color corrections as large as 0.1 mag for a constant Fν. Table 1 gives the flux correction factors in the WISE bands for several input spectra and the WISE colors for these spectra. These factors multiply the signal S given by a spectrum Fν = F°ν(λiso/λ)β. Thus, a spectrum with Fν = const = 29.0 Jy gives a signal that is fc(W3) = 0.9169 times the signal from Vega, so one would need a constant Fν of 29.0/0.9169 = 31.7 Jy to give zero magnitude.
Table 1. Flux Corrections and Colors for Power Laws and Blackbodies
| Fν | fc(W1) | fc(W2) | fc(W3) | fc(W4) | [W1 − W2] | [W2 − W3] | [W3 − W4] |
|---|---|---|---|---|---|---|---|
| ν3 | 1.0283 | 1.0206 | 1.1344 | 1.0142 | −0.4040 | −0.9624 | −0.8684 |
| ν2 | 1.0084 | 1.0066 | 1.0088 | 1.0013 | −0.0538 | −0.0748 | −0.0519 |
| ν1 | 0.9961 | 0.9976 | 0.9393 | 0.9934 | 0.2939 | 0.8575 | 0.7200 |
| ν0 | 0.9907 | 0.9935 | 0.9169 | 0.9905 | 0.6393 | 1.8357 | 1.4458 |
| ν−1 | 0.9921 | 0.9943 | 0.9373 | 0.9926 | 0.9828 | 2.8586 | 2.1272 |
| ν−2 | 1.0000 | 1.0000 | 1.0000 | 1.0000 | 1.3246 | 3.9225 | 2.7680 |
| ν−3 | 1.0142 | 1.0107 | 1.1081 | 1.0130 | 1.6649 | 5.0223 | 3.3734 |
| ν−4 | 1.0347 | 1.0265 | 1.2687 | 1.0319 | 2.0041 | 6.1524 | 3.9495 |
| Bν(100) | 17.2062 | 3.9096 | 2.6588 | 1.0032 | 10.6511 | 18.9307 | 4.6367 |
| Bν(141) | 4.0882 | 1.9739 | 1.4002 | 0.9852 | 7.7894 | 13.0371 | 3.4496 |
| Bν(200) | 2.0577 | 1.3448 | 1.0006 | 0.9833 | 5.4702 | 8.8172 | 2.4949 |
| Bν(283) | 1.3917 | 1.1124 | 0.8791 | 0.9865 | 3.8329 | 5.8986 | 1.7552 |
| Bν(400) | 1.1316 | 1.0229 | 0.8622 | 0.9903 | 2.6588 | 3.8930 | 1.2014 |
| Bν(566) | 1.0263 | 0.9919 | 0.8833 | 0.9935 | 1.8069 | 2.5293 | 0.8041 |
| Bν(800) | 0.9884 | 0.9853 | 0.9125 | 0.9958 | 1.1996 | 1.6282 | 0.5311 |
| Bν(1131) | 0.9801 | 0.9877 | 0.9386 | 0.9975 | 0.7774 | 1.0421 | 0.3463 |
| K2V | 1.0038 | 1.0512 | 1.0030 | 1.0013 | −0.0963 | 0.1225 | −0.0201 |
| G2V | 1.0049 | 1.0193 | 1.0024 | 1.0012 | −0.0268 | 0.0397 | −0.0217 |
Download table as: ASCIITypeset image
Outer solar system objects like Centaurs will have color temperatures close to 100 K and for a 100 K blackbody the flux correction factor fc(W3) = 2.6588 is quite large. Thus, a 100 K blackbody would need 29.0/2.66 = 10.9 Jy at 11.56 μm to give zero magnitude in W3.
The most common stars in the WISE catalog at high galactic latitude should be G-K dwarfs, so the flux correction factors and colors for a K2V and a G2V have been included in Table 1 using Kurucz (1993) spectra. Since the W2 band includes the fundamental CO bandhead, the flux correction factors give the ratio between the signal from the star to the signal from a constant Fλ equal to the average over a log normal passband with a 9.1% FWHM centered on λiso.
2.2.1. Optics
The optical design and assembly of the WISE telescope and camera was done by L-3 Communications SSG-Tinsley. The optics consist of an afocal 40 cm diameter telescope that produces a parallel beam of light that is fed into the scan mirror, which works in the parallel beam, and then into the all-reflecting camera. There are six mirrors including folding flats in the afocal telescope before the scan mirror and six mirrors in the camera after the scan mirror. All of the mirrors are gold-coated giving a high infrared transmission. The design is described in more detail by Schwalm et al. (2005).
2.2.2. Cryostat
The cryostat (Naes et al. 2008) was built by the Lockheed Martin Advanced Technology Center. It uses solid hydrogen to cool the telescope to less than 12 K, and the Si:As arrays to less than 7.5 K. There are two tanks of solid hydrogen: a larger secondary tank that cools the telescope and optics, the short-wavelength arrays, and shields around the smaller primary tank that just cools the Si:As long-wavelength arrays. It has a predicted on-orbit lifetime of 10.75+1−0.5 months. Schick & Lloyd (2009) describe the cryostat support system and test results.
However, the in-flight performance deviated from the model predictions with the secondary tank running out of hydrogen on August 5 after 7.7 months in orbit. The primary tank continues to cool the long-wavelength detectors, but the telescope warmed up to 46 K producing large backgrounds at 12 and 22 μm. The 22 μm channel stopped producing useful data after 2010 August 8. The integration time on the 12 μm channel was cut in half on August 14, cut in half again on August 20, and cut in half again on August 23. Observations continued in the 3.4, 4.6, and 12 μm bands until the primary tank ran out of hydrogen on 2010 September 29.
2.3. Spacecraft
The WISE spacecraft was built by Ball Aerospace, with a design based on the RS300 series of single string spacecraft. The NextSat component of the Orbital Express mission was the first RS300 spacecraft to be launched, and it worked flawlessly. SWRI provided the spacecraft avionics.
WISE is a three-axis controlled spacecraft that is commanded to follow long scans at a constant inertial rate. The spacecraft provides attitude control of better than 75'', jitter of less than 13, and drift rate variation of less than 02 s−1 over 9 s. Angular momentum is stored on board in four reaction wheels, and any buildup of excess angular momentum is dumped using magnetic torquer rods. Primary attitude information is provided by two Ball CT-633 star trackers. A fiber optic inertial measurement unit, Sun sensors, and magnetometers are used during safe and emergency modes of the spacecraft.
A fixed solar panel provides over 500 W of power. WISE is oriented so the solar panel is always pointing very nearly at the Sun. During eclipse, a 20 A hr lithium-ion battery provides flight system power. Science data and flight system telemetry are stored on a 96GB flash memory card for later transmission to Earth. The science data volume is about 50 Gbyte per day of uncompressed data, but loss-less compression reduces this by roughly a factor of two. A fixed high gain antenna is used to transmit data to the Tracking and Data Relay Satellite System (TDRSS). The spacecraft body steers the antenna to TDRSS for downlink. Science operations have to be stopped during data transmission, so the data downlinks are scheduled while the satellite passes over the poles of the Earth, where the sky coverage is highly redundant.
2.4. Mission Operations
Except for looking up instead of down, WISE is very similar to an Earth observing satellite. WISE is in a Sun-synchronous low Earth orbit like the Landsats and many other Earth observers, and it uses the TDRSS to download a large volume of data. Thus, WISE is being operated by the Earth Sciences Operations Center at JPL which also operates the JASON ocean topography mapping mission.
The preparation of a command load for WISE starts with a set of survey planning parameters, which then are used along with a predicted orbit to generate the survey plan for a week in the future. Times when a turn to TDRSS would be compatible with the WISE Sun and Earth pointing constraints are chosen, and a complete sequence of pointing commands covering half a week that combines observing with TDRSS downloads is created. Additional commands for momentum unloading and annealing the W3 and W4 detector arrays are inserted into the command sequence. This process is repeated twice a week to allow for the uncertainties in the predicted orbit caused by the fluctuating atmospheric drag due to solar activity. In the first half of 2010, the solar activity has been anomalously low, minimizing the errors in the predicted orbits.
2.5. Data Processing and Archiving
WISE science data processing, archiving, and distribution are performed by the IPAC, California Institute of Technology. The processing software and operations system is based on algorithms, pipelines, and architecture used for 2MASS, the Spitzer Space Telescope, and GALEX projects.
Following each TDRSS downlink contact, science image data packets are sent to IPAC where they are uncompressed and assembled into raw FITS format images in the four WISE bands. The raw FITS image headers are populated with flight system engineering telemetry, navigation data, and survey events information that is sent asynchronously from Mission Operations at JPL. The images from each downlink transfer are then passed to the WISE scan/frame pipeline that performs instrumental calibration (droop correction, linearization, bias subtraction, flat fielding), source extraction, photometric and astrometric calibration, and artifact identification on the individual exposure frames. The WISE Multiframe pipeline operates on collections of calibrated single-frame images that cover a region on the sky. The single-frame images are co-added by registering them onto a common pixel grid, matching local background levels, and optimally combining resampled pixel values using outlier rejection to suppress transient pixel events such as cosmic rays, noise excursions, and fast moving objects (Masci & Fowler 2009). Sources are detected and characterized on both the resulting combined images and individual frames, and spurious detections of image artifacts are identified and flagged. Both scan/frame and multiframe processing are accompanied by detailed quality assessment to monitor data accuracy relative to WISEs science data requirements.
Source detection and characterization in the scan/frame and multiframe pipelines exploit WISEs simultaneous four-band measurements. Sources are detected by thresholding on a combined four-band, matched-filter image, similar to the "chi-square" detection method described by Szalay et al. (1999). Profile-fit photometry is performed on all bands simultaneously, using a maximum-likelihood fitting procedure that also operates on multiple, independent image frames in the multiframe pipeline.
Astrometric calibration of single-exposure WISE images is performed by solving for the frame center positions and rotations using the in situ measured position of 2MASS point source catalog astrometric reference stars. Band-to-band rotations and offsets, plate scales, and field distortion are determined by off-line analysis using the apparent positions of reference stars in thousands of image frames. Full WCS information derived from the astrometric solutions is included in the single-frame image headers. The single-frame astrometric solutions are propagated to the co-added images and extracted source lists in the multiframe pipeline.
Processed WISE images and extracted source data and metadata will be archived and served to the community via the Web-based and machine-friendly interfaces of the NASA/IPAC Infrared Science Archive (IRSA). WISE data products will be interoperable with other data centers and services through the IRSA infrastructure.
3. ON-ORBIT PERFORMANCE
WISE observes each patch of sky many times over a period of a day or more during its normal survey operation. These multiple frames can be combined into co-added multicolor mosaics such as Figure 8, which shows the Wolf-Rayet wind bubble NGC 2359 (Schneps & Wright 1980). The WISE project is posting an image of the week on its multimedia gallery which can be reached via http://wise.astro.ucla.edu.

Figure 8. Wolf-Rayet wind bubble NGC 2359 in the infrared using W1 as blue, W2 as cyan, W3 as green, and W4 as red. Image width is 04, with north to the left and west up.
Download figure:
Standard image High-resolution imageWhile the sensitivity of WISE is specified for eight coverages, this is a worst case. Even on the ecliptic, where the coverage is the smallest, the most likely number of frames covering a given source is 11. The individual frames are analyzed to provide astrometric and photometric information. Analyzing the scatter among the values from individual frames gives the noises shown in Figure 9. The dashed line shows a 5:1 S/N in 8 frames scaled to the 11 frame case plotted, giving σ(m) = 0.185 mag where n is a noise term fitted to the data points. The curves show σ(m) = 0.01 + [2.5/ln(10)]n/10−0.4m. The magnitudes where the curves cross the dashed line are 17.11, 15.66, 11.40, and 7.97 mag. These give raw sensitivities of 44, 93, 800, and 5500 μJy for 5σ in eight frames. There will be additional uncertainty due to source confusion which is not included in these noises. Allowing for confusion gives sensitivities of 0.08, 0.11, 1, and 6 mJy.

Figure 9. Standard deviation of WISE magnitudes derived from the repeatability on sources seen in 11 frames. The standard deviations have been binned into bins with width 0.2 mag, and the resulting histograms have been fit with a Gaussian using outlier rejection. The points and error bars show the derived means and standard deviations. The curves show a noise model fitted to the data. The dashed line shows an S/N of 5.86:1 which corresponds to 5:1 in eight frames. From left to right, the open squares show W4, the filled squares show W3, the open circles show W2, and the filled circles show W1.
Download figure:
Standard image High-resolution imageThe astrometric accuracy of WISE can be estimated by looking at the differences between WISE and UCAC3 (Zacharias et al. 2010) positions, shown in Figure 10 for sources with S/N >20. At lower S/Ns, an additional error of about FWHM/(2 S/N) must be added in quadrature. Since this additional error is 015 for a PSF FWHM of 6s and S/N=20, and the observed width of the distribution implies σ = 017 for S/N >20, WISE positions for high S/N sources should be better than 015 for 1σ and 1 axis.

Figure 10. Histograms of the difference in right ascension and declination between WISE and UCAC positions for objects with S/N in W1 >20.
Download figure:
Standard image High-resolution imageThe image quality for WISE is good as shown in Figure 11. These curves show the azimuthally averaged PSF for WISE with FWHMs of 61, 64, 65, and 120 in WISE bands 1–4. In the geometric limit without diffraction the estimated FWHM is roughly 55.

Figure 11. Azimuthally averaged PSFs for WISE.
Download figure:
Standard image High-resolution imageThe sensitivity of WISE to diffuse emission can be estimated from the point source sensitivity and the beam size. The point source flux sensitivity scales like the square root of the noise effective solid angle Ωe (Wright 1985), also known as noise pixels. Thus, the diffuse sensitivity for a source solid angle Ω is given by  . The noise pixels for W1,...,W4 are 13.4, 16.7, 34.3 (275), and 25.9 (55). These give Ωe = 2.4, 3.0, 6.1, and 18.4 nsr in W1,...,W4. For a source size of 5' × 5' or Ω = 2.1 μsr, the 5σ diffuse sensitivities from statistical noise alone are 0.6, 1.2, 7, and 28 kJysr−1 in W1,...,W4. The sensitivity to large-scale structures will also be limited by errors in the flat-field corrections and inaccuracies in matching the backgrounds from frame to frame.
The observed saturation levels for WISE are 0.3, 0.5, 0.7, and 10 Jy for W1,...,W4. Saturated pixel values are replaced with a flag indicating which of the nine samples up the ramp was the first to saturate, so there is still a coarse indication of the brightness in saturated regions.
4. SCIENCE GOALS
WISE has achieved 5σ point source sensitivities better than 0.08, 0.11, 1, and 6 mJy at 3.4, 4.6, 12, and 22 μm in regions observed in eight or more frames, which is expected to be more than 99% of the sky. These sensitivities correspond to Vega magnitudes of 16.5, 15.5, 11.2, and 7.9. Thus, WISE will go a magnitude deeper than the 2MASS Ks data in W1 for sources with spectra close to that of an A0 star, and even deeper for moderately red sources like K stars or galaxies with old stellar populations.
The fundamental objective of WISE is to provide a sensitive all-sky survey in the mid-infrared. This survey will probably provide its biggest payoff in ways that have not yet been imagined. But several fields can be identified where an all-sky survey will provide a guaranteed payoff.
Many classes of extragalactic objects will be quite red in the WISE colors, as will brown dwarf stars which are among the Sun's closest neighbors. Figure 12 shows the color–color diagram constructed from the W1,...,W3 bands, with the regions occupied by various types of objects illustrated.

Figure 12. Color–color diagram showing the locations of interesting classes of objects. Stars and early-type galaxies have colors near zero, while brown dwarfs are very red in W1–W2, spiral galaxies are red in W2–W3, and ULIRGS tend to be red in both colors.
Download figure:
Standard image High-resolution image4.1. Brown Dwarf Stars
Brown dwarf stars are very faint, since they are not massive enough to fuse hydrogen into helium. As a result, they gradually fade and cool, and old brown dwarfs will be very cool and faint. Both Jupiter with L = 10−9 L☉ and Gliese 229B with L = 10−5 L☉ have very strong emission at 4.6 μm due to a lack of methane absorption at this wavelength (Kirkpatrick 2005). Thus, the 4.6 μm band of WISE is a powerful tool for finding cool brown dwarfs. Most of the brown dwarfs found prior to WISE have been discovered using the z' band of SDSS or the J band of 2MASS or UKIDSS, but fairly high temperatures are required before there is substantial emission in either of these short-wavelength bands. As a result the currently known sample of brown dwarfs is biased toward the hotter, and thus younger, objects. WISE is able to find 10 Gyr old brown dwarfs and thus should detect a high density of stars in the solar neighborhood. The expected number density of brown dwarfs is one to two times the density of ordinary stars (Reid et al. 1999; Chabrier 2002).
The expected number of brown dwarfs that WISE will see can be computed using models for the emitted spectra of brown dwarfs and the luminosity and effective temperature of brown dwarfs as a function of mass and age (Burrows et al. 2003). These model spectra are plotted as νFν/Fbol in Figure 13. The spectra can also be used to compute the dimensionless ratios of νFν/Fbol for each WISE band, which turn out to be well described by simple functions of the effective temperature Te. The functional forms plotted in Figure 14 are given by

with x = hν/(1.34kTe) for band 1 in blue,

with x = hν/(2.29kTe) for band 2 in green,

with x = hν/(1.05kTe) for band 3 in orange, and

for band 4 in red. Thus, WISE band 2 sees a flux for Teff>230 K that is similar to a graybody with a temperature 2.25 times higher than Teff, and with an emissivity 2.25 times higher than a blackbody. The fluxes in WISE bands 1 and 3 also look like higher temperature graybodies but with emissivities much smaller than a blackbody. The flux in WISE band 4 does not behave like a blackbody.

Figure 13. Brown dwarf spectra selected from Burrows et al. (2003) smoothed to 1% resolution. Curves are labeled with the effective temperature from 797 K at the top to 312 K at the bottom.
Download figure:
Standard image High-resolution image
Figure 14. Flux in the WISE bands compared to the bolometric flux as a function of Teff for the models of Burrows et al. (2003). Simple functional fits are shown.
Download figure:
Standard image High-resolution imageBut when Eisenhardt et al. (2010) surveyed 10 deg2 with Spitzer to a flux limit at 4.5 μm 20 times deeper than the WISE all sky sensitivity, they found fewer very red sources than predicted by combining the Burrows et al. (2003) models with either the Chabrier (2003) log normal IMF or the Reid et al. (1999) power laws. The models could be brought into agreement with the observed counts by assuming that about 50% of the IRAC 4.5 μm flux was suppressed by an absorber other than methane or water vapor. The amount of absorption needed is highly correlated with the assumed mass function, but the Eisenhardt et al. (2010) observation of about 10 brown dwarfs gives a model-independent prediction that WISE should find about 10(41253/10)/201.5 ≈ 400 late-T and Y class brown dwarfs. Table 2 shows the number of brown dwarfs in various temperature or distance bins that are detectable by WISE for different assumed mass functions. The age distribution is assumed to be uniform from 108 to 1010 yr, and the mass function is integrated from 1 to 80 MJ. For each mass and age bin, the luminosity and effective temperature are found by interpolation. A fraction S of the 4.6 μm flux is then suppressed, following Golimowski et al. (2004), who found a suppression factor 1/(1 − S) = 1.5 to 2.5, implying S = 0.5 ± 0.1. The volume in which the object could be detected is computed, multiplied times the space density for the mass and age bin, and summed over all masses and ages to give the numbers in Table 2. There are two lines for each mass function: the first does not include the W2 flux suppression, and the second has S adjusted to give the expected 400 detectable objects with Te < 750 K. Matching the Eisenhardt et al. (2010) source density with a flux suppression in the range recommended by Golimowski et al. (2004) requires a high number density of brown dwarfs, as given by Chabrier (2003) or Reid et al. (1999) with a fairly steep power-law index.
Table 2. Number of Brown Dwarfs with Fluxes Greater than the WISE 4.6 μm Required Flux Limit of 160 μJy for Either the Chabrier (2003) log Normal IMF (lgnm) or Reid et al. (1999) Power Laws with Various Indices α from 0.4 to 1.3, While Suppressing a Fraction S of the 4.6 μm Flux
| IMF | S | Te < 300 | Te < 500 | Te < 750 | d < 1.3 pc |
|---|---|---|---|---|---|
| lgnm | 0.000 | 7.1 | 228.5 | 1386.0 | 1.20 |
| ... | 0.489 | 1.5 | 55.0 | 400.0 | 1.19 |
| 0.4 | 0.000 | 2.6 | 79.0 | 520.8 | 0.47 |
| ... | 0.125 | 1.9 | 58.6 | 400.0 | 0.47 |
| 0.7 | 0.000 | 5.2 | 125.0 | 693.9 | 0.68 |
| ... | 0.251 | 2.7 | 67.6 | 400.0 | 0.67 |
| 1.0 | 0.000 | 10.7 | 203.2 | 952.9 | 1.06 |
| ... | 0.375 | 3.8 | 76.9 | 400.0 | 1.03 |
| 1.3 | 0.000 | 22.5 | 341.5 | 1356.1 | 1.82 |
| ... | 0.493 | 5.3 | 88.9 | 400.0 | 1.72 |
Download table as: ASCIITypeset image
The WISE sample of brown dwarfs will be 3 mag brighter than the Spitzer sample of Eisenhardt et al. (2010), and thus much easier to follow up with the Hubble Space Telescope (HST) or the Keck telescopes. Astrometric follow-up will be needed to pin down the properties of old, cold brown dwarfs.
4.2. Ultra-luminous Infrared Galaxies
WISE will detect the most luminous galaxies in the universe. The Ultra-luminous Infrared Galaxies (ULIRGs) are due to mergers that lead to dust-enshrouded star formation and also to active galactic nucleus (AGN) activity as gas is disturbed out of stable circular orbits and falls into the central super-massive black holes in the merging galaxies. Figure 15 shows typical ULIRG and QSO spectra compared to the WISE flux limits.
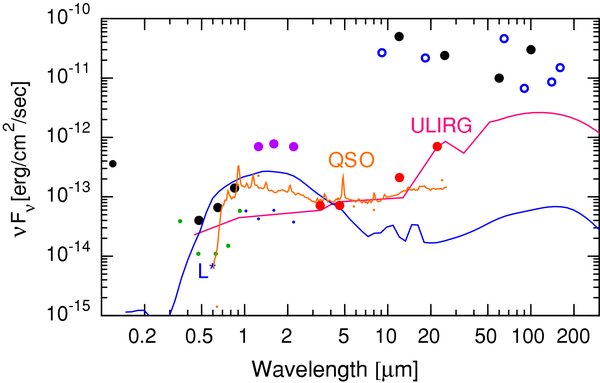
Figure 15. Plot showing the spectrum of an L* galaxy at redshift z = 0.33, a ULIRG (FSC15307 redshifted to z = 3 and scaled by a factor of 3), and observations of the z = 6.42 QSO J1148+5251 with a scaled composite quasar spectrum in orange, compared to the WISE all-sky expected sensitivities in red. Other surveys are indicated with dot areas corresponding to their sky coverage: from the left, GALEX AIS (Martin & GALEX Science Team 2003), SDSS in green (York et al. 2000), DPOSS in black (Djorgovski et al. 1998), UKIDDS LAS in blue (Lawrence et al. 2007), 2MASS in magenta (Skrutskie et al. 2006), AKARI in blue open circles (Matsuhara et al. 2005), and the IRAS FSC in black (Moshir et al. 1992).
Download figure:
Standard image High-resolution imageIn the concordance ΛCDM cosmology structure formation proceeds in a bottom-up manner, so large objects are formed by the mergers of smaller objects. The peak of large mergers occurs at redshifts 1 to 2 and leads to the peak in the star formation history of the universe, and WISE has sufficient sensitivity at 22 μm to see the top end of the luminosity function at redshift 3. As a result, WISE will detect many galaxies with L>1013 L☉. Quasar activity is also associated with mergers, and the evolving quasar luminosity function of Hopkins et al. (2007) predicts that WISE will see over 1.5 × 10⁵ quasars at 22 μm and over 3.6 million quasars at 4.6 μm, with redshift distributions shown in Figure 16.

Figure 16. Number of QSOs and AGNs brighter than the expected sensitivity in the four WISE bands over the entire sky, based on the Hopkins et al. (2007) luminosity function. The W1 and W2 curves lie almost on top of each other, with W3 and W4 giving lower counts.
Download figure:
Standard image High-resolution imageThe abundance of ULIRGs as a function of luminosity and redshift will provide important information about the formation mechanisms that have led to the galaxies and clusters we see at low redshift today.
4.2.1. Red/Dusty AGNs and QSOs
WISE will characterize and probe fully the extent of the population of obscured AGNs and will provide a highly uniform set of mid-infrared photometry for virtually all known AGNs and Quasi-Stellar Objects (QSOs). Most of what is known about the properties and evolution of AGNs and QSOs has been deduced from studies of objects discovered in ultraviolet-excess and optical emission line surveys. However, infrared and radio surveys reveal that many AGNs in the universe have remained hidden from short-wavelength surveys because of reddening and obscuration by dust in and around their nuclei (Low et al. 1988; Webster et al. 1995). Estimates of the fraction of AGNs missing from optical/UV selected samples vary considerably, ranging from 15% to over 50% (Richardset al. 2003; Brown et al. 2007; Glikman et al. 2004, 2007). Such an obscured population may account for at least part of the hard X-ray background (Comastri et al. 1995), and it may contribute measurably to the far-infrared background.
The most extensive searches for red AGNs have been based on the 2MASS PSC, using either near-infrared color selection or combination with mid- and far-infrared and radio measurements (Cutri et al. 2001; Gregg et al. 2002; Glikman et al. 2007). These studies have found large numbers of predominantly low redshift AGNs, adding considerably to the complete census of AGNs in the local universe. However, 2MASS is a relatively shallow survey and is biased against the most heavily obscured AGNs at higher redshifts. WISE will extend the 2MASS studies to higher redshifts, probing the luminosity and number density evolution of red AGNs over a significant fraction of the age of the universe.
One of the highest redshift QSOs, SDSS 1148+5251, is shown in Figure 15, with data from Jiang et al. (2006) and a scaled composite spectrum constructed from Vanden Berk et al. (2001) and Glikman et al. (2006). A similar source is detectable by WISE at 3.4 and 4.6 μm over the whole sky, and also at 12 μm with the better sensitivity achieved at the actual ecliptic latitude of this source (β = 46°).
4.3. Asteroids
Asteroids are typically fairly dark, but do have a large range of albedos. As a result, the visual magnitude is an imprecise indicator of the size of an asteroid. Stuart & Binzel (2004) show a range in albedos from 0.023 to 0.63 for near Earth asteroids, leading to a 5:1 range in estimated diameters and a 125:1 range in volumes. But the light that is not reflected is absorbed and reradiated in the thermal infrared. Figure 17 shows fluxes from an asteroid with low, median, and high albedos. The ratio of optical to infrared fluxes gives the albedo, and the infrared flux and color temperature give a good indication of the diameter of an asteroid.

Figure 17. Fluxes from an 0.13 km diameter near Earth asteroid at a distance of 0.5 AU with elongation 90° for three albedos: 0.04, 0.145, and 0.52 from bottom to top on the left side of the plot. These models assume a Lambertian surface. The phase angle is 63°. The WISE 5σ point source sensitivities for eight stacked frames are shown as solid circles.
Download figure:
Standard image High-resolution imageWISE is sensitive enough to see 1.2 km diameter asteroids in the main belt at 2.7 AU from the Sun, and 0.13 km diameter near Earth objects (NEOs) that are 0.5 AU from the Earth, and 1.1 AU from the Sun. These limits are for objects with known orbits so that multiple frames can be stacked and are for 5σ. This gives 10% accuracy in diameters, which is comparable to the errors caused by the unknown thermal inertia and rotation poles of most asteroids (Wright 2007). WISE will be able to provide radiometric diameters for about 3 × 10⁵ asteroids using image stacking analysis. For an asteroid with a bolometric albedo of A = 5%, the WISE stacked frame sensitivity of 800 μJy at 12 μm corresponds to an optical flux of roughly

which is an optical magnitude of 23. If good optical data are available, all of these asteroids will have well-determined albedos.
For new asteroids, a diameter of 2.4 km in the main belt or 0.25 km for a NEO at a distance of 0.5 AU gives enough S/N in a single frame to allow detections. The NEOWISE program (A. K. Mainzer et al. 2010, in preparation) is searching the WISE data for moving objects and sending positional information to the IAU Minor Planet Center. WISE should detect more than 105 asteroids on single frames.
WISE provides about 10 measurements of the flux spaced over 30 hr for a typical asteroid which can be used to derive rotation periods for tens of thousands of asteroids.
The accurate diameters for previously known asteroids plus new asteroids derived by the WISE task will allow a significantly more precise knowledge of the size frequency distribution (SFD) of sub-kilometer NEOs. Since only a few dozen sub-kilometer objects currently have diameters that have been accurately measured by either radar or thermal IR data, WISE data will significantly improve our knowledge of the SFD of these smaller objects. Diameters derived from WISE measurements will reduce uncertainties in the SFD associated with the traditional reliance on the optical H magnitude. Also, since infrared discoveries of new asteroids are relatively insensitive to albedo, the set of new discoveries made by WISE are much closer to a diameter-limited survey than optical surveys, resulting in much better SFDs.
By observing asteroids at the time of their local afternoon and comparing this to their thermal fluxes in their local morning, WISE would enable measurement of the temperature differentials that give rise to the Yarkovsky effect, a phenomenon that is often the dominant uncertainty in the long-term orbit propagation for small asteroids. Measuring the Yarkovsky effect via the thermal infrared provides rather different information for a different population than the radar method (Chesley et al. 2003). The radar technique uses precision observations of an asteroid's trajectory over a decade to look for small changes to the ephemeris caused by the Yarkovsky force. In order to obtain sufficient astrometric precision, only NEOs which are very nearby can be observed. Radar data allow one to compute the tangential acceleration a produced by the Yarkovsky effect. However, using infrared to look for temperature differentials between an asteroid's local morning and evening requires only two epochs of observation separated by 3–8 months. The infrared technique is not limited to NEOs and will also work for Main Belt asteroids such as the Baptistina family. The infrared data allow one to compute the diameter which gives the mass m, and the morning versus evening difference gives the tangential force F. Thus, combining IR and radar data allows measurements of all the quantities in F = ma. For asteroids in a family, the change in semi-major axis divided by the age of the family gives an estimate for the acceleration a, so the IR data can be used to verify the time since the collision that created the family. The hypothesis (Bottke et al. 2007) that the K/T impactor was part of the Baptistina family depends on the estimated 160 Myr age of this family, so measuring the Yarkovsky force and diameter for a sample of Baptistina family members will provide a valuable test of this idea. The infrared Yarkovsky detection technique is improved by knowledge of an objects light curve, well measured by WISE.
4.4. Other Science Goals
An all-sky survey in the thermal infrared can be used to address many scientific questions, not all of which require surveying the whole sky. But by surveying the whole sky, WISE will enable these projects among many others.
4.4.1. Comet Trails and Zodiacal Bands
WISE will study the nearest planetary debris disk (PDD): our own zodiacal cloud and asteroid system. The interplanetary dust cloud is a complex distribution of dust grains from numerous sources evolving under the influence of planetary perturbations, collisional evolution, and solar radiation sources. The zodiacal dust cloud was long thought to come from comets (Whipple 1955, 1967, 1976) but current estimates of cometary dust production are an order of magnitude below that needed to maintain the cloud. The IRAS dust bands show that asteroids are a substantial contributor to the interplanetary dust cloud. There are at least seven dust band pairs girdling the ecliptic. Comet debris trails were also discovered by IRAS (Sykes et al. 1986, 1990) which provided more than 100 observations of the trails associated with eight short period comets. WISE scans through the ecliptic 30 times per day which will permit frequent observations of dust bands and comet trails with an angular resolution many times better than IRAS. This allows a detailed assessment of the population and evolution of these structures in the zodiacal cloud.
4.4.2. Young Stars and Debris Disks
WISE will provide a robust statistical database for studying star formation, the evolution of circumstellar disks, and the dissipation of zodiacal clouds around stars of all masses, extending even into the brown dwarf mass regime. Detecting the small IR excess from the later stages of disk dissipation requires the ability to accurately predict the long-wavelength photospheric emission and the ability to accurately measure the total long-wavelength emission. The simultaneous four color photometry provided by WISE will enable the required predictions, and the sensitivity of WISE will enable detection of optically thick disk emission for solar-type stars out to 1 kpc distance and down to the hydrogen-burning limit in the Taurus and Ophiucus star-forming regions. Because young stars are variable, the simultaneous four-color coverage of WISE provides a precise means of characterizing thermal excess from circumstellar disks or zodiacal material. (A possible second coverage of the object by WISE 6 months after the first will even provide clues as to the nature of the variability, e.g., extinction versus accretion.)
Because WISE is an all-sky survey it will reveal isolated young stars well outside obvious star-forming regions. For example, two of the nearest clusters (of any age) were discovered only within the last decade though their young stellar objects (YSOs) like properties: the TW Hydrae Association (d = 55 pc, by infrared emission) and the Eta Chamaeleonis Cluster (d = 96 pc, by X-ray emission). Both have about a dozen known members and are younger than 10 Myr. Surprisingly neither is associated with a molecular cloud. TW Hya covers more than 700 deg2. A complete survey would be an impossible task for missions like Spitzer but is the natural focus of WISE. Such intermediate-age very-nearby clusters provide an ideal laboratory for studying the late stages of planetary accretion.
WISE will find young stars which are still accreting molecular cloud material over a substantial fraction of the Galaxy: WISE will measure stars with optically thick circumstellar disk emission down to the hydrogen-burning limit (0.08 M☉) out to 500 parsecs (e.g., the Orion molecular cloud). Solar-type "Class I" and T Tauri stars (TTS) with optically thick disks will be found to substantial distances (Figure 18 shows the M0 TTS Sz 82 scaled to a distance of 2.5 kpc), thanks to their strong excesses at 12 and 22 μm. Expanding upon Spitzer's survey of selected regions of a few molecular clouds, WISE will provide a full inventory of low-luminosity YSO in many dozens of star-forming clouds extending over the entire sky. WISE will also discover hundreds of the very youngest stars: the elusive "Class 0" sources. These objects, which are in the early stages of gravitational collapse, are rare because they remain in this phase for less than 100,000 yr. They are deeply embedded in dust, so they are visible only at wavelengths longer than 20 μm, although they may be seen in scattered light in the mid-IR.

Figure 18. M0 T Tauri star at a distance of 2.5 kpc (TTS) and an A2 star with a planetary debris disk at 300 pc (PDD) compared to the WISE expected sensitivities. The unlabeled points for other surveys are the same as in Figure 15.
Download figure:
Standard image High-resolution imageWISE will survey PDDs around thousands of stars in the solar neighborhood. During the early stages of planet formation micron-sized grains accrete into successively larger particles. The resulting reduction in grain surface area makes the circumstellar disk optically thin, and the infrared excess substantially decreases. The disk does not clear uniformly due to both the variation in accretion/dynamical timescale with distance from the star, and the shepherding effects of forming planets (Kuchner & Holman 2003). This non-uniformity is evident in the distribution of infrared excess as a function of wavelength through the mid-infrared. WISE will exploit these signatures to reveal the systematics of and refine the timescales for disk clearing and solar system formation.
Although the planetesimal/planet formation phase is short-lived, dust excess signatures can persist into the main-sequence phase as demonstrated in stars like Vega by IRAS (Aumann et al. 1984). These excesses arise from small grains with Poynting–Robertson lifetimes of tens of thousands of years. Their existence argues that they must be actively replenished by the erosion of planetesimals and thus they are signatures of successful planetary formation. Indeed, high-resolution 20 μm imaging of infrared-excess objects like HR4796 reveal dust rings which may betray the existence of invisible planets. Figure 18 also shows the known debris disk system ζ Lep scaled to a distance of 300 pc. With the short-wavelength WISE bands pinning down the photospheric flux, the excess at 22 μm is easily detectable.
The sensitivity to see the photospheric flux and enough wavelength coverage to predict the photometric flux are, once again, the key to revealing excesses from eroding planetesimals. In addition to studying the statistical distribution of such small IR excesses, of great interest to the TPF mission, WISE will provide James Webb Space Telescope (JWST) with hundreds of targets for high-resolution imaging akin to the ground-based and HST images of HR4796.
4.4.3. Interstellar Dust
WISE detects most components of interstellar dust and produces very good maps of interstellar dust in the Galaxy. The 3.4 and 12 μm filters include prominent PAH emission features, the 4.6 μm filter measures the continuum emission from very small grains, and the 22 μm filter sees both stochastic emission from small grains and the Wien tail of thermal emission from large grains. The WISE survey will map the high latitude dust to a sensitivity 60 times better than IRAS at 22 μm and 200 times better at 12 μm. For typical high latitude dust showing PAH emission the 3.4 μm map will provide an S/N comparable in sensitivity to the 12 μm map. The WISE survey thus extends the mapping of high latitude dust to cover the entire sky, filling in the holes left by IRAS in the dimmest regions of sky, and extending the Spitzer legacy projects GLIMPSE and MIPSGAL to the entire sky. The 3.4 μm map will provide the first high sensitivity map of extended emission of the entire sky at this wavelength.
These extended emission maps will allow study of the composition and detailed structure of interstellar dust. Unique to WISE, a comparison of the 3.3 μm PAH feature with other PAH emission features in diffuse clouds can yield information on PAH composition. Results of the study of dust in the Galaxy can also be compared to dust emission detected by WISE in nearby galaxies.
4.4.4. Galactic Structure
Roughly half of the sky is dominated by the Milky Way's 400 billion stars, many of which are variable in the infrared. With deep simultaneous near- and mid-infrared observations, unique in an all-sky survey, the four-color WISE will address global issues of Galactic stellar structure and populations: the disk's warp and flare; the nature of the bar, Gould's Belt, ring, and bulge; a detailed census of evolved stars; and the pursuit of halo star streams from globular clusters and unmerged Galactic dwarf satellites. WISE complements Spitzer's Legacy Project, GLIMPSE, which surveyed <300 deg2 of the inner plane mostly constrained to |b| < 1°. WISE will cover all the Galactic plane, and secure critical off-plane star counts to probe the vertical population structure in the arms and spurs, and scale heights of the central bar, molecular ring, and bulge (disk contamination diminishes rapidly off the plane). Although the stellar counts are confusion limited near the Galactic plane with the WISE beam size and high sensitivity, the color–magnitude diagrams are robust to confusion effects; and thus delineation of differing stellar populations is still viable in the Galactic plane.
Off plane, unconstrained by confusion, WISE offers unparalleled infrared survey depth, uniquely capable of all-sky detection of even normal halo stars. The "Spaghetti Survey" (Morrison et al. 2000) of the halo uses optical photometry and spectroscopy to identify distant G-/K-giants and kinematic substructure caused by the destruction of accreted satellites. WISE will aid the optical quest for extra-tidal K-giants, detecting such stars to 70 kpc at 3.4 μm and 45 kpc at 4.6 μm, far beyond the depth of 2MASS at 2.15 μm. Comparing the optical spectra and WISE data on the quasi-continuum (3.4 μm) and CO fundamental (4.6 μm) in these cool stars to synthetic spectra will enable the recognition of those stars that belong to remnant stellar swarms from partly digested satellites.
4.4.5. Nearby Galaxies
The angular resolution and sensitivity of WISE allow detailed study of the internal structure of galaxies in the local universe, whose properties provide our basic understanding of high-redshift galaxies. For the ∼5000 galaxies within 20 Mpc of the Sun, WISE spatial resolution is <500 pc (<1 kpc at 22 μm). Of this set, nearly 400 will be highly resolved, delineating globular clusters, giant molecular clouds, and other discrete sites of star formation. Figure 19 shows WISE images of four well-resolved nearby galaxies. The short mid-IR bands of WISE are an effective probe of the underlying stellar population and are nearly immune to extinction. The long bands are sensitive to hot dust associated with star formation, thus bridging the time span between evolving generations of stars. WISE data will complement the Spitzer Infrared Nearby Galaxies Survey Legacy project (SINGS; Kennicutt et al. 2004), expanding the SINGS sample of 75 galaxies to many thousands of galaxies, covering the widest range in morphological type. It will also supplement the IRAC 3.6/4.5 μm Spitzer Survey of Stellar Structure in Galaxies (Sheth et al. 2008): WISE will provide the crucial mid-IR tracers of star formation activity for this complete sample of galaxies within 30 Mpc.

Figure 19. Four nearby spiral and irregular galaxies that are well resolved by WISE.
Download figure:
Standard image High-resolution image
4.4.6. Galaxy Clusters
WISE will provide a census of star formation in very large samples of normal galaxies and clusters out to cosmological distances. WISE will detect over 100 million galaxies in at least one band, and many million galaxies in all four of its bands. The short-wavelength W1−W2 color will be a useful redshift indicator for galaxies out to z = 0.5, and the flux measurements will provide an estimate for the total stellar mass of galaxies at z < 0.5 by measuring the rest-frame 1.6–2.2 μm emission (Gavazzi et al. 1996). WISE will thus provide a global history of star formation in massive field and cluster galaxies over the past 5 billion years.
Cluster galaxies generally contain stellar populations that are old relative to those in the surrounding field galaxies, so the contrast of galaxy clusters relative to the field increases with redshift when viewed in the IR. By virtue of covering the entire sky, WISE will be able to detect all massive (M>1014 M☉) galaxy clusters up to z ∼ 0.5, enabling the most complete census of the stellar mass in dense environments when used in conjunction with large-area optical imaging surveys such as SDSS, PanStarrs, DES, and LSST. When used with the higher spatial resolution optical imaging from these surveys, which can help to overcome the confusion limit in the WISE images, WISE will also be able to identify even higher redshift clusters (0.5 < z < 1) over thousands of square degree areas at the poles where the larger than the average number of WISE scans will lower the noise in the W1 data.
5. DATA PRODUCTS
WISE will produce an image atlas in its four colors that will be a stack of all the multiple frames covering each part of the sky. A catalog of sources extracted from these images will also be produced. These data products are modeled on the 2MASS image atlas and the 2MASS point source catalog. WISE is not planning to produce a separate extended source catalog.
In addition, the NEOWISE project is supporting the release of the individual WISE frames and a database of all the sources extracted from the individual frames. This data set will be very valuable for retrospective studies of asteroids discovered in the future.
There are two data releases scheduled for WISE. The first release will be a preliminary catalog and image atlas based on early data and covering more than 55% of the sky, to be released in 2011 April. The preliminary catalog will be complete to a depth of 20σ. A final data release covering the entire sky to a depth of 5σ will be released 17 months after the last data are taken.
6. PROSPECTS FOR FOLLOW-UP OBSERVATIONS
The low background from space makes the WISE survey very sensitive and allows it to cover the largest possible solid angle while still reaching fairly low flux levels. The faintness of the sources found by WISE makes follow-up with ground-based telescopes quite difficult in the thermal infrared. However, the time required for a detection scales like B/D4 for background B and telescope diameter D, assuming diffraction-limited optics, so it will be possible to confirm WISE sources with ground-based 10 m class telescopes, since the (10/0.4)4= 390,625 diameter factor almost compensates for the factor of 2.5 × 10⁶ in the backgrounds. Since WISE only integrates for 1.2 minutes on a typical source, 15 minutes on a 10 m class telescope can surpass the WISE sensitivity on point sources and give much better angular resolution. Even though ground-based follow-up in the thermal infrared is possible, the most useful ground-based follow-ups will probably be at complementary wavelengths. Examples include ground-based J-band measurements of WISE brown dwarfs, ground-based optical astrometry of WISE asteroids, ground-based optical spectroscopy of WISE ULIRGs and AGNs, and photometric redshifts of galaxies based on optical and infrared colors.
The JWST will also experience the low background intensity seen by WISE, will cover the WISE passbands, and will be much larger than WISE. Thus, JWST will be the most capable platform for studying WISE sources in the thermal infrared, since it will have both a large diameter and low background. WISE data at 3.4 and 4.6 μm will be used to improve the JWST guide star catalog by providing improved count rate predictions and more recent astrometry.
7. CONCLUSION
WISE has exploited the low infrared background in space and the power of large format infrared arrays to map the entire sky with unprecedented sensitivity and angular resolution between 3.4 and 22 μm. The WISE catalog and image atlas will be extremely valuable for a large number of astrophysical investigations ranging from asteroid albedos in the solar system through the stellar population of the solar neighborhood out to the most luminous star-forming galaxies in the visible universe.
This publication makes use of data products from the Wide-field Infrared Survey Explorer, which is a joint project of the University of California, Los Angeles, and the Jet Propulsion Laboratory/California Institute of Technology, funded by the National Aeronautics and Space Administration.