
Abstract
The elastohydrodynamic (EHD) lubrication regime occurs in many machine elements where a combination of hydrodynamic effect, elastic deformation of the loaded surfaces and increase in the viscosity of the lubricant with pressure ensures the formation of a very thin, but continuous film of lubricant separating the contacting surfaces. Electrical methods to determine this film's thickness have preceded optical methods, which are widely used today. Although they generally give more qualitative thickness information, electrical methods have the main advantage that they can be applied to metallic contacts in machines, which makes them useful tools in the study of elastohydrodynamically lubricated contacts. This paper is part of a larger study on the application of electrical capacitance for the evaluation of film formation in EHD contacts. The main focus is on the quantitative measurements of film thickness using electrical capacitance. A new approach allowing the lubricant film thickness to be extracted from the measured capacitance is developed using a chromium-coated glass disc and subsequently applied to a steel-on-steel contact. The results show good agreement with optical measurements and theoretical models over a range of film thickness.
Export citation and abstract BibTeX RIS
1. Introduction
Machine elements such as rolling-element bearings, gears and cams all contain surfaces in relative motion. Damage and ultimately the failure of the component are usually prevented by the interposition of a thin film of lubricant between those surfaces. Characteristic to these machine components is the nonconformity of the surfaces, which results in a small contact area and consequently pressures up to several gigapascals. In general, the thickness of the lubricant film generated under these conditions ranges from tens of nanometres to several micrometres and hence measuring techniques are required that provide high resolution and cover a wide range of film thickness values.
The most accurate experimental methods used to measure lubricant film thickness are based on optical interferometry. Although optical methods are most widely applied nowadays, they were historically preceded by electrical methods, based on the measurements of electrical resistance and capacitance [1]. Electrical resistance can give an indication of the level of direct metal–metal contact [2, 3], while capacitance is related to the separation between contacting surfaces. The advantage of capacitance over resistance is the fact that it increases when film thickness decreases, which makes it very suitable for measuring thin films. The capacitance, C, for two parallel conducting metallic plates of area, A, separated by a dielectric material with dielectric constant (relative permittivity) εr, is related to the thickness, h, of the dielectric by

where ε0 is the dielectric constant of vacuum.
Electrical methods have a major advantage over optical methods in that they do not require optical access to the contact, thus they can be directly applied to real machine elements made of conducting materials, such as steel. Optical methods, however, have proven to be sensitive, reliable and allow measurements over a wide range of film thickness with high precision. They have been and are still being used to develop and validate all the existing elastohydrodynamic (EHD) models, such as the well-known Hamrock–Dowson model for elliptical contacts [4]:

where
 is the non-dimensional central film thickness, U, G and W are the speed, material and load parameters and k is the ellipticity parameter.
The concepts behind optical interferometry are well known and the reader is referred to the literature [5–12]. When it comes to electrical film thickness measurement methods many previous experimental investigations were focused on the measurement of the film thickness in low-pressure systems such as piston-ring/cylinder pair [13, 14] and sliding bearings [15]. High-pressure, line or point contacts formed between rollers [16, 17], gears and cams [18–20] and rolling-element bearings have also been studied. Sub-surface capacitive sensors have also been used for the study of the pressure, shape and thickness of EHD films. Notable work in this area has been carried out by Crook [21], Orkutt [22], Hamilton and Moore [23], Safa et al, [24, 25] and Wilczek [26]. Kannel et al [27] focused their work on the evaluation of pressure distribution from the measurements of the deformed shape of the contacting area between rolling cylinders. This method gave reasonable agreement with results of numerical calculations. Kannel and Dow [28] use similar transducers to look into the correlation between pressure and temperature in EHD linear contacts. Bartz and Ehlert [29] also used sub-surface sensors to evaluate both film thickness and pressure in the contact formed between a pair of rollers. Their measurements confirmed that film thickness follows the Dowson and Higginson relationship for the variation of film thickness with load, pressure/viscosity coefficient and viscosity. Chua and Stachowiak [30] have also used electrical capacitance for the study of the boundary lubrication of organic films in sliding contacts. They use the parallel-plate capacitor formula, taking account of the real area of contact. They also make a pertinent discussion on the accuracy of the method, pointing out at the variation of the dielectric constant of the lubricant due to the presence of water and changes in lubricant's chemical structure caused by oxidation and polymerization.
Wilson [31] carried out a comprehensive, comparative study of the film thickness in roller bearings lubricated by grease and oil. He also made an analysis of the contribution of the loaded and unloaded sectors of a radially loaded bearing to the total capacitance measured and found that the loaded zone capacitance is at least ten times larger than the capacitance of the unloaded zone. Heemskerk et al [32] studied the film formation in rolling bearings. They used the percentage of metallic contact time to evaluate lubrication conditions in thin-film regime and capacitance for full film regime. ten Napel and Bosma [33] observed that for thin films there is a marked deviation of the film thickness measured with capacitance and theoretical values predicted by the Dowson and Higginson formula, for a line contact. They attribute this error to the surface roughness. Other recent studies reporting experimental results on the film thickness in rolling-element bearings by electrical capacitance are due to Wittek et al [34].
The aim of this work is to demonstrate that it is possible to use electrical methods, more specifically the capacitive method, to measure lubricant film thickness quantitatively. This is carried out by simultaneous measurement of EHD film thickness by an optical technique, and electrical capacitance of the contact. Because these two quantities are measured at the same time it is possible to evaluate the importance of all the factors influencing the capacitance and, as a result, to develop a general procedure that allows the evaluation of the lubricant film thickness from measured capacitance. The present investigation focuses on the 'thin-film' region, i.e. between about 15 and 200 nm. The lower limit of the film thickness is chosen to ensure full film, while the upper limit is dictated by the minimum contact capacitance which can be measured with good degree of accuracy in our experimental setup.
2. Principle of operation and experimental setup
2.1. Film thickness measurements by an optical method
The optical measurements of the lubricant film thickness were performed in an adapted EHD rig (PCS Instruments), where the contact under investigation is formed between a glass disc, with a semi-reflective chromium layer on the contacting surface, and a steel ball. An optical method based on the relative intensity of the interfered light was used. White light, after passing through a narrow band-pass filter, with a centre wavelength of 550 nm and a full-width at half-maximum (FWHM) of 10 nm, is directed onto the contact. After successive reflections at the chromium and steel surfaces, two rays interfere constructively or destructively, depending on their phase difference, determined by the lubricant's film thickness. Images, showing the map of the film thickness as levels of grey (intensity), were recorded at 20 N load over the range of entrainment speed between 0.010 and 0.250 m s−1 for PAO4 oil and a mixture PAO4/PAO40 at 25 °C (see table 1 for lubricant details).
Table 1. Lubricant viscosities.
| Lubricant | Viscosity at 40 °C [cSt] | Viscosity at 100 °C [cSt] |
|---|---|---|
| PAO4 (Durasyn 164, Shell) | 17.2 | 3.9 |
| PAO40 (Synton PAO40, Shell) | 396 | 39 |
| PAO4/PAO40 (25/75 wt%) | 150 | 19 |
Figure 1 shows an example of images of the interference pattern for different entrainment speeds. The chromium-coated glass disc was subsequently replaced by a 500 nm thick silica spacer layer disc used in the ultra-thin film interferometry (UTFI) technique [8], and central film thickness was measured and recorded under the same conditions.

Figure 1. Interference pattern of the contact for a range of lubricant film thickness (entrainment speed).
Download figure:
Standard imageThe intensity (grey level) of the central region of EHD contact (measured with chromium-coated glass disc) is then correlated with the central film thickness measured with the UTFI technique, allowing the construction of a relative intensity/film thickness calibration curve. This calibration curve can then be used to extract the film thickness from the measured relative intensity under different testing conditions. In order to avoid errors due to the variation of the intensity of the light source between tests, the actual intensity was normalized by dividing the local value by the maximum corresponding to that particular image.
Figure 2 shows an example of the variation of the relative intensity of the interfered light as a function of the optical film thickness (measured film thickness multiplied by the refractive index of the oil, n = 1.453). In order to obtain the real film thickness from the calibration curve, the optical film thickness corresponding to measured relative intensity needs to be divided by the refractive index of the lubricant. This procedure makes the calibration curve more general because the influence of the operating conditions (temperature and pressure) on the refractive index can also be considered. The shape of the curve deviates from a pure cosine shape, with sharper peaks and wider valleys. This is caused by multiple-beam interference (multiple reflections) as well as absorption in the chromium layer [10]. For a given chromium disc the curve is highly repeatable and independent of operating conditions (load, temperature, range of speeds).

Figure 2. Relative intensity as a function of optical film thickness.
Download figure:
Standard image2.2. Capacitance measurement
The same experimental rig was used to measure the capacitance of the contact. For this purpose the disc and ball are electrically insulated from each other and from the rest of the rig. The electrical signal used for measurements is collected by carbon brushes connected to both, disc and ball. A schematic of the test rig is shown in figure 3. An impedance/gain-phase analyser (Solartron 1260) was employed in this study. This instrument allows the measurements of electrical capacitance over the range of frequencies between 10 µHz and 32 MHz. A frequency of 200 kHz was selected for all tests, because it provided the most stable results. Assuming a dielectric strength of the oil of about 10–15 kV mm−1 [35] and a minimum film thickness to be measured of 10 nm, a voltage of 0.1 V was chosen in order to avoid electrical breakdown of the film. To provide representative results the integration time over which the impedance is measured was set to 1 s, and 50 capacitance values are averaged for each working condition employed in these tests.
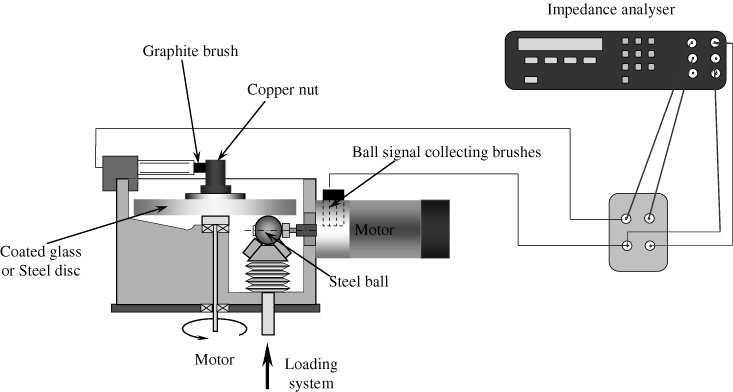
Figure 3. Experimental setup for capacitance measurements.
Download figure:
Standard image2.3. Materials and testing conditions
Measurement of the capacitance requires a certain minimum thickness of the chromium layer as otherwise the electrical resistance of the chromium is very large and the mechanical endurance very low. From the optical interferometry point of view the thickness of the chromium layer has to yield about 20% reflection at the glass/chromium interface [7]. This is achieved by a Cr-thickness of 5 to 10 nm which is also the value for the discs used in the UTFI technique [8]. A number of discs were tested and it was found that a thickness of ∼20 nm provides a good reflection/transmission ratio, sufficient durability and electrical properties. The roughness of the glass disc and steel ball was Ra ∼ 10 nm while for the steel disc Ra = 15–16 nm. The roughness of the specimens ensures on the one hand that full film condition is achieved even for the thinnest films studied, and on the other that complications due to the effect of roughness are avoided. It has been shown previously [33] that roughness can have a strong effect upon the capacitance measured in EHD contacts and also that electrical breakdown can take place at the tip of the asperities [32].
Tests were performed under pure rolling conditions, over the range of entrainment speeds between 0.010 and 0.250 m s−1 and applied loads from 10 to 30 N for chromium-coated glass disc, and between 10 and 40 N for steel disc. The Hertzian pressure for the highest load applied was 0.59 GPa (30 N) and 1.04 GPa (40 N), for glass and steel disc, respectively.
The capacitance measurements were performed using PAO4 and a PAO4/PAO40 mixture with properties listed in table 1. It is to be noted that these oils are neutral as it concerns their polarity.
2.4. Converting measured capacitance to film thickness
As was mentioned above, the measured capacitance, Ctotal, includes the capacitance of Hertzian contact, Ccontact, that of the region outside the contact, Cout, and a background capacitance. The latter is evaluated by measuring the capacitance of the system without the ball connected and was found to be of the order of femtofarads (fF), which can be neglected in comparison with the total measured capacitance, which is of the order of tens of picofarads (pF).
The procedure taken here is to first calculate Cout and subtract it from the measured value. The remaining capacitance is then equal to the capacitance of the Hertzian contact Ccontact. This can be used to calculate the film thickness assuming the parallel-plate geometry approximation (equation (1)). In order to calculate the outside of contact capacitance the area surrounding Hertzian contact is divided into to regions: the flooded and the cavitated region, as seen in figure 4, with corresponding capacitances: Cflooded and Ccav, respectively.

Figure 4. Schematic indicating the Hertzian contact area, the outside of contact region, and the assumed spatial distribution of oil around the contact.
Download figure:
Standard imageThe capacitance of the flooded region is calculated with the formula

where εair is 1, hc is the central film thickness and hgap is the gap between the solid bodies, given by the Hertzian deformation for dry contacts.
In the cavitated region it is assumed that the lubricant film splits into two and adheres to the solid surfaces, which is included in the following formula:

The area of the cavitated region, Acav, was estimated from the images of the contact and was found to be about 25% of the total area surrounding the contact. As the cavitated region and the rest of outside region are two capacitors in parallel, their capacitance is simply added giving Ctot = Ccav + Cflooded. The size of the area to be taken into account to calculate Cout is the area corresponding to the projection of the ball onto the disc.
The correct evaluation of the capacitance outside the contact is crucial for the accuracy of the film thickness calculations using the capacitance technique. It has to be noted that the outside of the contact capacitance depends on the load (area), film thickness (separation) and the dielectric properties of the lubricant (at atmospheric pressure and test temperature). Cout is calculated based on the profile of the deformed surfaces outside the contact, given by Hertz's theory, and film thickness measured with the optical method or calculated from theoretical models, such as the Hamrock–Dowson equation (2).
The dielectric constant εoil of the lubricant is one of the parameters without which film thickness cannot be extracted from the capacitance measurements and its variation with pressure must also be considered. For nonpolar lubricants the dielectric constant can be calculated from known models, such as Clausius–Mossotti [36]:

Here NA is the Avogadro number, α is the molecular polarizability, M is the molecular weight and ρ is the density. According to equation (5), the ratio (ε − 1)/(ε + 2) for any given substance is proportional to the density of that substance [36]. If the variation of the density with pressure is known, the permittivity at any given pressure can also be determined. The factor NAα/3M can be deduced from the value of the permittivity and density at atmospheric pressure. The variation of the density with pressure is estimated here according to the formula proposed by Dowson and Higginson [36]:

In this expression ρ0 is the ambient-pressure density and p is the pressure. The pressure dependence of dielectric constant calculated using this approach for PAO4 oil at 25 °C over the range of pressures up to 2 GPa is shown in figure 5.

Figure 5. Calculated dielectric constant change with pressure (PAO4, 25 °C).
Download figure:
Standard imageFigure 6 shows the pressure and the dielectric constant variation with pressure along the rolling direction, for 20 N load. The pressure distribution was obtained from film thickness maps using an inverse elastic approach and subsequently, the dielectric constant variation with pressure over the EHD contact has been calculated. Within most of the central region of the contact the dielectric constant varies only between about 2.30 and 2.36. This justifies the use of the maximum pressure for the calculation of the correction of the dielectric constant with pressure.

Figure 6. Distribution of pressure and dielectric constant in EHD contact across the rolling direction.
Download figure:
Standard image3. Results and discussion
3.1. Comparison between optical and capacitance-based film thickness
Simultaneous optical and capacitance film thickness measurements with chromium-coated glass disc were carried out for PAO4 and PAO4/40 mixture at 25 °C at a load of 20 N at varying entrainment speed. The test for PAO4 oil was repeated twice with one month interval and is compared together with a test for PAO4/40 mixture in figure 7. It can be noted that the four sets of data follow the same trend.
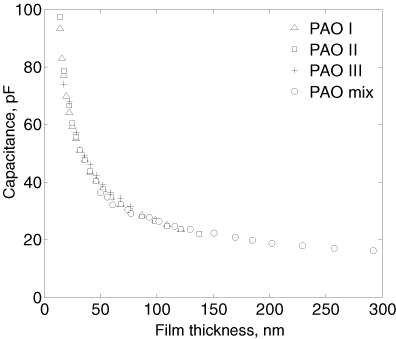
Figure 7. Capacitance measurements (Ctotal) as a function of optically determined film thickness. Three runs for PAO4 and one for the PAO4/40 mixture.
Download figure:
Standard imageFigure 8 shows, as a function of optically determined film thickness, the calculated capacitance of the contact and the calculated capacitance of the area outside the contact. Also shown is the ratio of total measured capacitance to that of the Hertzian contact.
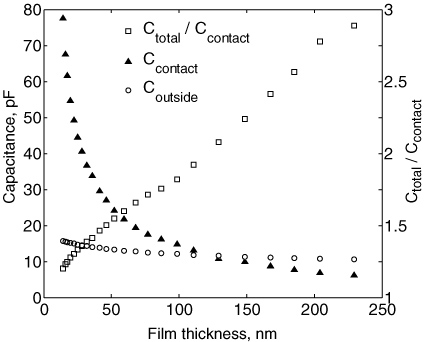
Figure 8. Hertzian (Ccontact) and out of contact (Cout) capacitances, as a function of optically measured film thickness.
Download figure:
Standard imageFor low film thickness values the contribution of contact capacitance in the total measured capacitance is much larger than that of the outside region. Conversely, at films thicker than about 110 nm (for 20 N load) the capacitance of the outside region becomes larger than that of the contact. The ratio between the total and contact capacitances clearly varies with film thickness from a value of roughly 1 to 3. In the range of film thickness considered here this ratio does not level off, which indicates that assuming a constant ratio between total measured and contact capacitance would lead to significant errors in film thickness determination. Therefore, it follows that the evaluation of the outside capacitance and thereby the Hertzian contact capacitance has to be carried out for every experimental condition separately.
3.2. Procedure for calculation of film thickness from capacitance
The analysis presented in the previous section leads to a clear procedure for extracting film thickness from capacitance measurements with known and traceable assumptions.
This procedure includes the following steps:
- (1)measurement of total capacitance Ctotal,
- (2)determine the central film thickness of the contact, either by optical measurement or by calculation using one of the appropriate established formulae, e.g. Hamrock–Dowson for elliptical contact [4],
- (3)evaluation of outside of the contact capacitance Cout,
- (4)calculation of the contact capacitance by subtracting the outside capacitance from the total measured capacitance, Ccontact = Ctotal − Cout,
- (5)evaluation of the dielectric constant at maximum Hertzian pressure,
- (6)calculation of the film thickness with a formula (equation (1)).
The procedure has been applied to a glass-steel contact, for which the central film thickness was also measured by optical interferometry. The film thickness calculated from capacitance and measured by optical interferometry, for the PAO4 oil at 20 N and 25 °C, is presented in figure 9. The theoretical film thickness calculated by the Hamrock–Dowson formula is also shown for comparison. Good agreement can be observed between the three sets of data over the range of tested speeds.
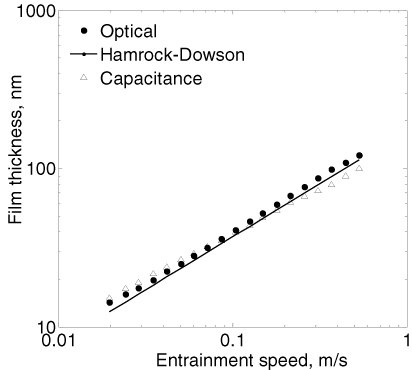
Figure 9. Comparison between theoretical and experimental film thickness (chromium-coated glass disc, PAO4, 40 N, 25 °C).
Download figure:
Standard imageThe tests were also performed for the same lubricant for three different loads, 10, 20 and 30 N. Figure 10 shows the resulting film thickness extracted from capacitance function of entrainment speed for various loads. The film thickness range studied here was between about 20 and 70 nm. This lower range of film thickness was determined by the fact that, in steel/steel contacts, at lower loads and larger film thicknesses, the measured capacitance was very small. The agreement for all three loads is reasonable, although the experimental changes are larger than expected from theory. The trend of slightly smaller film thickness with increasing load is reproduced. It is well known that the EHD film thickness varies little with load, as indicated also by the exponent of −0.067 in the Hamrock–Dowson equation (2).
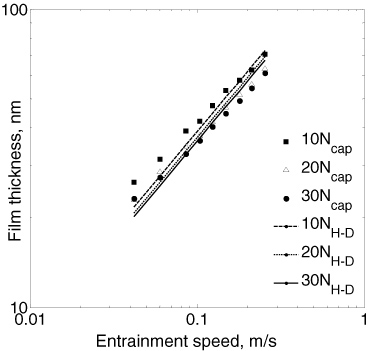
Figure 10. The effect of load upon film thickness extracted from capacitance (chromium-coated glass disc, PAO4, 10–40 N, 25 °C).
Download figure:
Standard image3.3. Evaluation of film thickness in steel–steel contact
The capacitance method of evaluating EHD film thickness is especially suited for steel-on-steel contacts, typical to many machine elements. In such applications optical interferometry measurements are not possible therefore at the second step of the procedure shown in the previous section, the central film thickness was initially estimated by the Hamrock–Dowson equation (2). This step was necessary for the calculation of the outside of contact contribution. The region outside of the contact considered for this calculation extended to the area covered by the projection of the ball onto the flat, disc surface. This was justified by the size of the lubricant meniscus observed with the glass disc; however, in other situations (e.g. rolling bearings contacts) the size of this region needs to be considered from lubrication conditions. The authors will detail this approach in a future publication. Once this was determined, the Hertzian contact capacitance was extracted and from it the average film thickness, according to equation (1). The dielectric constant of the lubricant was evaluated from equations (5) and (6), taking into account the Hertzian pressure in the steel–steel contact. In order to further validate the present approach, capacitance measurements of the contact between a steel disc and ball were carried out and compared with the Hamrock–Dowson theoretical values.
Figure 11 shows the film thickness, extracted from capacitance measurements of a steel–steel contact, for PAO4 at 40 N, together with the theoretical film thickness. Within measurement accuracy, there is excellent agreement for the whole range of speeds. In this case, for film thickness larger than about 170 nm, the contact capacitance is of the order of few pF, making the uncertainty of the measurement relatively large and the results are not presented here. This value of the film thickness is characteristic to the current experimental setup. For higher loads and/or different geometries (e.g. those typical to rolling bearings) the contact area and consequently the measured capacitance is larger, thus thicker films can be evaluated.

Figure 11. Theoretical and measured film thickness in steel–steel contact (PAO4, 40 N, 25 °C).
Download figure:
Standard imageThe tests were also carried out at four different loads (10 to 40 N) and they show the same trend between theoretical and measured values of film thickness (figure 12). The film thickness values calculated from measured capacitance are within 10% from theoretical predictions as indicated by error bars, and within the confidence of the measurements theory and experiments are in good agreement. As expected, at thicker films (larger entrainment speed) smaller contact capacitance resulted in lower accuracy of the measurements.
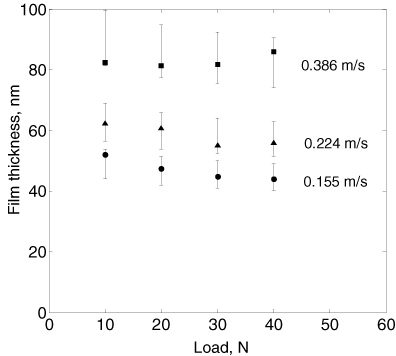
Figure 12. Effect of load upon film thickness in steel–steel contact. Line—Hamrock–Dowson; symbol—calculated from capacitance (PAO4, 10–40 N, 25 °C).
Download figure:
Standard image4. Conclusions
Quantitative film thickness measurements using electrical capacitance in a contact formed between a glass, chromium-coated disc and a steel ball have been performed. By parallel evaluation of the film thickness and capacitance, the correlation between these two quantities has been obtained in a range of film thickness between 15 and 200 nm.
The film thickness extracted from capacitance measurements was compared with that measured by optical interferometry and a very good correlation between these sets of values was found. In steel–steel contacts the central film thickness needs to be first predicted by a theoretical formula (e.g. Hamrock–Dowson) in order to evaluate the Hertzian contact capacitance.
The electrical capacitance measurements presented in this paper demonstrate that it is possible to make a quantitative evaluation of film thickness in a model EHD contact. The use of the parallel-plate capacitor formula is justified by the presented results for a ball-on-flat configuration. For this method to be applicable to machine elements, such as rolling-element bearings, more work is needed to study the influence of geometry of the contact surfaces on the outside of contact capacitance. It is also necessary to better understand the influence of lubricant type on capacitance measurements. For example, different base oils have different dielectric properties, pressure–density relations, pressure–viscosity relations, temperature–viscosity dependence, etc. The influence of lubricant additives that can form an electrically insulating tribo-chemical layer on the capacitance measurements needs to be investigated as well.