Abstract
This paper describes an interactive tool for analysis of data from the ATLAS experiment taking place at the world's highest energy particle collider at CERN. The tool, called HYPATIA/applet, enables students of various levels to become acquainted with particle physics and look for discoveries in a similar way to that of real research.
Export citation and abstract BibTeX RIS

Content from this work may be used under the terms of the Creative Commons Attribution 3.0 licence. Any further distribution of this work must maintain attribution to the author(s) and the title of the work, journal citation and DOI.
1. Introduction
Since 2008 the LHC [1], the world's largest and most powerful particle accelerator, has been searching for answers to the fundamental questions of physics. It was built at CERN [2], over the course of ten years by a collaboration consisting of more than 10 000 scientists and engineers from more than 100 countries. It has been called 'the experiment of the century', but several large experiments take place in its underground tunnel. The largest is the huge ATLAS [3] experiment/detector, which has been taking data from hadron–hadron collisions since the end of 2009.
ATLAS is a precision instrument the size of a seven storey building and perhaps the largest collaborative effort ever attempted in the physical sciences. Its members include 3000 physicists from 176 institutes all over the world. ATLAS detects billions of collisions every day and a small fraction of them is recorded for later study. The registered products of the collisions are called events and are the data used by HYPATIA [4] (HYbrid Pupil's Analysis Tool for Interactions in ATLAS) in various scientific and educational scenarios.
It is widely known that high school students have very little knowledge about particle physics and modern physics in general. Most of the school curriculum is focused on basic physics concepts which have been known for centuries. There is very little information about the current state and direction of physics and state-of-the-art research. Nuclear and particle physics is very rarely mentioned in class. This leaves students with a very stale and antiquated perception of physics and fails to ignite their interest in the subject. HYPATIA is a tool that can be used to bridge this gap by involving students in something which is happening right now: the analysis of ATLAS data. The large media coverage of the recent Higgs-like particle discovery at CERN has generated a lot of interest from the general public and among students. This can be used as an incentive for students to get involved in high energy physics exercises using HYPATIA, which can lead to an increased general knowledge about modern physics and its recent discoveries. In addition, HYPATIA should be considered to be a tool for the various enquiry based science teaching models.
2. The HYPATIA/applet
HYPATIA offers a graphical representation of ATLAS event data. The students can play with the events and in this way study the fundamental building blocks of nature and their interactions. At the same time, students can learn how the gigantic state-of-the-art detectors work. This gives students a realistic and exciting look at the research being done at CERN and stimulates an enthusiastic interest in it and at possible scientific careers. HYPATIA/applet is also very flexible in the sense that educators can choose the level of difficulty they want to attain and that they can also adopt the tool for their own applications according to the student's background. It has been tested through the 'Discover the COSMOS' [5] EU-funded educational/coordination project in several schools and by teachers from different countries. An advanced version of it is used at university level and more specifically by students in the fourth year undergraduate laboratories at the University of Athens, Greece.
HYPATIA runs on almost any operating system and web browser. It requires very few resources and can be used freely from the University of Athens/IASA site. The applet is quite simple and intuitive to use for the purpose of this exercise, but some basic computer skills are required. Figure 1 shows the overall view of the HYPATIA applet.
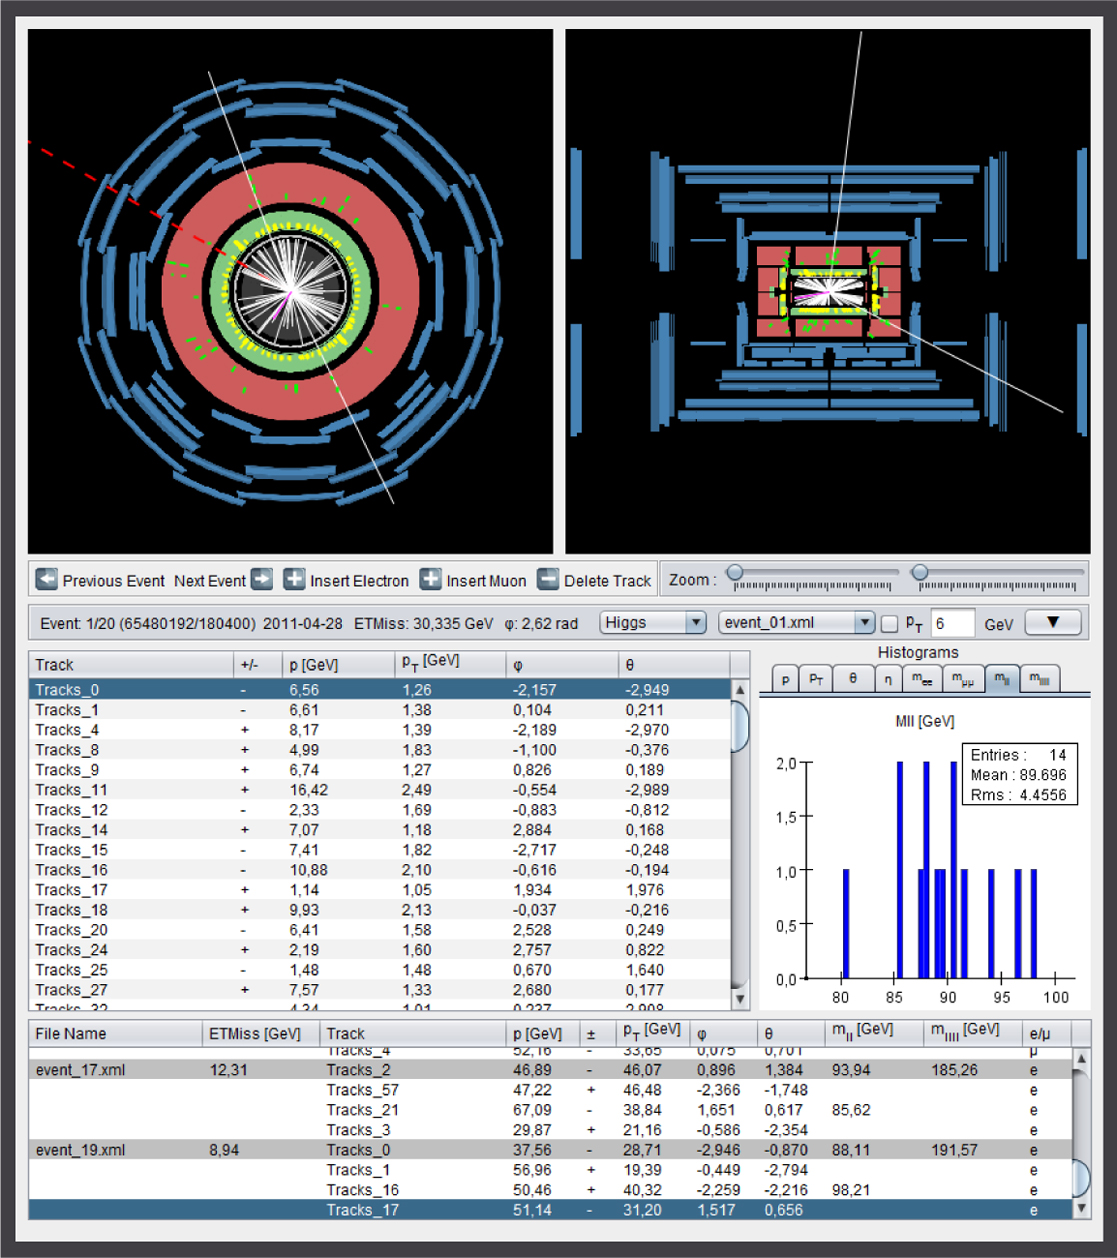
Figure 1. HYPATIA applet—full version.
Download figure:
Standard image High-resolution imageThe applet supports four different versions aimed at various levels of users. The first level, shown in figure 2, consists mainly of the two canvas views which display sections of the ATLAS detector. The user can browse through different events using the 'next event' and 'previous event' buttons and observe the number of tracks per event and their distribution in each view. This is a good starting point for entry level users who only want to get an idea of what the ATLAS detector looks like and how particle tracks are detected.

Figure 2. HYPATIA applet 1.
Download figure:
Standard image High-resolution imageThe second level of the applet is HYPATIA 2, figure 3, which adds the track momenta table. Here, the user can look at the different kinds of tracks. The muons should reach the muon detectors (the blue chambers) in at least one of the views and the electrons should stop in the electromagnetic calorimeters (green ring) depositing considerable energy there (yellow marks) in at least one of the views. The user can study the properties (energy/momentum, direction and charge) of each track and see how the different kinds of particle behave in each layer of the detector.

Figure 3. HYPATIA applet 2.
Download figure:
Standard image High-resolution imageThe third level is shown in figure 4, which includes the invariant mass table. Here the user can study the decays of short-lived particles such as the Z0 and Higgs bosons. When two or more particle traces in the detector, 'tracks' in one 'event', originate from the same point, which we call the 'vertex', they may belong to one original particle which decayed into these tracks. In order to check this hypothesis the user has to calculate the 'invariant mass' of the original particle and investigate if these decay products came from the same particle. In other words, to investigate if the products, the two muons or two electrons in the case of the Z0 boson, belong to the decay of the Z0 which has a mass of approximately 91.2 GeV.
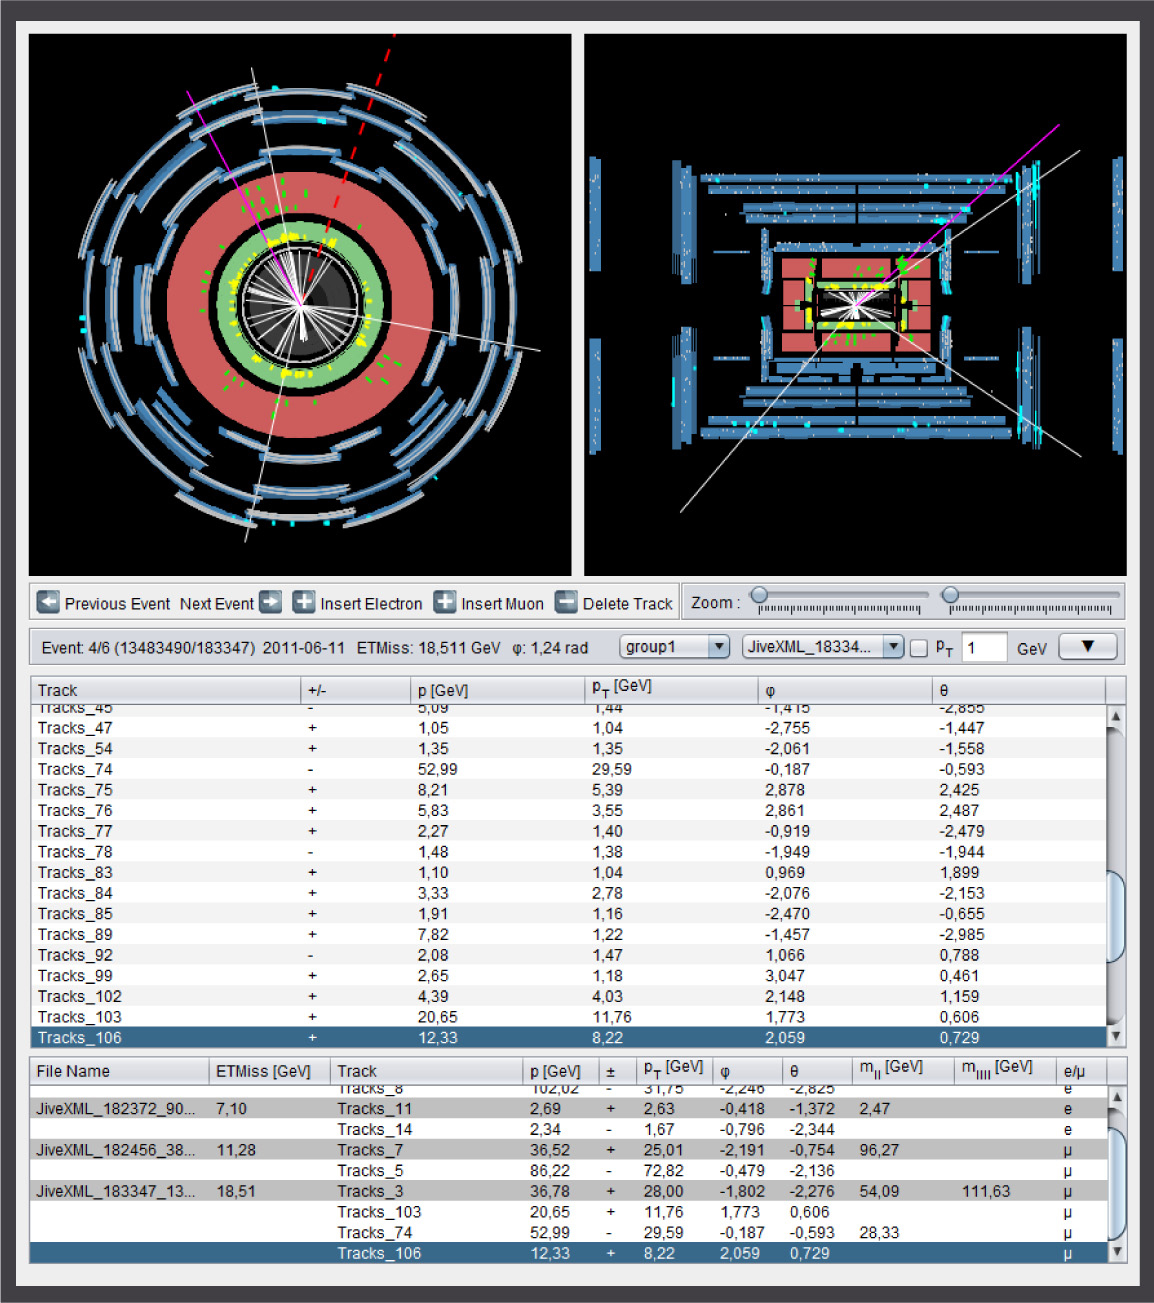
Figure 4. HYPATIA applet 3.
Download figure:
Standard image High-resolution imageFor that purpose, the user has to find two muons or two electrons and use the 'insert electron' or 'insert muon' button twice to insert them into the invariant mass table, which calculates the invariant mass value automatically, which appears under column mll. If the invariant mass is made from a two-electron combination, an 'e' is marked in the last column; otherwise if it is made from a two-muon combination, a μ is marked in the last column. Note that one-muon and one-electron combinations are not permitted because they violate lepton number conservation. One can also delete tracks with the 'delete track' button and replace them with others.
The full version of the applet, shown in figure 1, adds various histograms, which are automatically generated from the tracks that the user adds to the invariant mass table. This is the version which is used for the following exercise.
3. Exercise preparation
This exercise uses real events collected by the ATLAS experiment. The student first needs to open a web browser in which the Java plugin is installed and activated. Java [6] can be freely downloaded from Oracle's website. HYPATIA will run on any OS that can support Java (currently Windows, Linux, Solaris and OSX) and is compatible with both Java 6 and 7.
To run the application, the student needs to browse to the HYPATIA website and select her/his language. Then (s)he can choose from the four available versions of HYPATIA. In this exercise the full version of the applet is used.
When the applet is loaded, the student needs to select the appropriate group of events from the dropdown list (figure 9) below the canvas. In this exercise any of the groups 3A, 3B or 3C can be used. Each of them contains 50 real events detected by ATLAS and specially selected for the purposes of this exercise.
The two main displays of HYPATIA at the top of figure 1 are the canvas views, which display the events graphically. The one on the left (transverse view) displays a slice of the ATLAS detector1 perpendicular to the direction of the beams at the exact point where the collisions take place. Parts of the detector appear as concentric circles of different colours. In this view only the cylindrical detectors of ATLAS—the barrel part—are visible, while the forward sections of ATLAS are not.
The view on the right (side view) displays the ATLAS detector from the side, parallel to the colliding beams. An example of how different particles interact with different layers of the detector is shown in figure 8. The structure of the detector as it appears in the HYPATIA canvas is explained in detail on the HYPATIA website [7].
The track momenta table, shown in figure 5, displays information about the tracks of the event. Each line in this table represents a track, which is also displayed on the canvas as a line. This allows the user to get a quick but detailed view of the properties of each track (momentum, angles, etc) and select tracks of special interest. When the user clicks on a track it is automatically selected on the canvas so that the user can see where it was detected. The opposite is also true, the user can click on a track on the canvas and it will automatically be selected in the track momenta table and in the invariant mass table if it has been inserted there.

Figure 5. HYPATIA track momenta table.
Download figure:
Standard image High-resolution imageThe invariant mass table, displayed in figure 6, is the main analysis tool of HYPATIA. The tracks are added here from the track momenta table and are sorted by event. For each event, the corresponding invariant masses are automatically calculated for each group of two and four tracks. This allows the user to determine whether these tracks are the result of the decay of a short-lived particle, such as the Z0 boson, and infer the type of the unseen particle. The user can also create histograms, as shown in figure 7, from various attributes (mass, angles, momentum etc) of the tracks included in this table. This allows for easy comparison and confirmation of the experimental results.
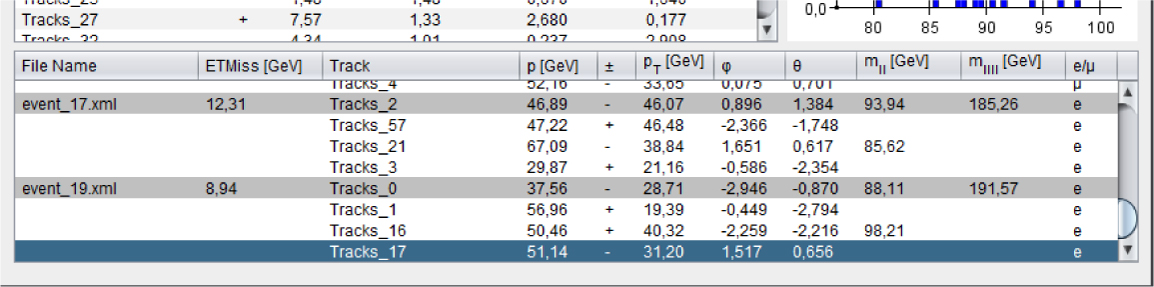
Figure 6. HYPATIA invariant mass table.
Download figure:
Standard image High-resolution image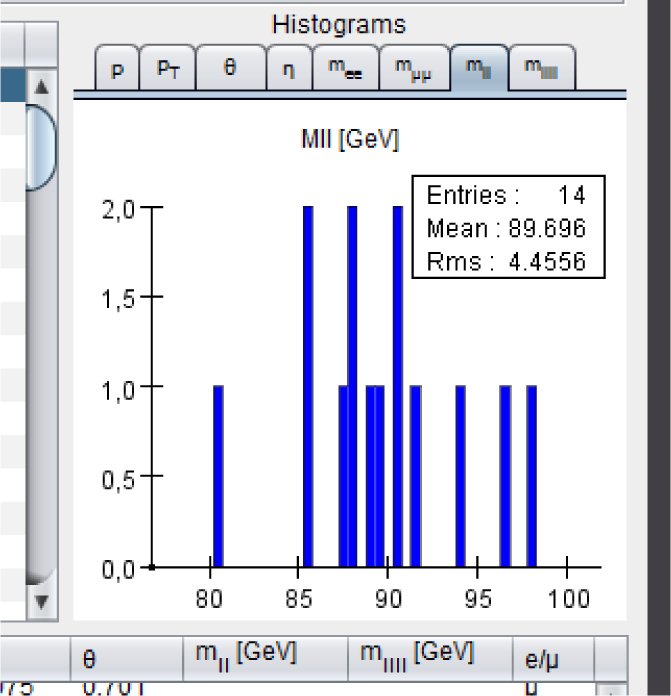
Figure 7. HYPATIA histogram of the invariant masses of reconstructed Z0 particles.
Download figure:
Standard image High-resolution image4. Student activity one—browsing through events, conservation of momentum
Using the simplest version of HYPATIA (figure 2), students can browse through the events and get a general idea of what the real particle collisions at the world's highest energy look like. The teacher can explain how each of the lines represents a particle trajectory in the detector and the meaning of the yellow and green marks on the calorimeters that indicate energy deposits. More details of the different particles' signatures on a wedge of the detector are schematically shown in figure 8.
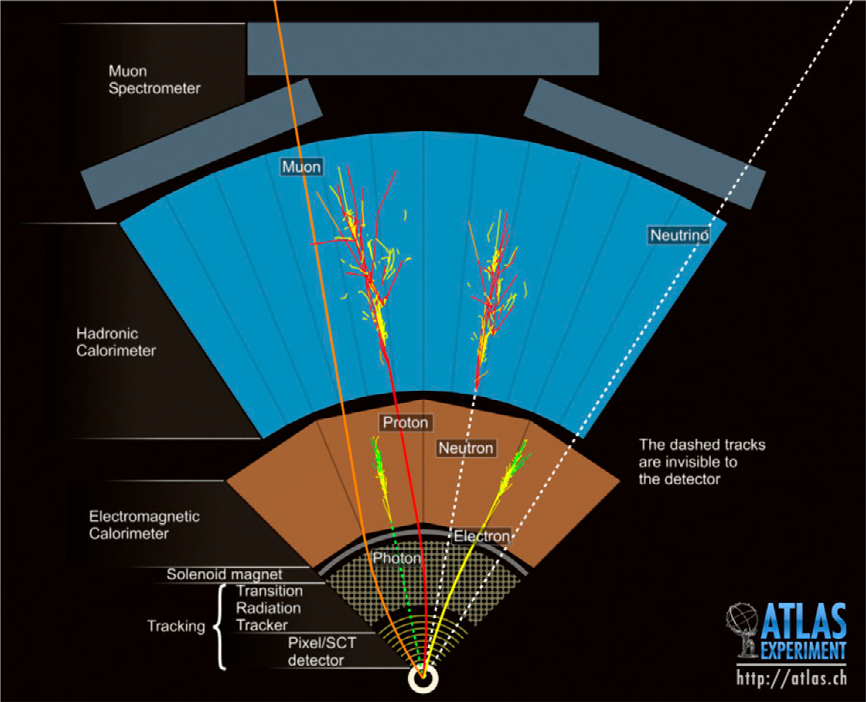
Figure 8. Schematic of how different particles interact with the ATLAS detector.
Download figure:
Standard image High-resolution image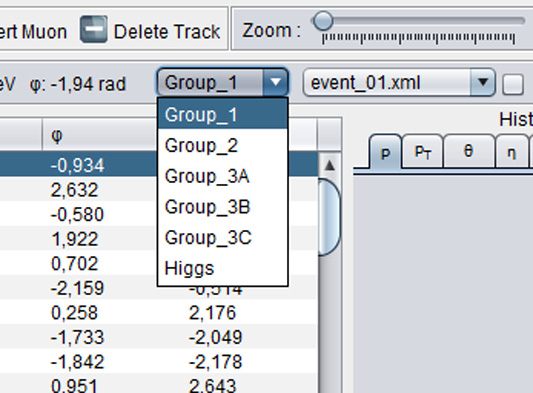
Figure 9. Event group selection.
Download figure:
Standard image High-resolution imageThe teacher can also talk about the conservation of momentum in the plane perpendicular to the beams (X–Y view). On that plane, before the collision of the beams we know that the total momentum is zero. After the collision the sum of the momenta of the particles that are produced must also be zero. However, experimental errors in the measurement, on-active material which is not accounted for, cracks in the detector as well as the presence of neutrinos which are impossible to detect in ATLAS could result in a non-zero momentum balance (missing momentum in the transverse plane). The direction of this missing momentum ETMiss, which is in the opposite direction of the total momentum, is indicated by the dashed red line. Depending on its magnitude the students can investigate if this could be attributed to the presence of neutrinos. This is the subject of a lesson plan included in the resources of the Discover the COSMOS portal [8].
5. Student activity two—identifying electrons and muons
Using the second HYPATIA applet (figure 3), the students can look at events and try to identify the tracks that represent electrons/positrons or muons/antimuons, which will then be used in subsequent exercises.
Electrons are among the constituents of atoms and students should be familiar with them. In the ATLAS detectors the electron/positron tracks are shown as small tracks at the centre of the detector (tracking chamber) that are usually isolated and leave a lot of energy (shown as yellow marks) in the electromagnetic calorimeter. An example is shown in figure 10.

Figure 10. A pair of electron–positron tracks that travel through the inner detector and deposit their energy at the electromagnetic calorimeter.
Download figure:
Standard image High-resolution imageMuons appear on the surface of the Earth as the main constituents of cosmic rays. If the students are not familiar with them, the teacher should give a small introduction and explain them as being 'heavy' electrons. In the ATLAS detector the muon/antimuon tracks are shown as long tracks that start at the centre of the detector—the collision point—and reach the muon chambers, as shown in figure 11.
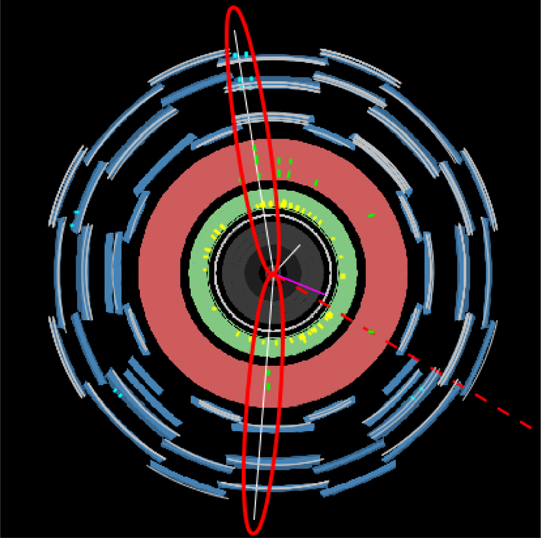
Figure 11. A pair of muon–antimuon tracks that travel through all parts of the ATLAS detector.
Download figure:
Standard image High-resolution imageWe must point out here that although muons are very easy to identify, the students need to look at both views of the detector in order to make sure that the track they are examining is indeed a muon. This is due to the fact that the forward muons (muons which follow a path very close to the beams) will be shown as shorter tracks in the X–Y view of the detector, as shown in figure 12.
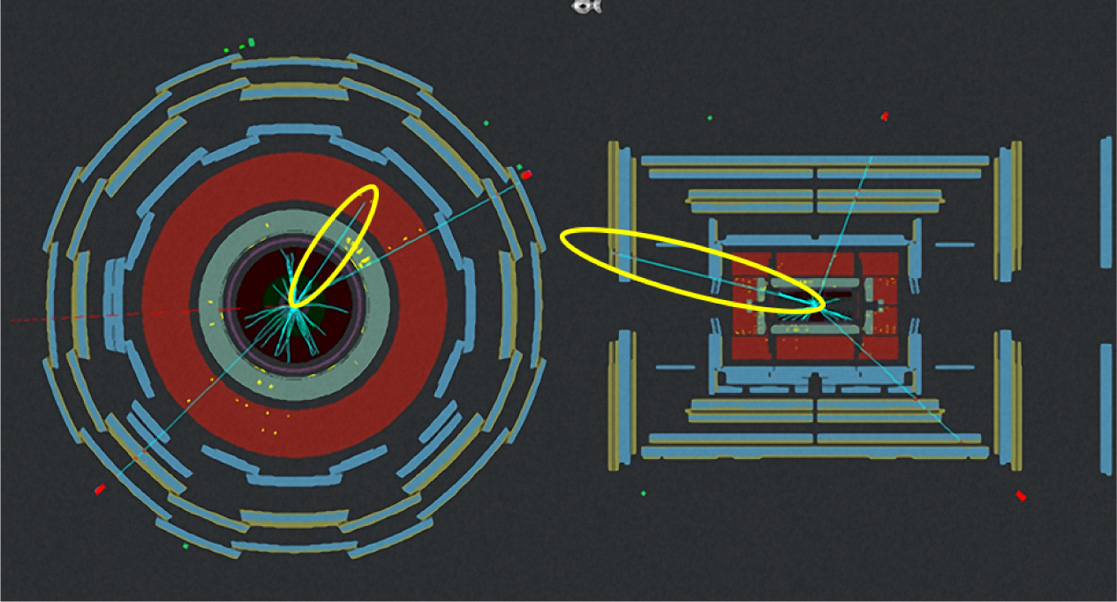
Figure 12. A forward muon track.
Download figure:
Standard image High-resolution imageAlso, while electrons as shown as short tracks, this does not mean that all short tracks are electrons. In fact most of them are not. Students must look for electrons based on the criteria mentioned above.
6. Student activity three—identifying the Z0 boson and measuring its mass
The Z0 and W bosons are the mediators of the weak interaction (one of the four forces governing nature), more commonly known as radioactivity. The Z0 boson is neutral and decays very rapidly in a number of different ways. This means that it cannot be directly observed, but instead, one has to look for the products of its decay in order to infer its existence. In this exercise the students study the Z0 → e+ e− and Z0 → μ+ μ− decays with the third HYPATIA applet. By identifying those tracks and inserting them into the invariant mass table, their invariant mass is automatically calculated and so the user can determine whether these tracks are the result of the decay of a short-lived particle, such as the Z0 boson, and in this way infer its existence. In the 'help' menu a description of the invariant mass formula is given as explained below.
The user can also study the corresponding histograms which are automatically created from the invariant mass table tracks, as described in section 'Exercise preparation'.
6.1. Exercise
Every group of events contains some which are decays of the Z0 boson into a pair of leptons (Z0 → e+ e− and Z0 → μ+ μ−). The rest of the events are called background events and come from a multitude of physical processes (cosmic rays, other particle decays, etc). The student's task is to recognize events which contain Z0 boson decays and insert them into the invariant mass table. There, (s)he will calculate their invariant mass and plot a histogram showing the mass and width of the Z0 boson itself.
The student needs to be careful because most of the small tracks are not electrons and positrons, and even if they are, they do not always come from a Z0 boson decay. Also, besides the Z0 → μ+ μ− events, in the sample there are also events in which the muons originate from jets (quark decays) and cosmic rays. These events are part of the background. The student needs to recognize only the electrons/positrons and muons/antimuons that come from Z0 decays.
The criteria by which the student can distinguish the Z0 boson decays from the background are:
- two tracks with opposite charge, not diametrical, usually isolated;
- leptons with high transverse momentum (PT);
- invariant mass close to 91.2 GeV (the Z0 mass); and
- small missing momentum/energy ETMiss < 15 GeV.
In contrast, background events have:
- large ETMiss (background events usually contain neutrinos which cannot be seen and therefore ETMiss is large);
- cosmic rays that form a straight line going through the detectors in both views; and
- jets with many tracks concentrated in a small area.
When a student recognizes a pair of tracks that belong to a Z0 decay, s/he inserts them into the invariant mass table by selecting them one by one and pressing the appropriate (electron or muon) button. There, the invariant mass that corresponds to the tracks is calculated. If this mass is close to 91.2 GeV then the tracks indeed come from a Z0 decay. All background events should be ignored.
The invariant mass can also be calculated directly from the known relativistic formula

where E is the total energy

and p the total momentum

After the student goes through all the events of the group, s/he looks at the histograms of the invariant masses of Z0 → e+ e− and Z0 → μ+ μ− (mee and mμμ histograms), which are generated automatically. (S)he compares the two masses and discusses the differences, if any. Because of lepton universality the two masses—excluding errors—should come out the same. Also the number of Z0 to electron and Z0 to muon decays should be about the same because there is no preference towards either decay mode.
Following that, the students look at the mll histogram and determine the overall mass and width of the Z0 boson. Then they compare them with the relevant quantities from the tables. The difference is attributed to the experimental resolution. They also compare their results with those of their classmates and discuss any differences they may have.
6.2. Remarks
The above scenario is created to give the students the opportunity to discover certain physical principles on their own and understand how an invisible particle can be 'seen' and its mass calculated, based on its decay products. The students also have to prepare a report outlining their results.
6.3. Student activity four—identifying the Higgs boson
The Higgs boson was proposed almost fifty years ago by a team of six theoretical physicists, one of them being Peter Higgs. It is the mediator of the Higgs field, which is responsible for the mass of some of the elementary particles.
The Higgs boson is an unstable particle that quickly decays and is impossible to detect directly, just like the Z0 boson. One of the ways in which it decays is into a pair of Z0 bosons, figure 13, which in turn each decay into a pair of leptons. We therefore have the following possibilities of Higgs bosons decaying into four leptons:
- H → 2e− 2e+;
- H → 2μ− 2μ+;
- H → e+ e− μ+ μ−.
This means that in order to infer the existence of the Higgs boson, in this exercise, the user needs to identify two pairs of leptons in the same way as in the previous Z0 exercise.

Figure 13. The decay of the Higgs boson.
Download figure:
Standard image High-resolution image
6.4. Exercise
First, the user selects the Higgs group of events from the dropdown list, figure 9. Then by looking at the events one by one the user has to decide which of them contain two pairs of leptons that come from Z0 decays. When those four tracks are identified, using the same criteria as in the previous exercise, the user inserts them into the invariant mass table, in which the mass of the Z0 bosons is calculated as before. In addition to that, the invariant mass of the four tracks is also calculated and shown in the mllll column. This is the mass of the Higgs boson. By looking at the corresponding histogram, the user can measure the mass and width of the Higgs boson.
6.5. Remarks
Due to limitations in the availability of real Higgs-like events, the events used in this exercise are comprized of two Z0 boson decays. This means that the calculated invariant mass of the Higgs bosons does not correspond to that of the real Higgs particle that was recently discovered at CERN.
7. Summary
The goal of the above exercises is to allow high school students to study different aspects of the fundamental building blocks of nature. They also learn about the fundamentals of particle detector operation and study the way in which particles interact with them and leave a characteristic signature according to their different types.
Students who most likely have never come into contact with particle physics are shown what a real researcher does and how new particles are discovered. This gives students a realistic and exciting look at the research being done at CERN and stimulates an enthusiastic interest in it. It also inspires teachers to talk to their students about particle physics and shows them a way to integrate it into their class at a level that is suitable to their students.
Using HYPATIA, students can experience how a researcher works and appreciate the difficulty and complexity of the work being done. They see how scientific enquiry works in real life. This has the objective of igniting the student's interest in particle physics, and physics in general. Our aim is to drive students to learn more on their own and investigate further and even pursue a career in physics.
Several teaching scenarios/lesson plans classified with a search mechanism according to age, difficulty, duration, keywords, etc based on the above examples can be found in the repository of the portal of the 'Discover the COSMOS' project [9].
Acknowledgments
We wish to thank the ATLAS experiment collaboration. With their permission, it was possible to use real collision data for the education exercises. The work was co-financed by the European Commission under project 'Discover the COSMOS' FP7-Coordination action RI-283487.
Footnotes
- 1
Biographies

Christine Kourkoumelis is a professor of physics at the University of Athens, Greece, the coordinator of the LA@CERN and Discover the COSMOS EU projects and the co-coordinator of the ATLAS experiment outreach committee. She shared the European Physical Society 2011 outreach award.

Stylianos Vourakis holds a degree in physics and a master's degree in computer science from the University of Athens and is the principal author of HYPATIA.