
Abstract
Imaging has become an essential tool in modern radiotherapy (RT), being used to plan dose delivery prior to treatment and verify target position before and during treatment. Ultrasound (US) imaging is cost-effective in providing excellent contrast at high resolution for depicting soft tissue targets apart from those shielded by the lungs or cranium. As a result, it is increasingly used in RT setup verification for the measurement of inter-fraction motion, the subject of Part I of this review (Fontanarosa et al 2015 Phys. Med. Biol. 60 R77–114). The combination of rapid imaging and zero ionising radiation dose makes US highly suitable for estimating intra-fraction motion. The current paper (Part II of the review) covers this topic. The basic technology for US motion estimation, and its current clinical application to the prostate, is described here, along with recent developments in robust motion-estimation algorithms, and three dimensional (3D) imaging. Together, these are likely to drive an increase in the number of future clinical studies and the range of cancer sites in which US motion management is applied. Also reviewed are selections of existing and proposed novel applications of US imaging to RT. These are driven by exciting developments in structural, functional and molecular US imaging and analytical techniques such as backscatter tissue analysis, elastography, photoacoustography, contrast-specific imaging, dynamic contrast analysis, microvascular and super-resolution imaging, and targeted microbubbles. Such techniques show promise for predicting and measuring the outcome of RT, quantifying normal tissue toxicity, improving tumour definition and defining a biological target volume that describes radiation sensitive regions of the tumour. US offers easy, low cost and efficient integration of these techniques into the RT workflow. US contrast technology also has potential to be used actively to assist RT by manipulating the tumour cell environment and by improving the delivery of radiosensitising agents. Finally, US imaging offers various ways to measure dose in 3D. If technical problems can be overcome, these hold potential for wide-dissemination of cost-effective pre-treatment dose verification and in vivo dose monitoring methods. It is concluded that US imaging could eventually contribute to all aspects of the RT workflow.
Export citation and abstract BibTeX RIS

Original content from this work may be used under the terms of the Creative Commons Attribution 3.0 licence. Any further distribution of this work must maintain attribution to the author(s) and the title of the work, journal citation and DOI.
List of abbreviations
| ABC | Active breathing control |
| AP | Anterior–posterior |
| ARFI | Acoustic radiation force impulse (imaging) |
| BTV | Biological target volume |
| CDUS | Colour Doppler ultrasound |
| CEUS | Contrast enhanced ultrasound |
| CPD | Colour pixel density |
| CT | Computed tomography |
| DCE-US | Dynamic contrast enhanced ultrasound |
| DIL | Dominant intra-prostatic lesion |
| DSC | Dice similarity coefficient |
| EM | Electromagnetic |
| FDG-PET | Fluorodeoxyglucose positron emission tomography |
| FOV | Field of view |
| FPS | Frames per second |
| GV | Gas nanovesicle |
| IGRT | Image guided radiotherapy |
| IMRT | Intensity modulated radiotherapy |
| kV | Kilovolt |
| LED | Light emitting diode |
| linac | Linear accelerator |
| LR | Left right |
| MAGIC | Methacrylic and ascorbic acid in gelatine initiated by copper |
| MBF | Mid band fit |
| MIP | Maximum intensity projection |
| MLC | Multi-leaf collimator |
| mMRI | Multi-parameter magnetic resonance imaging |
| MR | Magnetic resonance |
| MRI | Magnetic resonance imaging |
| MV | Megavoltage |
| MVD | Microvessel density |
| NCC | Normalised cross-correlation |
| NIST | National Institute of Standards and Technology |
| OCT | Optical computed tomography |
| PAG | Polyacrylamide gel |
| PDUS | Power doppler ultrasound |
| PET | Positron emission tomography |
| pO2 | Oxygen partial pressure |
| PTV | Planning target volume |
| RF | Radio frequency/radio-frequency |
| ROC | Receiver operating characteristic |
| ROI | Region of interest |
| RPV | Reference planning volume |
| RT | Radiotherapy/radiation therapy |
| RTOG | Radiation therapy oncology group |
| SAD | Sum of absolute differences |
| SBRT | Stereotactic body radiation therapy |
| SE | Strain elastography |
| SD | Standard deviation |
| SI | Spectral intercept/superior inferior |
| SNR | Signal to noise ratio |
| SS | Spectral slope |
| SSD | Sum of squared differences |
| SWE | Shear wave elastography |
| SOS | Speed of sound |
| TE | Transient elastography |
| THPC | Tetrakis (hydroxymethyl) phosphonium chloride |
| TPUS | Transperineal ultrasound |
| UBCs | Ultrasound backscatter characteristics |
| US | Ultrasound |
| USMI | Ultrasonic molecular imaging |
| UIB | Ultrasound integrated backscatter |
| VEGFR-2 | Vascular endothelial growth factor receptor type 2 |
| VMAT | Volumetric modulated arc therapy |
| 1D | One dimensional |
| 2D | Two dimensional |
| 3D | Three dimensional |
| 4D | Four dimensional |
1. Introduction
Within the topic of image guided radiotherapy (IGRT) research there is a growing interest in ultrasound (US) imaging, which offers rapidly developing technology for real-time two-dimensional (2D) and three-dimensional (3D) anatomical and functional inter-fraction and intra-fraction imaging at high frame and volume rates. Earlier review papers have dealt with US-based anatomical localization (Kuban et al 2005) or 3D US technology (Fenster et al 2001). The current review and its companion paper (Fontanarosa et al 2015) are the first to cover extensively the recent progress and growing applications of modern US imaging in radiotherapy (RT). Part I (Fontanarosa et al 2015) focused on the use of US for inter-fraction motion correction. Here, in Part II, we address the potential benefits of further integration of US imaging into the RT workflow, including: intra-fraction motion correction, biological target volume (BTV) identification, prediction and monitoring of tumour response, normal tissue toxicity assessment, therapeutic effect enhancement, and dosimetry. Figure 1 provides a guide to the potential applications of US to specific stages of the RT workflow, and where in this review these topics are discussed. This review does not consider the use of US to detect tumour recurrence post-RT, as this is covered in reviews on the use of US for cancer diagnosis.

Figure 1. The potential applications of US in the radiation treatment chain and the sections of this review where these applications are discussed. The use of US imaging for patient set-up and verification was discussed in Part I of this review (Fontanarosa et al 2015).
Download figure:
Standard image High-resolution image2. US based intra-fraction motion management
2.1. Intra-fraction motion
Intra-fraction translation, rotation or deformation of the target (tumour) during radiation beam delivery has a negative impact on RT which is well understood (Yorke et al 2008). A study by Langen and Jones (2001) reviewed organ motion relevance to RT. Motion statistics, for US-accessible treatment sites are given in table 1. For treatment sites influenced most by respiratory motion, such as the liver, this motion can significantly reduce accuracy of delivery (Von Siebenthal et al 2007). Simulated gating and dynamic multi-leaf collimator (MLC) tracking have been shown to improve dose distributions for prostate (Colvill et al 2014), which can experience significant (non-respiratory based) motion in some treatment fractions (Noel et al 2009, Ng et al 2012).
Table 1. Motion statistics for various organs accessible by US. These motion data were acquired with a variety of imaging modalities including x-ray imaging, magnetic resonance imaging (MRI), 4DCT and US.
| Tissue | Motion statistic | Displacement (mm) or percentage (%) | Observer |
|---|---|---|---|
| Breast (cavity) | Range (3D) | 0.8–3.8 | Glide-Hurst et al (2015) |
| Breast (ipsilateral) | Range (3D) | 0.7–3.0 | Glide-Hurst et al (2015) |
| Liver | Mean (range) | 17.6 (5.6–39.5) | Worm et al (2013) |
| Mean ± S.D. | 24.4 ± 16.4 | Bussels et al (2003) | |
| Mean ± S.D. | 13.0 ± 5.0 | Weiss et al (1972) | |
| Mean | 14 | Harauz and Bronskill (1979) | |
| Mean (range) | 25 (10–40) | Suramo et al (1983) | |
| Mean (range) | 10 (5–17) | Davies et al (1994) | |
| Kidney | Mean (range) | 19 (10–40) | Suramo et al (1983) |
| Mean (range) | 11 (5–16) | Davies et al (1994) | |
| Mean ± S.D. | 16.9 ± 7.9 | Bussels et al (2003) | |
| Mean | <10 | Pham et al (2014) |
|
| Pancreas | Mean (range) | 20 (10–30) | Suramo et al (1983) |
| Mean (range) | 20 (0–35) | Bryan et al (1984) | |
| Mean ± S.D. | 23.7 ± 15.9 | Bussels et al (2003) | |
| Prostate (supine) | Range (AP) | −4.6–6.8 | Huang et al (2002) |
| Mean ± S.D. | 0.6 ± 0.4 | Butler et al (2013) | |
| Margins (LR, AP, IS) |
1.8, 5.8, 7.1 | Litzenberg et al (2006) | |
| Mean time > 3, 5 mm | 14%, 3% | Langen et al (2008) | |
| Time > 3, 5, 7, 10 mm | 5.6%, 2.2%, 0.7%, 0.4% | Ng et al (2012) | |
| Prostate (prone) | Mean ± S.D. | 1.2 ± 0.6 | Butler et al (2013) |
| Cervix | Margins (fundus, os) |
10, 4.5 | Chan et al (2008) |
| Maximum | 10.6 | Kerkhof et al (2009) | |
| Mean ± S.D. (AP) | 2.9 ± 2.7 | Haripotepornkul et al (2011) | |
| Uterus | Mean ± S.D. (AP) | 7.0 ± 9.0 | Taylor and Powell (2008) |
| Bladder | Maximum | 58 | McBain et al (2009b) |
| Volume increase | 101% | McBain et al (2009a) | |
| S.D. | 5 | Meijer et al (2003) | |
| Maximum | 15 | Foroudi et al (2013) | |
| Rectum | Maximum | 30 | Muren et al (2004) |
| Margin (systematic, random) |
6, 16 | Muren et al (2004) |
aReview paper—mean of 15 publications (free breathing). bPlanning target volume (PTV) margin. cInternal target volume margin. dPlanning organ at risk volume (PRV) margin.
The various methods that can measure intra-fraction motion, whilst a patient is treated on a standard C-arm linac, can be divided into techniques that use (1) external surface motion, (2) implanted markers (electromagnetic or metallic), (3) US or (4) x-ray imaging (see figure 2). For an overview of the different IGRT techniques the reader is referred to Jaffray (2012) and De Los Santos et al (2013). Table 2 summarises the key features of current and emerging intra-fraction motion estimation technologies for controlling RT beams by tracking or gating, and the potential advantages and disadvantages of each. Advantages that US holds over other techniques include the combination of high accuracy, high spatial resolution, high temporal resolution, ability to account for tissue deformation by direct monitoring of internal tissue motion, and no ionising radiation dose or invasion. Disadvantages include inaccessibility of US to tissues shielded by air or bone, potential for the US transducer to interfere with the RT dose distribution, and, for some 3D US technologies, restriction on imaging volume rate. These latter two practical issues will be discussed below in section 3.3. The emergence of megavoltage (MV) treatment machines which combine magnetic resonance (MR) image-guidance share many of the advantages of US but their use (like US) has yet to be fully explored (Kirkby et al 2008, Raaijmakers et al 2008).
Table 2. A comparison of (first use) commercial and research intra-fraction motion estimation methods and technologies. Technologies are grouped by method. Cancer sites for which technology accuracy was evaluated are given in column 4. Some potential advantages and disadvantages of each method are listed in columns 7 and 8.
| Method | Motion estimation technology | Publication(s) | Evaluation site | Accuracy | Temporal resolution | Advantages | Disadvantages |
|---|---|---|---|---|---|---|---|
| EM | Varian Calypso® | Balter et al (2005) | Phantom | 0.54 mm | 0.1 s | No dose, high sample rate | Invasive, height restriction, non-compliant with composite materials, not compatible with MRI |
| Kupelian et al (2007) | Prostate | 1.9 mm | |||||
| EM | Micropos RAYPILOT® | Kindblom et al (2009) | Prostate | 1.7 ± 1.0 mm | No dose, High sample rate | Invasive (catheter insertion) | |
| Ravkilde et al (2011) | Lung | 0.98 mm | |||||
| Near-IR | VisionRT GateRT® | Hughes et al (2009) | Lung (gating) | Good correlation (>0.8) with spirometry | 0.05 s | No dose,high sample rate, non-invasive | Assumes correlation with internal motion |
| IR | Microsoft Kinect™ | Xia and Siochi (2012) Alnowami et al (2012) | Respiratory (surface) | High correlation (>0.96) with strain gauge, <1 mm, | 0.03 s | No dose, low cost | Assumes correlation with internal motion |
| (Research) | Aoki et al (2012) | 1 mm/1° | |||||
| X-ray/IR | Accuray synchrony™ | Hoogeman et al (2009) Ozhasoglu et al (2008) | Lung | <2.5 mm | 0.04−0.025 s (CCD cameras) 60–120 s (x-ray imaging) | High sample rate, no dose | Migration, assumes correlation with internal motion |
| X-ray/IR | Novalis ExacTrac® | Chang et al (2011) Udrescu et al (2013) | Lung (gating) | 1.9 mm | 0.07 s | High sample rate | Radiation dose (less than kV CBCT), invasive (implantation), increased treatment time |
| Ackerly et al (2011) | Intracranial | 1.35 mm | |||||
| X-ray | Accuray fiducial tracking | Fu and Kuduvalli (2008) | Head and Neck phantom | 0.33 ± 0.16 (max: 0.86 mm) at 0 mm from imaging centre | 30–60 s (typical), 5 s (minimum) | High accuracy displacement/rotation tracking | Radiation dose (Prostate: 196 images, 16 mSv), Invasive, Limited sample rate |
| X-ray | KIM (Research) | Ng et al (2012) | Prostate | 0.46 mm | 0.1 to 0.2 s | Image plus 3 segmented fiducials | Radiation dose (61 mSv at 10 Hz), Invasive |
| X-ray | Fluoroscopy | Adamson and Wu (2008, 2010) | Prostate | 0.30–0.68 mm (SD) | 0.03 s | High imaging rate | Radiation dose, Invasive (fiducials) |
| (Research) | Shirato et al (2000) | Lung (gating) | 1.5 mm | ||||
| Kitamura et al (2003) | Liver | ||||||
| Kinoshita et al (2008) | Breast | ||||||
| X-ray | MV/EPID (Research) | Keall et al (2004) | Phantom (respiratory) | 0.1 s | Standard on Linac, high sample rate | Radiation dose, Poor image quality | |
| Ir-192 implant | Navotek RealEye™ motion | Shchory et al (2009) | Prostate (canine) | 1.1 ± 0.4 mm | — | — | Invasive, one point, no rotational information |
| Shchory et al (2010) | 0.89 mm | ||||||
| Schifter et al (2008) | Phantom | 0.3 mm | |||||
| Neustadter et al (2010) | Radiation dose (patient: 64 mSv, spouse: 0.25 mSv, radiographer: 0.34 mSv) | ||||||
| US | Elekta clarity autoscan | Lachaine and Falco (2013) | Prostate phantom | 0.2–0.4 mm (SD) | 2.5 s | 3D soft-tissue information, no dose, non-invasive (no fiducials) | Unfamiliar technology in RT, need for probe position optimisation (for other sites) |
| MR (0.35 T) | Viewray™ | Noel et al (2012) | Bowel | Visually assessed | 0.25 s | No dose, high sample rate, non-invasive | Cobalt-60, low strength magnetic field |
Key: EM, electromagnetic; IR, infrared; US, ultrasound; MR, magnetic resonance.
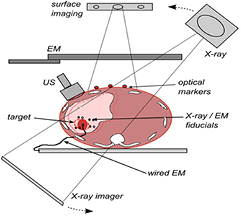
Figure 2. Methods of intra-fraction motion estimation: optical surface imaging, kV x-ray, wired and wireless (induction-based) EM fiducials and US imaging.
Download figure:
Standard image High-resolution image2.2. Implementation of US intra-fraction motion management
Relative to x-ray based techniques, the use of US for intra-fraction motion management is at an early stage (see table 2). The following section is intended to familiarise the reader with the methods used to estimate tissue motion using US.
2.2.1. US motion estimation techniques.
There are two types of US motion estimation techniques: direct and indirect. Direct methods detect echo motion, whether it corresponds to homogeneous speckle or resolved tissue structure, such as anatomical features. Indirect methods estimate the motion of segmented boundaries (see figure 3).

Figure 3. Motion in US image sequences can be estimated by (1) measuring echo motion directly, e.g. echo pattern matching which does not distinguish between homogeneous (speckle) regions and anatomical features (green box) or (2) indirect methods which estimate the motion of segmented boundaries (light blue dotted-line).
Download figure:
Standard image High-resolution imageDirect (echo-based) methods: Motion can be estimated without region or boundary segmentation, using (i) US echo fluctuation or (ii) tracking methods, either of which may use the phase or the magnitude of the US echo signal (Eckersley and Bamber 2004). Fluctuation (e.g. Doppler) methods have not been applied to motion estimation in RT and will not be discussed further. Tracking methods, also known as time-domain methods (Hein and O'brien 1993, Eckersley and Bamber 2004), measure displacement as the shift in location needed to re-establish echo correlation (Eckersley and Bamber 2004) and have been used to estimate tissue and phantom motion in RT.
US images possess a grainy structure called speckle (Burckhardt 1978). Speckle is an image pattern that is unique to a region of tissue, and is created by the interference between echoes from US scatterers that are too close to each other to be separately resolved (Bamber 1993, Chen et al 1995). It provides image structure that accurately follows tissue motion, even when no resolved tissue structure is present, so long as the tissue stays in view without excessive deformation or rotation and no changes occur to the US imaging parameters (e.g. US beam direction, frequency, pulse shape or beam shape). Violation of these conditions results in a speckle pattern that changes, or decorrelates, as it moves. When resolved tissue structure is present, its motion may be followed directly, although similar conditions apply as for speckle tracking. Direct methods tend to be based on the application of similarity measures to estimating the motion of regions of US speckle or localised resolved tissue structure (Harris et al 2010); commonly it is a combination of both (figure 3). We therefore refer to all such methods as echo pattern matching.
Echo pattern matching is illustrated in figure 4 for a sector scan. A region of interest (ROI), containing a unique echo pattern, is defined in an US image (acquisition 1). In a subsequent US image (acquisition 2), a pattern matching algorithm searches for the region that best matches the echo pattern in the ROI, identified using a similarity measure such as the normalised cross correlation coefficient (NCC) (e.g. Bonnefous and Pesque 1986), sum of absolute differences (SAD) (e.g. Bohs et al 1993), or sum of squared differences (SSD) (Langeland et al 2003).
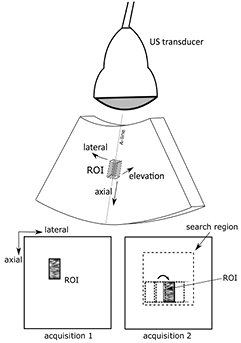
Figure 4. Example of 2D US echo pattern matching. A kernel or reference ROI is selected in an US image (acquisition 1) and the pattern that best matches this is located in a subsequent image (acquisition 2) by computing a similarity metric, such as the normalised cross-correlation coefficient, at many test locations within a larger search region. The top image illustrates a sector scan and the bottom two image acquisitions are assumed to be in polar coordinates, where the direction labelled lateral is measured in terms of the angle at which each A-line is acquired. The method can be extended to 3D if elevational data is available.
Download figure:
Standard image High-resolution imageIndirect (image segmentation-based) methods: Indirect motion estimation methods involve image analysis methods to segment an element of anatomy, e.g. the prostate boundary. Once segmentation has been achieved in each acquisition, a positional measure such as centre-of-mass of the object (or objects) detected may be extracted to provide, over many acquisitions, a time-varying displacement. Such segmentation may, however, not always be possible using US data alone due to a lack of reliable landmarks (Yang and Fei 2012).
Segmentation of a clearly defined object displayed with high echo image contrast (e.g. a fluid filled cavity) can be relatively straightforward (Sarty et al 1998). However, US images of a target such as the prostate are difficult to segment because of relatively low contrast and artefacts such as those due to shadowing, meaning that image processing operators such as edge detectors are inadequate by themselves. More complex methods such as the active contouring (Kass et al 1988) have been developed but require initialisation by user defined curves (Pathak et al 1998). Fully automated 3D segmentation based on atlas registration and texture priors has shown promise when compared with manual segmentation in prostate transrectal US (Yang and Fei 2012). For intra-fraction motion, segmentation would have to be both rapid and fully automated. Fast segmentation has been investigated for image guidance of surgery of the kidney (Ahmad et al 2006) and liver (Angelini et al 2005, Foroughi et al 2006), radio-surgery of the liver (Lee et al 2011) and for ventricular volume estimation in echo-cardiography (Angelini et al 2005, Hansegård et al 2007).
The choice of whether to employ a direct or indirect algorithm (or a combination of both) may depend on the availability and quality of features for reliable segmentation. Direct methods are the most commonly studied and the only ones used to date in a commercial US guided RT system (Lachaine and Falco 2013). A number of interesting direct approaches to motion estimation in long 2D B-mode in vivo US liver sequences were recently presented (De Luca et al 2015).
2.2.2. Factors influencing the accuracy of direct echo-based motion estimation.
When implementing a direct echo-based technique it is important to consider a number of factors which can influence the accuracy of the motion estimation (some of these factors are also relevant to indirect (segmentation-based) approaches). Motion estimation accuracy can be affected by factors specific to the tissue (target) of interest, such as depth, speed and type of motion. Others factors are specific to the imaging, data type and algorithmic parameter choices. A full discussion was considered too detailed for this review and the main points have therefore been summarised in table 3.
Table 3. Factors influencing the accuracy of direct echo pattern matching motion estimation.
| Factor | Effect | Potential solution(s) | |
|---|---|---|---|
| Target specific | Rotation and deformation | Large inter-frame deformations (>5%) and rotations (>2°) limit accuracy of echo pattern matching (Kallel et al 1994, Meunier and Bertrand 1995, Bamber and Bush 1996, Fan et al 1997, Varghese and Ophir 1997, Meunier 1998, Brusseau et al 2000) |
|
| Direction of motion | The axial sampling interval is typically smaller than the lateral and elevational sampling intervals. Motion estimation was found to be most accurate in the axial direction (Harris et al 2007) | ||
| Object depth | For curvilinear transducers, spatial sampling interval increases with depth in the lateral and elevational directions. Motion estimation accuracy was observed to be poorer at greater depths (Harris et al 2007) |
|
|
| Object speed | For mechanically swept transducers, the spatial sampling interval of objects moving retrograde to the sweep direction increases with increasing speed, resulting in a decrease in motion estimation accuracy. Speeds of up to 35 mm s−1 were observed to have no influence on the motion estimation accuracy in lateral direction (Harrington et al 2011, Harris et al 2011) | ||
| Imaging data | Image data type | Radio frequency (RF) data can be used to measure much smaller displacements (tens of micrometres) than B-mode data (Bohs and Trahey 1991, Hein and O'brien 1993, Shi and Varghese 2007, Tavakoli et al 2010, Bamber et al 2013) | |
| The envelope signal contains the echo signal features required to track large displacements (i.e. as in RT tumour motion), and may decorrelate less rapidly than the phase in the corresponding RF data. (Doyley et al 1996, O'Shea et al 2015) | |||
| Noise and artefacts | Direct motion estimation algorithms can suffer from decorrelation (between the reference and current image) when the image quality becomes poor due to e.g. random electronic or thermal noise (Bohs et al 1995, Yeung et al 1998), acoustic noise (Bohs et al 1995) or shadowing |
|
|
| Motion estimation algorithm | Region of interest size | A large ROI contains a more unique echo pattern and will thus track motion with greater accuracy than would a small ROI (Ramamurthy and Trahey 1991, Morsy and von Ramm 1999) | |
| A small ROI, however, provides the best spatial localisation (resolution) of the motion and smallest computational load | |||
| Fixed or incremental motion estimation | A fixed ROI may lose correlation and therefore accuracy for large displacements, the accumulation of small tracking errors (including interpolation bias errors) when incremental tracking is used may result in less reliable tracking (Matthews et al 2004, Harris et al 2010) | ||
| Sub-sample interpolation | Displacement sensitivity is limited by the sampling interval, which in the lateral and elevational (in 3D) directions is equal to the A-line and elevational frame density, respectively |
|
2.3. Application to intra-fraction motion estimation
2.3.1. Studies using US intra-fraction motion estimation.
The first commercially available US based intra-fraction motion monitoring system, the Clarity Autoscan™ (figure 5) integrates a mechanically-swept 3D US transducer into the treatment planning (computed tomography (CT) suite) and delivery (treatment room) process. A 5 MHz transducer is positioned for transperineal prostate imaging. During treatment, 3D US images are acquired at 2.5 s intervals and registered to a reference US volume using a correlation-based search with reference ROIs centred on pixels within 2 cm of the prostate boundary. Phantom studies demonstrate that <1.2 mm accuracy and precision of motion estimation can be achieved using Clarity Autoscan™ (Abramowitz et al 2012, Lachaine and Falco 2013). Intra-fraction motion estimation of the prostate in vivo has yet to be compared to other techniques such as those based on x-ray imaging of fiducial markers (Ng et al 2012).
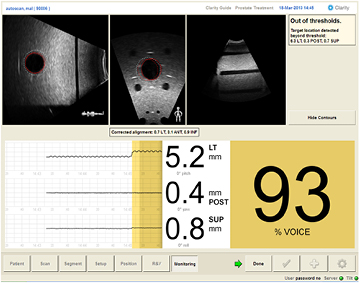
Figure 5. The Clarity Autoscan™ system with the monitoring interface showing a phantom used to simulate intra-fraction motion imaging. The dotted red contour is the reference target (reference planning volume, RPV). The solid red line indicates the current target contour. The dotted white line indicates the location of the VRV (VOICE reference volume). The % VOICE (volume of interest coverage estimate) is the percentage of target volume covered by the VRV contour (93% in this example). Courtesy of Martin Lachaine (Elekta Ltd).
Download figure:
Standard image High-resolution imageOther US intra-fraction motion estimation techniques being researched are listed in tables 4 and 5, many of which have been confined to phantom investigation (table 4). Some have evaluated the accuracy of intra-fraction motion estimation using ROIs containing resolved features (Abramowitz et al 2012, Schwaab et al 2014) and some with ROIs containing US speckle only (Sawada et al 2004, Hsu et al 2005, Harris et al 2007, O'Shea et al 2014).
Table 4. Phantom-based studies of US-based intra-fraction motion estimation in RT. The transducer type, motion estimation method and main findings are included.
| Site | Transducer | Motion estimation method | 3D | Investigation/finding | Publication |
|---|---|---|---|---|---|
| Phantom | Not specified (3D) | Echo pattern matching | Yes | Respiratory gating using 3D US | Sawada et al (2004) |
| Results show synchronisation of phase of echo pattern matching (NCC) and periodic motion of organs such as the liver and pancreas | |||||
| Phantom | 5 MHz, linear array | Echo pattern matching | No | Feasibility of US tracking with linear accelerator (linac) operating | Hsu et al (2005) |
| Minimal effect of transducer of dose distribution | |||||
| Negligible effect of linac on 2D echo pattern matching | |||||
| Phantom | 4–7 MHz, curvilinear | Echo pattern matching | Yes | Dependence of echo pattern matching on depth, spatial samplIng, motion magnitude for known displacements of 1, 2 and 8 mm | Harris et al (2007) |
| Phantom | Not specified | CT to US image registration | No | Novel US-CT fusion system developed and tested | Molloy and Oldham (2008) |
| CT image data superimposed on live US image | |||||
| System found to have sufficient accuracy for assessment of respiratory-induced tissue motion | |||||
| Phantom | 4–7 MHz, curvilinear | Echo pattern matching | Yes | Investigated the effect off object speed and direction on motion estimation accuracy | Harris et al (2011) |
| Motion estimation errors in the elevational direction highlighted the limitations of 3D sweep transducers for respiratory motion | |||||
| Phantom | 5 MHz, microconvex 4D | Echo pattern matching | Yes | 3D motion phantom tracked with Clarity Autoscan system and Calypso and optical system | Abramowitz et al (2012) (abstract only) |
| Calypso & optical: 95% of distance variation <0.6 mm, clarity auto-scan ⩽1.3 mm | |||||
| Phantom | 5 MHz, microconvex 4D | Echo pattern matching | Yes | Accuracy of phantom displacements: 0.2, 0.0, 0.2 mm (AP, RL, SI) | Lachaine and Falco (2013) |
| Phantom | Not specified, biplane | Indirect method (contour) | Quasi | Biplane ultrasound probe used with active contouring to track 1D sinusoidal motion of rubber ball target | Schwaab et al (2014) |
| Prediction used to account for imaging and motion estimation latency | |||||
| Phantom | 7.5 MHz, linear array | Echo pattern matching | Yes | Phantom displaced in 3D using prostate motion data from Calypso | O'Shea et al (2014) |
| Tracked with US and kV x-ray system on CyberKnife | |||||
| Accuracy of 3D-US motion estimation comparable with kV xray for major axes of motion |
Table 5. Application of US to in vivo intra-fraction motion estimation in RT. The site investigated, transducer type, motion estimation method and main findings are included.
| Site | Transducer | Motion estimation method | 3D | Investigation/finding | Publication |
|---|---|---|---|---|---|
| Diaphragm | Not specified | Echo pattern matching | No | Novel respiratory detection method based on diaphragm motion using four volunteers | Xu and Hamilton (2006) |
| Liver | Not specified | Echo pattern matching | No | US-gated liver radiation therapy feasibility study | Jacso et al (2009) |
| Temporal accuracy (lag) comparable with x-ray imaging system | |||||
| Liver | 4–7 MHz, curvilinear | Echo pattern matching | Yes | Estimated motion compared with known sinusoidal motions. Four healthy volunteers | Harris et al (2010) |
| Mean absolute devaition and SD of tracked vessels <1.7 mm | |||||
| Fixed reference tracking gave best results | |||||
| Prostate | 2.5 MHz, abdominal | Echo pattern matching | No | Could detect motion before prostate displaced by 3 mm or rotated by 5 degrees at 95% confidence level | Schlosser et al (2010) |
| Prostate | 1–5 MHz, curved array | Echo pattern matching | No | Telerobotic system for real-time US imaging during radiation therapy | Schlosser et al (2011) |
| Prostate, Liver, Lung | 2.5 MHz, phased array 6.0 MHz, Linear array | Echo pattern matching | No | Motion estimate versus human observer <2.0 mm difference | Rubin et al (2012) |
| Liver | 2.8 MHz, 2D matrix array | Echo pattern matching | Yes | Liver ultrasound (three volunteers) to study scan rates with matrix array 12 Hz volume rate is needed to track respiratory motion with 1 mm RMS error | Lediju Bell et al (2012) |
| Liver | 1.8–2.2 MHZ, not specified | Echo pattern matching | No | Scale adaptive block matching with temporal realignment to reduce accumulation of tracking errors | De Luca et al (2013) |
| Pancreas | 5 MHz convex 4D | Echo pattern matching | No | Elekta Clarity used to track portal vein motion as surrogate for pancreatic motion | Omari et al (2015) |
Tissues investigated: A handful of in vivo studies (table 5) have shown the feasibility of 2D US-based motion tracking of the diaphragm (Xu and Hamilton 2006), liver (Jacso et al 2009, Rubin et al 2012), prostate (Schlosser et al 2010, Schlosser et al 2011) and lung surface (Rubin et al 2012). Liver motion estimation in 3D was demonstrated by Harris et al (2010). The pancreas can be difficult to visualise with an abdominal US transducer. Omari et al (2015) have assessed the feasibility of using portal vein motion, visualised using Elekta Clarity™, as a surrogate for pancreatic motion. US has not been used for intra-fraction motion estimation for lung tumours, probably due to the high attenuation of US in lung and the success of optical monitoring of surface tumours. US monitoring of diaphragm motion could however be combined with surface motion to obtain a better estimate of lung tumour motion. Other abdominal tissues, such as bladder and kidney have yet to be studied clinically. The bladder is easily visualised on US and there is evidence to suggest that significant motion of the bladder wall may occur during therapy (McBain et al 2009a). Similarly, the kidneys are easily accessible by US and US-based motion estimation of the kidney may have application to SBRT of adrenal gland metastases (Chawla et al 2009) or in paediatric RT of the upper abdomen (Panandiker et al 2012). It is unlikely that US-based methods for estimating breast tissue motion hold great advantage over surface techniques.
Of the US intra-fraction motion estimation studies that employed in vivo data, comparison with the true motion (and therefore motion estimation accuracy) has either not been fully considered or has been based on manual annotations of features in B-mode images (e.g. De Luca et al 2013). There remains a need for full in vivo investigation of the accuracy and limitations of US-based methods, and therefore a need for improved methods for measuring the true motion. Comparison with other technologies such as kilo-voltage (x-ray) intra-fraction monitoring, which has shown acquisition rates (5–10 Hz) comparable with US and systematic accuracy of <0.5 mm (Ng et al 2012), or with electromagnetic intra-fraction monitoring devices, e.g. Calypso (Willoughby et al 2006) (temporal resolution of 10 Hz, accuracy <0.5 mm), with appropriate EM shielding, may be astute.
2.3.2. Transducer type and imaging dimensions.
While intra-fraction motion is inherently 3D, tissues generally exhibit greater motion in the superior-inferior and anterior–posterior motion directions. Left or right motion is often significantly smaller, making it less clinically relevant to RT. This supports the possible use of 2D images, as does low cost real-time imaging and the currently available high frame rate imaging. For example, 2D imaging could be performed with an appropriate left–right (RL) PTV margin to cover the expected magnitude of motion in the RL direction. This does, however, require the transducer to be aligned with the plane of dominant motion, and the development of methods for doing this rapidly and automatically. Direct comparisons of high frame-rate 2D US and slower volume rate 3D US for motion estimation of tissues have yet to be made. As an alternative to direct 3D US motion estimation, Preiswerk et al (2014) have combined 2D motion estimation and MRI-derived population-based motion models to estimate 3D displacement at high rates. The following considers the choice of transducer type, which may be 2D, 3D or biplanar.
2D transducers: A number of studies have investigated the use of 2D transducers for motion tracking in RT (e.g. Schlosser et al 2010, Schlosser et al 2011, Rubin et al 2012, see tables 4 and 5). Compared with 3D US, 2D monitoring decreases the (inter-image) computational load and, with smaller inter-frame displacement (due to higher frame rate), allows a smaller search window, further decreasing computation time. The high frame rate also helps to improve motion estimation by reducing inter-frame decorrelation in direct echo-based methods. At sufficiently high imaging rates (inter-frame elevation displacement <1 mm), and with a pre-calibration curve to convert decorrelation to distance (Bamber and Bush 1996, Chen et al 1997, Bush et al 2005, Housden et al 2007, Chen et al 2010), decorrelation can estimate out-of-plane motion enabling fast 3D motion estimation with a 2D transducer, albeit with potential elevation direction ambiguity. This method was adopted by Schlosser et al (2010), whereby a drop in the peak NCC value was used to indicate out-of-plane motion and rotation of the prostate during RT.
Biplanar transducers: Biplane imaging offers a high frame rate alternative to full 3D imaging whereby orthogonal imaging planes intersect. (e.g. Hossack et al 2001). Schwaab et al (2014) have investigated its use for RT intra-fraction motion compensation.
3D transducers: The advantages of direct motion estimation with 3D imaging over 2D, if the volume rate is high enough to avoid decorrelation due to rotation and deformation, are (i) the elimination of decorrelation (and consequent loss of tracking accuracy) due to out-of-plane motion, (ii) the unambiguous measurement of all 3 components of the displacement vector, (iii) the possibility to estimate rotations about three axes of rotation and deformation (e.g. Meunier 1998, Saito et al 2009) and (iv) a higher motion estimation precision due to the more unique speckle pattern (Morsy and von Ramm 1998). Unfortunately, mechanically swept 3D US transducers have low volume rate which limits their value for tracking relatively high velocity respiratory-induced motion (Harris et al 2011). Fully real-time (>20 Hz) 3D US imaging (Gunarathne 2013) is still at an early stage of development. Future methods may be based on 2D matrix array transducers, where the 3D volume rate is not limited by mechanically sweeping hardware (e.g. Harris et al 2011, Lachaine and Falco 2013, O'Shea et al 2014) and may reach several thousand Hertz (Byram et al 2010) with improved spatial resolution compared to that provided by equivalent 1D arrays. Bell et al (2012) used a 2D matrix array (operating at 48 Hz) for 3D liver motion estimation in RT, showing that volume rates of 12 Hz are need to accurately estimate cardiac and respiratory-induced liver motion.
2.3.3. Transducer placement.
Intra-fraction estimation requires the US transducer to remain in contact with the patient throughout treatment. This presents a challenge: finding the transducer placement which allows adequate imaging quality without impacting negatively on the RT workflow.
Dosimetric impact: To date, the potential for a transducer positioned for minimum impact on the dose distribution to degrade target motion tracking has been studied only for skin contact scanning, where changes in the dose delivered to the target may be due to (i) RT beam attenuation when irradiating through the transducer (Bazalova-Carter et al 2015) and radiation scattering by the transducer when it is positioned at the radiation field edge, and (ii) modification of the RT beam angles to avoid the transducer (Wu et al 2006, Zhong et al 2013).
Using a RANDO® phantom and thermoluminescent detectors Hsu et al (2005) found that a transducer positioned for transabdominal prostate imaging resulted in only a 2.6% change (predominantly in surface dose) to the dose over the volume of the phantom from a single 10MV 10 × 10 cm2 photon beam. Transperineal imaging of the prostate (with the transducer in a stationary holder e.g. Clarity Autoscan) has yet to be studied in this way, but for coplanar treatments should have limited impact along the radiation beam directions. Zhong et al (2013) used planning simulations and a virtual transducer to show that, with the exception of superficial targets, liver stereotactic body RT is feasible with the transducer parallel to the patient axis.
Irradiation through the US transducer, which strongly attenuates the RT beam, is not recommended (Bazalova-Carter et al 2015). To avoid this with a suitable margin, e.g. in VMAT treatment, a simple planning structure could be defined and a strict dose constraint applied to the block during trajectory optimization (similar to metal hip avoidance (Prabhakar et al 2013). For transabdominal prostate imaging, the dose-volume histogram (DVH) for a plan that avoided the transducer was in good agreement with the DVH of a clinically deployed plan (Schlosser et al 2010). The smaller the transducer, the less likely it will interfere with the treatment. As 3D and biplanar transducers are larger than 2D transducers this may be another reason to consider the latter. An alternative approach which uses a radiolucent mechanical scanning assembly containing a single element US transducer eliminates the majority of dense materials typically present in an electronically scanned US transducer array (Schlosser and Solek 2015).
Whilst wireless transducers (e.g. Siemens Acuson FreestyleTM) hold potential for easier implementation, i.e. no US scanner next to the treatment couch, it is unlikely they will decrease the impact on the treatment plan. For certain treatment sites internal transducers (e.g. endorectal or endovaginal) would give the best spatial resolution and target tracking accuracy, due to short transducer to target distance. The dosimetric consequences of such transducer placement, and opportunities to include them in the planning process, need to be studied.
Robotic transducer positioning: Schlosser et al (2010) developed a telerobotic system to control the transducer position. The system was able to maintain the acquisition of high quality images over time periods relevant to treatment delivery in volunteers. It was also able maintain high quality transabdominal imaging during radiation delivery, robot performance and US target motion estimation of a phantom while a 15 MV beam was delivered.
In another robotic system (Sen et al 2015) the operator and robot share control of the US transducer, which helps to create a consistent body deformation from the force needed to make good contact between the transducer and the body. The system tracks the robot position and contact force used by the operator to obtain a reference US image during simulation, and uses virtual constraints to guide the operator to correctly place the transducer at treatment time. Studies of transducer placement are in progress for various abdominal sites, for both setup (inter-fraction) and delivery (intra-fraction motion) (e.g. Bell et al 2014).
2.5. Future developments
A number of developments and areas of research have the potential to make US a reliable option for intra-fraction tumour motion estimation:
- (1)Provision of real-time motion estimates: Real-time in vivo US echo motion estimation was demonstrated for tissue strain imaging many years ago (e.g. Shiina et al 1996, Pesavento et al 2000, Hall et al 2003). Integration of real-time US and RT accelerator beam control systems via gating or tracking interfaces are in early stages of development (Schlosser et al 2010, Schwaab et al 2014, Gong et al 2015).
- (2)Automatic selection of tracking parameters and regularisation: Pre-treatment imaging could train the motion estimator, which could also adapt to the target appearance (De Luca et al 2013). Substantial scope exists for improving echo pattern matching accuracy by further development of regularisation methods and their associated DQMs, particularly in 4D (Harris et al 2007, Bell et al 2012, O'Shea et al 2015), and by extending the methods to measure and account for rotation and deformation, for which optical flow (Duan et al 2009) could be studied as an alternative to similarity-based template matching. Other methods have used cost functions incorporating similarity of echo amplitudes and displacement continuity to regularise displacement estimation (Rivaz et al 2008, Jiang and Hall 2009). A novel 3D prostate US segmentation algorithm using patch-based anatomical features and support vector machines has recently been presented and has potential for extension to intra-fraction motion estimation (Yang et al 2015).
- (3)Clinical validation: The need for in vivo validation was discussed above. The effect of transducer placement on the trade-off between motion estimation (dependent on image quality) and impact on the dose distribution should be fully explored using conventional and novel transducer designs.
- (4)Application to other treatment sites: While currently only applied to intra-fraction motion estimation of the prostate, US could be highly beneficial for other abdominal sites such as the pancreas, kidney, uterus and cervix (table 1). A combination of inter- and intra-fraction motion estimation using US could compensate for bladder and rectal motion, and enable reduced PTV margins in the lower pelvic region. Stereotactic body radiation therapy (SBRT) with compensation for respiratory motion is becoming a standard for treatment of primary and metastatic liver tumours (Schefter et al 2005, Mancosu et al 2012). Likewise, the kidney, which limits RT dose to abdominal sites such as adrenal tumours (Dawson et al 2010, Scorsetti et al 2011), can undergo relatively large respiration induced intra-fraction displacement (Langen and Jones 2001). The non-ionising nature of US guidance might be particularly beneficial to paediatric patients (Panandiker et al 2013) by reducing secondary cancer risks.
3. US techniques for target definition, monitoring tumour response and assessing normal tissue toxicity
The tumour visualised using anatomical imaging may not always represent the desired biological target volume (BTV) (Ling et al 2000), the definition of which requires additional knowledge about the cells, such as their state of proliferation and oxygenation (Nestle et al 2009). For example, regions of hypoxia, associated with radio-resistance (Zahra et al 2007) have been shown to influence response to RT (Vergis et al 2008). The tumour microvasculature, therefore, plays an important role in RT (Kim et al 2006). Research is underway to develop and employ functional and molecular imaging to define the BTV and measure its changes during treatment. Such techniques have been reviewed (Nestle et al 2009, Bussink et al 2011) and have potential for integration into the RT workflow (Munley et al 2013) for monitoring tumour response (Brindle 2008, Horsman et al 2012) or normal tissue (toxic) reactions (Jeraj et al 2010) to RT. MR is increasingly used for these purposes (Postema et al 2015b) for example, in the delineation of the dominant intraprostatic lesion prior to prostate boost RT (Riches et al 2014). The introduction of US into the RT suite brings potential to use US functional and molecular imaging for these purposes. Not only is US easily affordable, it could provide images at many time points during RT. Currently functional MR, CT and PET imaging requires the patient to be removed from the RT couch to an imaging suite, which loses the real-time capability, adds significantly to treatment time, which may not be tolerated by a large fraction of patients, and degrades geometrical registration between imaging and treatment.
3.1. US imaging and measurement of tissue characteristics
Here we briefly review selected US imaging techniques which have potential for improving BTV definition, monitoring tumour response to RT and quantifying normal tissue toxicity. Table 6 gives a list of the US characteristics that may be measured using these techniques.
Table 6. Selected US tissue properties and their RT applications (The table omits many US tissue properties; only those used in RT research have been listed).
| Measured characteristics discussed in this review (alternative names) | Description | Units | Applications discussed in this review | Publications |
|---|---|---|---|---|
| Ultrasound backscatter characterization: | ||||
| Relative US backscatter amplitude (echogenicity) | Mean echo amplitude | dB | Imaging apoptosis (PC) | Czarnota et al (1999) |
| Assessment of RT toxicity (C) | Ying et al (2007) | |||
| Skewness | Pixel histogram skewness | Prostate cancer imaging | Houston et al (1995) | |
| Kurtosis | Pixel histogram kurtosis | Prostate cancer imaging | Houston et al (1995) | |
| Relative peak intensity value | Peak value of echo amplitude histogram | dB | Assessment of RT toxicity (C) | Yang et al (2012) |
| Lateral autocorrelation | Mean correlation between pairs of adjacent A-lines | Assessment of RT toxicity (C) | Lui et al (2010) | |
| Mid band fit (MBF) (ultrasound integrated backscatter (UIB)) | See figure 6 | dB | Tumour response to RT (C) | Vlad et al (2009) |
| Assessment of RT toxicity (C) | Zhou et al (2009) | |||
| Imaging apoptosis (PC) | Czarnota et al (1999) | |||
| Spectral slope (SS) | See figure 6 | dB MHz−1 | Assessment of RT toxicity (C) | Vlad et al (2009) |
| Spectral intercept (SI) | See figure 6 | dB | Assessment of RT toxicity (C) | Vlad et al (2009) |
| Colour and power Doppler ultrasound: | ||||
| Colour or power area | Total area of coloured pixels | m−1 | Measurement of tumour vascularity (PC) | Donnelly et al (2001) |
| Kim et al (2006) | ||||
| Colour pixel density (CPD) (power and colour) | Area of colour pixels/total ROI area | Measurement of tumour vascularity (PC) | Niizawa et al (2005), Kim et al (2006) | |
| Measurement of tumour vascularity (C) | Hwang et al (2010) | |||
| Measurement of tumour hypoxia (PC) | ||||
| Vascularity Index (VI) | Integrated power in ROI / total ROI area | dBm−2 | Measurement of tumour vascularity (PC) | Huang et al (2013) |
| Assessment of RT toxicity (C) | ||||
| Mean Power (or velocity) | Total power (or velocity) in ROI/Area of colour pixels (power is related to blood volume) | dB m−2 (m−1 s−1) | Measurement of tumour vascularity (PC) | Fleischer et al (1999) |
| Spectral Doppler ultrasound: | ||||
| Peak systolic velocity (PSV) |
Maximum blood velocity in the systole phase | m s−1 | Assessment of RT toxicity (C) | Bakhshandeh et al (2012) |
| End diastolic velocity (EDV) |
Blood velocity at end of the diastolic phase | m s−1 | Measurement of tumour vascularity (C) | Ahuja et al (1999) |
| Resistance index (RI) | (PSV − EDV)/mean velocity | Measurement of tumour vascularity (C) | Ahuja et al (1999) | |
| Assessment of RT toxicity (C) | ||||
| Pulsatility index | (PSV − EDV)/EDV | Measurement of tumour vascularity (C) | Huang et al (1996), Ahuja et al (1999) | |
| Assessment of RT toxicity (C) | Bakhshandeh et al (2012) | |||
| Dynamic contrast enhanced (DCE) ultrasound: | ||||
| Area under the curve (AUC) | Area under the time intensity curve (TIC) related to total vascular volume of the ROI | dBs | Measurement of tumour hypoxia (C) | Scholbach et al (2005) |
| Peak intensity (Ip) | Maximum intensity in the wash in curve | dB | Measurement of tumour vascularity (PC) | Hwang et al (2010) |
| Measurement of tumour vascularity (C) | Krix et al (2005) | |||
| Time to peak (tp) | Time from zero intensity (before contrast arrives) to peak intensity | s | Measurement of tumour vascularity (PC) | Elie et al (2007) |
| Mean transit time (MTT) | Mean time taken by the contrast to pass through the ROI | s | Measurement of tumour vascularity (PC) | Elie et al (2007) |
| Elastography: | ||||
| Strain | Axial strain, a measure of tissue deformation showing contrast for relative shear modulus and other biomechanical properties | % | RT target localization (C) | Rivaz et al (2009) |
| Assessment of RT toxicity (C) | Adriaenssens et al (2012) | |||
| Shear wave speed | Speed of shear waves (may be converted to elastic shear modulus) | m s−1 (kPa) | Tumour response to chemo-RT (C) | Rafaelsen et al (2013) |
| Assessment of RT toxicity (C) | Badea et al (2013) | |||
aReferences provide examples where these characteristics have been applied directly to RT. If no RT related work exists, the references given are discussed in this review. bVelocity cannot be measured in distributed tumour vasculature due to lack of knowledge of the Doppler angle, but it may provide useful measures of blood flow. See text for further discussion. Key: PC—Preclinical study. C—Clinical study.
3.1.1. US backscatter characterisation of tissue.
US backscatter characteristics (UBCs), as with other forms of ultrasonic tissue characterisation (TC) (Lerski et al 1981, Linzer and Norton 1982, Waag 1984, Greenleaf 1986, Insana et al 1988, Shung and Thieme 1992), are related to properties of US scatterers, e.g. scatterer size, density, spatial organization and relative acoustic impedance (Lizzi et al 2003). They may be used to detect morphological changes in tissue at the cellular level, and to identify disease (Feleppa et al 2004) for target volume delineation and tissue damage, such as cell death caused by RT (Lee et al 2012), for monitoring treatment response. UBCs can be derived using:
- (1)
- (2)
- (3)spectral analysis of RF echoes (backscatter spectroscopy). Features of averaged spectra may be derived from a regression analysis of the normalized Fourier transform of the RF echo signal, and include the mid-band fit (MBF), US integrated backscatter (UIB), spectral slope (SS) and spectral intercept (SI) (O'Donnell and Miller 1981, Lizzi et al 1983, Feleppa et al 1986), as shown in figure 6.
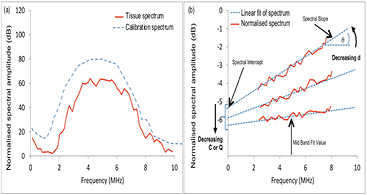
Figure 6. US backscatter characterisation by spectral analysis of the RF echo signal (Lizzi et al 1983). (a) Hypothetical attenuation-corrected tissue spectrum and calibration spectrum. A normalised amplitude spectrum (b) is obtained by dividing the tissue spectrum by the calibration spectrum. The dashed line shows a logarithmic fit, the slope and zero frequency intercept of which are the SS and SI, respectively. The MBF is the value of the logarithmic regression line at the center frequency, fc, of the spectral band. Another feature used is the area under the curve in (b), or UIB. Decreasing scatterer size, d, results in an increase in SS, and (depending on the ratio of scatterer size to wavelength within the spectral band) a decrease in SI, MBF and UIB. Decreasing scatterer density C, or the fractional difference between the scatterers' acoustic impedance and that of the background Q, results in a decrease in SI, MBF and UIB.
Download figure:
Standard image High-resolution image3.1.2. Doppler and contrast enhanced US.
Colour Doppler US (CDUS) imaging, power Doppler US (PDUS) imaging and spectral Doppler US measurement (reviewed by, for example, Evans et al 2000, Eckersley and Bamber 2004) are not truly quantitative techniques, being limited by factors such as Doppler signal angle and depth dependence (Bamber et al 2013). Nevertheless, a large body of work has demonstrated the value of relative characteristics such as those listed in table 5 as non-invasive measures of tumour blood flow and vascularisation (Minasian and Bamber 1982, Wells et al 1997).
Changes in the microvasculature at the capillary level (<100 μm) may occur early in response to treatment (Brown 2002). Intravenously injected gas-filled microbubbles (e.g. Goldberg et al 2001, Stride 2008) of ~1–8 μm diameter can be detected with excellent background tissue echo suppression by using nonlinear microbubble-specific US imaging modes, such as pulse-pulse phase and/or amplitude modulation (e.g. Stride and Saffari 2003, Qin et al 2009). In combination with temporal maximum intensity projection (MIP) imaging, such methods produce US 'angiograms' of tumour vasculature (figure 7) and microvasculature (Shelton et al 2015).

Figure 7. An example temporal maximum intensity projection (MIP) contrast image (b) shows a slice through the vascular architecture of a large liver metastasis. DCE-US is illustrated in (a), where the bolus time-intensity curves are from two example locations, a region of diffuse vasculature (upper) and a large vessel (lower, showing greater respiratory motion artefact), as indicated by the green arrows. DCE-US time-intensity curves for three destruction-replenishment sequences within a bolus contrast period from the diffuse vascular location are provided in (c). Definitions of DCE-US characteristics shown in table 6, and methods for measuring them from time-intensity curves, may be found in Dietrich et al (2012). The distance from the transducer to the maximum depth in the MIP image is 15 cm. (Image and graphs shown with thanks to N Tunariu and J Fromageau for assistance with data acquisition.)
Download figure:
Standard image High-resolution imageTumour perfusion characteristics can be measured by analysing the kinematics of microbubbles in vessels as small as ~40 μm, using dynamic contrast-enhanced US (DCE-US) (e.g. Piscaglia et al 2012, Saini and Hoyt 2014). Clinical microvascular flow imaging with Doppler is becoming possible without a contrast agent. For example, 'Superb microvascular imaging' (SMI), offered by Toshiba on the Aplio500, is said to use advanced clutter reduction to enhance Doppler SNR. Using ultrafast frame rates (tens of kHz) Tanter and Fink (2014) employed massive averaging to enhance Doppler SNR, which has been used, for example, to visualise microvascular 'activity waves' propagating within the brain (Osmanski et al 2014). Ultrafast imaging also provides more time for US beam steering, to estimate the 2D (and eventually 3D) blood velocity vector, allowing complex flow patterns to be imaged (Hansen et al 2009), a technique with potential for more accurate characterisation of tortuous tumour vasculature. A new method of analysing DCE-US data, to assess spatial dispersion of time-intensity curves, has potential to improve prostate cancer detection (Schalk et al 2015), which may eventually be applicable to improving target delineation in RT. Finally, at appropriate microbubble concentrations, signals can be localised from spatially isolated microbubbles, which facilitates the potential for super-resolution (<10 μm) microvascular imaging (Desailly et al 2013, Viessmann et al 2013, Christensen-Jeffries et al 2014).
3.1.3. US molecular imaging (USMI) using contrast agents.
Microbubbles conjugated to targeting molecules such as peptides or antibodies allow USMI (e.g. Wen et al 2014) of circulating molecules or those associated with endothelium such as vascular endothelial growth factor receptor type 2 (VEGFR-2) (Korpanty et al 2007, Rychak et al 2007) and αv-integrins (Kiessling et al 2012). Liquid phase-change nanodroplets may allow extravascular molecular targeting but they are at an early stage of development (Wilson et al 2013). Another future option may be protein-shelled gas nanovesicles (GVs) extracted from microorganisms such as bacteria which produce GVs to control their buoyancy. These GVs provide stable US contrast, detectable in vivo with various useful properties as molecular reporters (Shapiro et al 2014). Most USMI work at present is pre-clinical, e.g. for assessment of tumour angiogenisis and response to anti-angiogenic therapies, although initial clinical studies are now underway in prostate (NIH 2015a, NIH 2015b, Kaneko and Willmann 2012).
3.1.4. US Elastography.
US elastography aims to display contrast for, or quantities related to, the shear elastic moduli of tissue (Bamber et al 2013). The available techniques (e.g. Parker et al 2011, Bamber et al 2013, Doyley and Parker 2014, Shiina et al 2015) use methods described in section 2.2.1, such as similarity search or Doppler, to measure the temporal and spatial dependence of tissue displacement associated with the shear deformation of tissue, which can be used to infer, or quantify, tissue elasticity. Qualitative measures of elasticity strain and displacement are provided by strain elastography (SE) and acoustic radiation force impulse (ARFI) imaging, respectively. Methods giving quantitative elasticity measures (e.g. shear-wave speed, cs, related to Young's Modulus, E, by E =  , where ρ is the mass density) include transient, vibrational and shear-wave elastography (TE, VE and SWE, respectively). For a detailed explanation of these techniques please refer to (Bamber et al 2013, and Shiina et al 2015).
For RT, elastography may improve the ability to visualise disease for target delineation (see section 3.2). Furthermore, as elastography is sensitive to tumour cell necrosis (Li et al 2014), oedema (Berry et al 2008) and fibrosis (Bush et al 2005), and as tissue elasticity is affected by RT (Yarnold and Brotons 2010), it is plausible that elastography may be used to monitor tumour response and normal tissue toxicity. Finally, as tissue viscoelasticity has been shown to be associated with both fibrosis (Cosgrove et al 2013, Ferraioli et al 2015) and microvessel density (Jugé et al 2012, Jamin et al 2015), and fibrosis is linked with induction of angiogenesis via hypoxia inducible factors (HIF) (Ruthenborg et al 2014), it is conceivable that elastography may help define the BTV. This hypothesis has yet to be tested.
3.1.5. Photoacoustography.
Photoacoustic imaging (PAI) (Wang 2009) uses pulsed light to induce a transient (<10 ns) temperature and pressure rise wherever the light is absorbed, typically in haemoglobin, melanin and, to some extent, fat. This generates acoustic emissions detectable by an US transducer, providing real-time imaging of the optical absorption properties of tissue. Although imaging depths of up to 7 cm have been reported (Zackrisson et al 2014), the reliability of the image detail at such depths depends on whether image clutter is generated by strong photoacoustic sources outside the imaged region, and methods of distinguishing clutter from reliable detail are under development (Jaeger et al 2012, Jaeger et al 2013, Alles et al 2014). In different forms, PAI spectroscopy (Wang 2009), allows (a) molecular identification of endogenous chromophores or exogenous contrast in the form of dyes or nanoparticles which may be molecularly directed to extravascular targets (Wilson et al 2013, Zackrisson et al 2014); or (b) a PAI analogue of US backscatter spectroscopy (section 3.1.1) which permits absorber (e.g. microvessel) size, spacing and spatial organisation to be measured (Gertsch et al 2010, Preisser et al 2013, Xu et al 2014, Li et al 2015). Most PAI studies have been preclinical or have used tomographic systems (e.g. for imaging the breast), although translation to the clinic using hand held US transducers is underway (e.g. Wang et al 2011, Jaeger et al 2012, Alles et al 2013, Montilla et al 2013).
3.2. Improving target localisation for RT planning
It is clear that elastography can substantially increase US detection of prostate cancer (e.g. Teng et al 2012, Boehm et al 2015, Correas et al 2015, Hwang and Lee 2014, van Hove et al 2014), and the potential was highlighted in sections 3.1.2 and 3.1.3 in this respect, for DCE-US and molecular targeted microbubbles. Two groups have considered using US for improved dominant intra-prostatic lesion (DIL) detection for guiding external beam RT: Walz et al (2011) and Zhang et al (2007). Walz et al (2011) reported sensitivity and specificity of SE to be low at 59% and 43%, respectively. In the context of DIL detection for prostate biopsy guidance, higher values have been reported for B-mode, Doppler and DCE-US (reviewed by Postema et al 2015b). Zhang et al (2007) performed a theoretical risk-benefit analysis of 3D image guided dose painting using imaging transrectal B-mode US and UBC.
There is a need for side-by-side comparisons of the different US techniques, to determine which performs best, or whether an integrated approach would be worthwhile, as has been suggested for prostate biopsy guidance (Brock et al 2013, Postema et al 2015a, 2015b). Multi-parameter MRI (mMRI) is widely considered a gold standard for intra-prostatic lesion detection (Khoo and Joon 2014). Comparison of US techniques, or a multi-parameter US approach, with multi-parametric MRI, in the prostate biopsy setting may provide strong evidence for the application of US methods to prostate tumour delineation.
Poor CT soft tissue contrast limits the accuracy of tumour bed delineation for patients receiving breast boost RT post-surgery (Coles et al 2007). In a proportion of patients, a pocket of fluid, or seroma, is present, which may be accompanied by surgery related scar tissues (Mukesh et al 2012). Seroma can be visualised using B-mode US, as discussed in Fontanarosa et al (2015), but other tissues, such as scar tissue surrounding the tumour bed, are not easily differentiated from fibroglandular tissue. Rivaz et al (2009) showed using SE that elastographic contrast between seroma (fluid) and fibroglandular tissue was significantly greater than radiographic contrast obtained using CT. Juneja et al (2014) compared SE and SWE for TB delineation in US breast phantoms, finding SE gave a more accurate representation of inclusions.
3.3. Tumour response to treatment
3.3.1. Measurement of cell death.
US backscatter spectroscopy (section 3.1.1(3)) has been investigated at high frequencies (>20 MHz) for monitoring radiation-induced apoptosis in vitro and in small animal models (Czarnota et al 1999, Vlad et al 2009), with validation against histopathology (Czarnota et al 2007). Its clinical feasibility to monitor response of deep-seated tumours has yet to be proven, although reason to be optimistic is provided by the ability of the method at low frequencies to characterise microscopic structure in phantoms (e.g. Insana et al 1990) and, for example, to identify glomeruli as one of the dominant scattering structures in the renal cortex (Insana et al 1991).
3.3.2. Measurement of tumour vascularity.
PDUS and DCE-US have been investigated pre-clinically to quantify tumour response to RT, although some groups found high positive correlation of Doppler characteristics with histologically assessed microvessel density pre- and post-RT (Donnelly et al 2001, Kim et al 2006), whereas others did not (Fleischer et al 1999, Denis et al 2002, Hwang et al 2010). Hwang et al (2010) and Krix et al (2003), however, did report a strong correlation of DCE-US Ip with MVD. Finally, the PDUS vascularity index has been noted to decrease in tumours treated with US and microbubbles (see section 3.3.3), alone or with radiation (Czarnota et al 2012, Tran et al 2012).
Clinically, a significant reduction in pulsatility and resistance indices of the intranodal vessels of metastatic lymph nodes (see table 5) 8 weeks post-RT was demonstrated (Ahuja et al 1999). Pirhonen et al (1995) found RT caused a significant decrease in cervical tumour vascularity during treatment, which was associated with disease free survival. Huang et al (2013) demonstrated a 50% reduction in 3D PDUS vascularity index, 5 weeks from start of RT, dropping to 100% reduction at 3 months, in women receiving RT or concurrent chemoradiotherapy for cervical carcinoma. Krix et al (2005) observed a decrease (~20%, larger than measured using contrast-enhanced CT) in tumour arterial phase DCE-US Ip 2 months after single fraction stereotactic body RT to liver metastases. Following proton therapy of hepatocellular carcinoma, contrast enhanced CDUS tumour CPD initially increased in 50% of patients and then, 9 months post-RT, decreased across all patients (Niizawa et al (2005).
Further work and greater standardisation of techniques are required to understand how Doppler US and DCE-US characteristics relate to tumour vasculature and perfusion. An inherent difficulty in histological evaluation of tumour response both clinically and pre-clinically is establishing accurate spatial registration between histological sections, dose distribution and the US imaging plane. Three-dimensional US, provides more accurate image registration compared to 2D (Hwang et al 2010, Huang et al 2013). Pre-clinically, integration of functional 3DUS into small animal dedicated irradiation devices may bring about increased accuracy in correlative studies of this kind (Verhaegen et al 2011).
3.3.3. Manipulation of tumour vasculature.
Although US has long been studied as a technique for inducing hyperthermia (Hand and Haar 1981), and hyperthermia and RT are known to act synergistically (e.g. Miller et al 1977, Holt 1980), the potential for synergism between therapeutic US methods for example high intensity focused ultrasound (HIFU) (Baker et al 2001, Tachibana 2004, Koonce et al 2015, Wood and Sehgal 2015) and RT has only just begun to be investigated, and only in a preclinical context. The induction of endothelial cell apoptosis by exposure to US in the presence of microbubbles is proposed as a possible mechanism for observed radioenhancement (Al-Mahrouki et al 2012), and a ten-fold increase in tumour cell-kill was observed using a combined treatment relative to microbubbles or radiation alone (Czarnota et al 2012, Tran et al 2012). Furthermore, US contrast-mediated vascular permeation and drug delivery (Rapoport et al 2007) holds potential for the localised delivery of radiosensitisers such as Paclitaxel (Liebmann et al 1994) or epidermal growth factor receptor inhibitors (Sartor 2004).
3.3.4. Measurements of tumour oxygenation.
Tumour hypoxia has been shown to be associated with a decrease in vascularity (West et al 2001) motivating research into Doppler and DCE-US characteristics as markers of hypoxia, validated against measures of oxygen partial pressure (pO2) using polarography. Clinically, Scholbach et al (2005) and Gagel et al (2007) reported moderate correlation with a tissue perfusion index (see table 6) and polarographic measurements in metastatic lymph nodes, respectively. Pre-clinically, weak (Ohlerth et al 2010) or no correlation (Elie et al 2007) with Doppler US characteristics was found. Poor results may have been a manifestation of problems with various factors in these types of experiment, viz., reliability of polarography in vivo and spatial sampling error of both polarography and US.
Using photoacoustography, Sun et al (2012), measured increases in tumour volume, and decreases in blood concentration and oxygen saturation, in tumour models irradiated with 30 Gy, comparing measurements taken before and 10 d post-irradiation. Similar findings, in response to US and microbubble enhanced RT, are reported by Briggs et al (2014).
3.3.5. Measurements of tumour stiffness.
Limited clinical evidence to support the use of elastography to measure response to RT exists. Mabuchi et al (2015) using real-time SE, found that in patients with complete response, tumour stiffness decreased to levels similar to normal cervix. Rafaelsen et al (2013) detected a significant decrease in shear wave speed in rectal tumours and mesorectal fat, between baseline measurements prior to the start of chemoradiation therapy (3.13 ms−1) and two (2.17 ms−1) and six (2.11 ms−1) weeks after treatment began. A softening of metastatic cervical lymph nodes post-chemoradiation therapy was demonstrated using SE (Furukawa and Furukawa 2010).
3.3.6. Measurements of molecular biomarkers for RT response.
The potential for USMI to measure response to RT has been demonstrated pre-clinically: microbubbles targeted to ICAM-1 (a marker of inflammation) and αvβ3-integrin (a marker of angiogenesis) allowed 30 MHz US to image early vascular response of xenograft prostate tumours irradiated with carbon ions, suggesting an increased expression of ICAM-1 and αvβ3-integrin in response to RT (Palmowski et al 2009). Gold nanorods with resonance peaks at 700 nm and 900 nm were functionalised with antibodies targeted to HER-2 and EGFR transmembrane receptors (Shah et al 2014) demonstrating potential for contrast photoacoustic stratification of tumours prior to therapy.
3.4. Assessment of normal tissue toxicity
Research investigating US quantification of normal tissue toxicity of RT is described below according to the normal tissue structures at risk from RT.
3.4.1. Salivary glands (head and neck RT).
Xerostomia is a common complication of dose to the salivary glands during head and neck RT (Eisbruch et al 2001). On B-mode US, parotid glands become more heterogeneous and hypoechoic post-RT (Ying et al 2007, Cheng et al 2011). Significant differences in UBC (Yang et al 2012, Imanimoghaddam et al 2012), spectral Doppler characteristics (Ying et al 2007, Wu et al 2011), and shear wave speed (Badea et al 2013) between irradiated and non-irradiated tissue have been observed in parotid or submandibular gland, although Imanimoghaddam et al (2012) saw no difference in spectral Doppler characteristics between baseline and 6 to 7 week post-RT. No study has examined the spatial distribution of US characteristics; this may be of particular interest for trials of parotid sparing (Chao et al 2001) which aim to spare the region of the parotid containing stem cells.
3.4.2. Neck tissue (head and neck RT).
In patients receiving head and neck RT, Leung et al (2002) detected significant differences (~25%) in subjectively estimated relative Young's modulus between regions of the neck receiving boost irradiation and those that did not. Zheng et al (2000) showed that skin thickness, MBF and SI of neck tissue significantly differed between patients following head and neck RT and healthy volunteers.
3.4.3. Normal breast tissue (breast RT).
Women undergoing adjuvant RT for breast cancer may experience breast swelling (oedema), an acute effect, and breast hardening (thought to be associated with fibrosis), a late effect (Yarnold et al 2005). Yoshida et al (2012) measured skin thickness, subcutaneous tissue lateral correlation (see table 5) and MBF, in the irradiated and un-irradiated breasts of breast cancer patients post-RT (Liu et al 2010). Patients with acute (<6 months) radiation toxicity had significant differences between breasts in all three characteristics. Those with late (>6 months) Radiation Therapy Oncology Group (RTOG) grade 1 or 2 skin toxicity (RTOG 2015) had greater skin or subcutaneous tissue US characteristics compared to patients with RTOG grade 0 skin toxicity.
B-mode US has been used to measure an increase in skin thickness (p < 0.001) and relative US backscatter amplitude of subcutaneous tissue (p ⩽ 0.05) post surgery and RT (Adriaenssens et al 2012). SE was used to measure a decrease (p < 0.05) in subcutaneous tissue stiffness in patients approximately 10 weeks post RT compared to pre-surgery (Adriaenssens et al 2012) and an increase in stiffness in the irradiated breasts of women with late toxicity compared to the unirradiated breast (Bush et al 2005).
3.4.4. Heart (breast RT).
The risk of heart disease subsequent to RT increases with mean heart dose (Darby et al 2013). Erven et al (2011) used strain rate imaging to show that left-sided breast cancer patients had a significant decrease (p < 0.001) in myocardial strain post RT (17.6 ± 1.5%) and 2 months follow-up (17.4 ± 2.3%) compared to pre-RT (19.5 ± 2.1%). No decrease in strain rate could be observed in segments that received less than 3 Gy but this may be due to the sensitivity of the technique rather than a lack of effect (Darby et al 2013).
3.4.5. Other tissues.
In patients receiving RT for head and neck cancer, spectral Doppler PI, RI, and PSV of the inferior thyroid artery underwent significant changes by fraction 10 of RT, and mean relative US backscatter amplitude and heterogeneity of the thyroid gland decreased (Bakhshandeh et al 2012). Krix et al (2005) showed that post-RT arterial phase DCE-US peak intensity increased in liver metastases suggesting radiation-induced hypervascularisation and support for the hypothesis that radiation-induced liver disease is a result of liver venous obstruction.
4. The use of US in 3D dosimetry
Accurate, cost effective, patient-specific 3D dose verification and validation tools are needed for verification of IMRT and arc RT. Available techniques include the reconstruction of 3D dose from portal images (van Elmpt et al 2008), 3D electronic dosimeters (e.g. Bedford et al 2009) and 3D plastic radiochromic dosimetry with optical CT read-out (e.g. Thomas et al 2011). Each has its disadvantages for routine use, and new approaches are required to verify future developments such as real-time adaptive RT that compensates for translational motion, deformation and rotation of the target between fractions and during irradiation (Landry et al 2015).
In addition, a direct experimental determination of dose in vivo would represent a major step forward, allowing real-time treatment adaptation of the dose distribution (Ziegenhein et al 2012). Various methods have been explored, such as PET imaging of hadron beam generated positron activity (Chatterjee et al 1981, Parodi et al 2002) and prompt gamma emission (Polf et al 2009), but none are, as yet, in wide clinical use.
US methods can be applied to 3D dose verification, and may provide advantages over the current techniques both in the clinic and for use in measuring national standards of dose. US methods for in vivo dosimetry, although more speculative, have received recent attention, especially for hadron and heavy ion therapy.
4.1. Verification using gel dosimetry
Two types of gel-based dosimeter have been investigated (table 7): (i) Fricke gel dosimeters (Schreiner 2004) and (ii) polymer gel dosimeters (Baldock et al 2010). Polymer gels that change their US properties on exposure to ionising radiation may in principle take advantage of the widespread availability of inexpensive US systems with high spatial resolution, which is important for resolving dosimetric properties such as a narrow (~1 mm) Bragg peak in hadron beams (Zeidan et al 2010). Alternative MRI (Maryanski et al 1994) or optical CT (Hilts et al 2005, Doran 2009) based systems may be expensive, time-consuming, or require new and dedicated imaging systems with limited sample size or resolution.
Common US gel formulations include polyacrylamide gel ('PAG') and methacrylic and ascorbic acid in gelatine initiated by copper ('MAGIC') gels (Mather et al 2002, Mather and Baldock 2003). US methods investigated for dose read-out are summarised in table 7, and include US CT imaging of sound speed and attenuation coefficient, backscatter attenuation estimation, backscatter B-mode, elastography (figure 8) and photoacoustics. Further work is required on batch variation and stability. This is, however, common to all gels and read-out methods (Baldock et al 2010). Recent work on the US read out of PAG and THPC antioxidant (PAGAT) gels shows promise (Khoei et al 2014), and deals with some limitations imposed by the frequency dependence of the relationship between US attenuation coefficient and dose (Crescenti et al 2007).

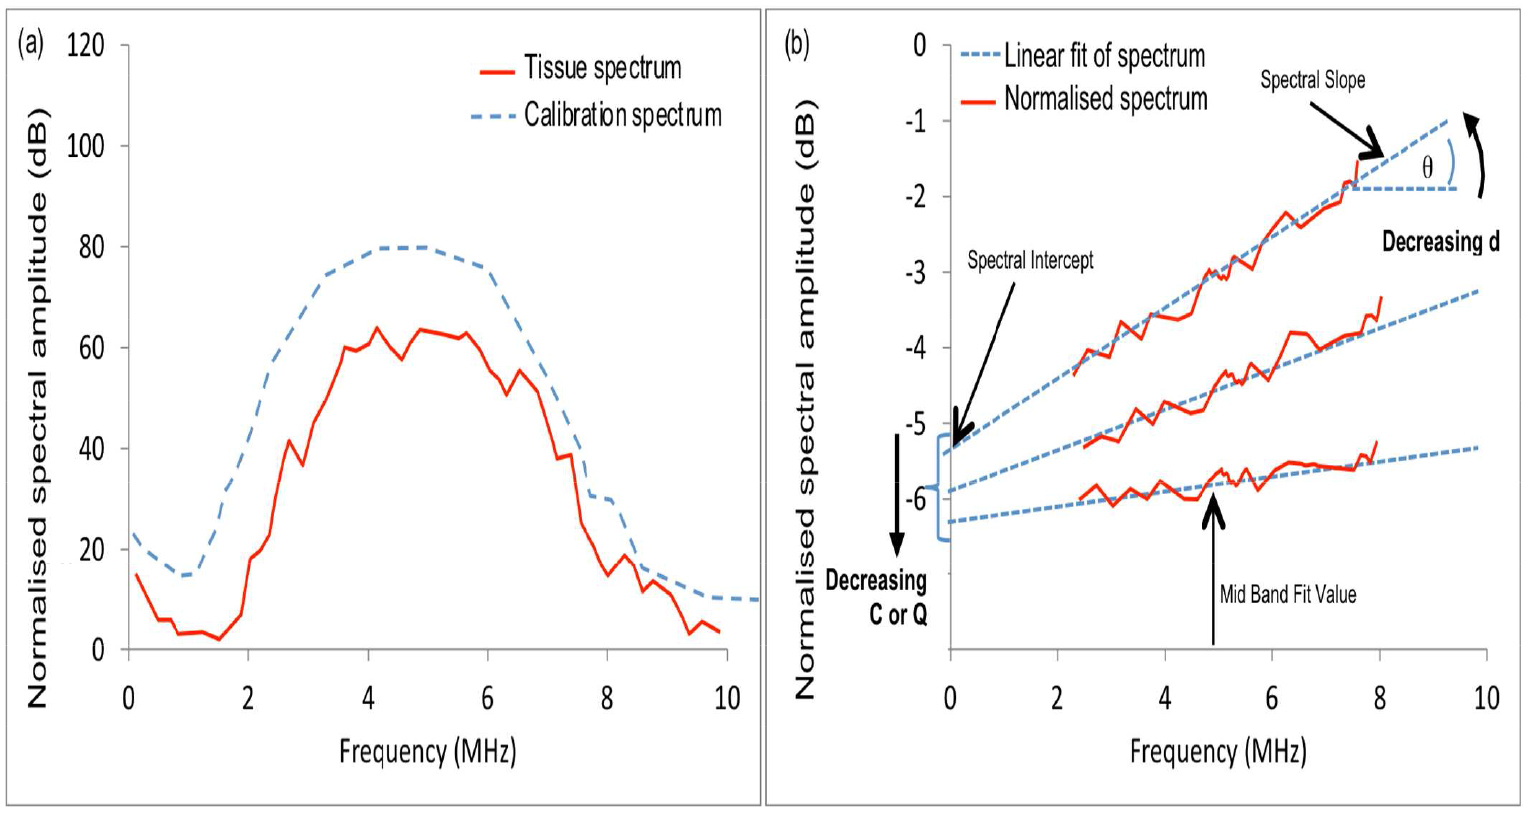
Figure 8. (a) A diagram showing the cross section of a MAGIC gel phantom and the geometry of three rod-shaped regions of square cross section each irradiated at a dose of about 18.2 Gy in a background of 0 Gy. (b) An axial strain image (derived from US measurements of displacements while axially compressing the phantom) of a central 35 mm by 48 mm area containing the three irradiated regions. (c) A relative Young's modulus map (linearly related to dose) computed by solving the plane strain inverse problem from the same displacements as used to calculate (b). Adapted with permission from Crescenti (2009).
Download figure:
Standard image High-resolution image
Table 7. US methods investigated for gel dosimetry. Further work is needed to reduce noise and artefact to turn each of these methods into practical dose verification tools.
| Method | Gel | Property change upon irradiation, and read-out description | References |
|---|---|---|---|
| US CT | Polymer | Polymerisation changes the US speed and attenuation coefficient, which may be imaged using US transmission computed tomography methods | Mather et al (2002), Mather et al (2003), Crescenti et al (2007), Khoei et al (2014) |
| US backscatter attenuation estimation imaging | Polymer | Polymerisation changes the US attenuation coefficient. By adding acoustic scatterers to the gels, this may be imaged using backscatter methods for estimating attenuation | Bamber et al (2004) |
| B-mode | Polymer | Polymerisation changes the US speed and mass density, and therefore acoustic impedance. By constructing gels with distributed radiosensitive and non-radiosensitive components, acoustic impedance changes are made visible in B-mode (backscatter) images | Finlay (2005) |
| Elastography (SE and SWE) | Polymer | Polymerisation changes the Young's modulus. By adding acoustic scatterers to the gels, this may be imaged using SE and SWE. Under such controlled conditions, inverse reconstruction allows SE to be quantitative (figure 8), as well as SWE | Bamber et al (2004), Crescenti et al (2009a, 2009b, 2010) |
| Photoacoustics | Fricke xylenol | Optical absorbance of radiochromic Fricke xylenol increases with a corresponding increase in photoacoustic signal. Measurements to date have used a microphone to detect photoacoustic signals | Caldeira et al (2007a, 2007b) |
4.2. Direct US sensing of dose
Rapid and highly localised energy deposition causes a local temperature rise, and a corresponding transient increase in pressure, which propagates away from the site of absorption as an acoustic wave. Although this is a weak effect, the attractive proposition exists that a form of 'photoacoustography' (e.g. using x-ray photons) might be used to reconstruct the dose distribution in vivo. A review by Baily (1992) gives more details of the underlying physics. A desired dose sensitivity of 0.1 Gy in a single pulse of radiation requires (since the absorption of 1 Gy in water gives a temperature rise of about 0.225 × 10⁻³ K) a temperature sensitivity of 22.5 μK.
The subject seems to have begun with the observation at Brookhaven National Laboratory that acoustic signals consistent with thermal expansion are detectable from proton beams traversing a fluid medium (Sulak et al 1979). Bavizhev et al (1992) proposed that acoustic emissions from the absorption of heavy charged-particles could be used to determine their energy within an error of less than 3%. Tada et al (1991) used a hydrophone to measure acoustic signals generated in the Bragg peak of protons of therapeutic energy and intensity deposited in water and whale muscle, and proposed acoustic time-of-flight determination of the dose distribution, reporting ability to locate the distal edge of the Bragg peak to within 3 mm. This group also measured an acoustic signal from proton therapy of the liver in vivo (Hayakawa et al 1995). By combining measurements and simulation, Assmann et al (2015) demonstrated that a 20 MeV proton beam with 105 protons per (473 ns) pulse would provide adequate SNR for detection in a water phantom, corresponding to ~1.6 Gy. At higher energies within clinical scenarios SNR is reduced by increased thermal noise and scatter, spatial and temporal dose deposition broadening and increased acoustic attenuation in tissue. Simulations predict that the Bragg peak can be determined with 1 mm accuracy (Jones et al 2014). Assmann et al (2015), Hayakawa et al (1995) propose that higher pulse intensity and shorter (ns) pulse lengths, potentially afforded by proposed laser-based particle accelerators, may provide the SNR required to perform ionacoustical dosimetry in vivo. Protonacoustic tomography has also been explored for mapping the 3D proton dose distribution (Stantz et al 2013, Alsanea et al 2015).
Mascarenhas et al (1984) measured the photoacoustic signal from 90 kVp x-rays absorbed in a 0.2 mm lead sheet. The feasibility of US detection of the absorption of x-rays from a medical LINAC was demonstrated by Bowen et al (1991) and further investigated by Xiang et al (2013) and Hickling et al (2014). Substantial improvements in sensitivity appear to be needed to turn these methods into practical tools for in vivo RT dosimetry. However, there remains scope to explore the use of much shorter pulses of ionising radiation, which will increase the strength of the acoustic signal generated.
4.3. Speed of sound (SOS) dosimetry
SOS, reviewed by Bamber et al (2004), is dependent on temperature. Johnson et al (1975) suggested using SOS images reconstructed by time-of-flight US CT (Greenleaf et al 1975, Glover and Sharp 1977) to map temperature changes in vivo to monitor hyperthermia. The slope of SOS versus temperature is similar (and positive) for all tissues (Nasoni 1981) except fat, for which it is negative (Bamber and Hill 1979). Eventual temperature sensitivity in non-fatty tissue of 0.2–0.5 K was predicted. US CT requires US transmission through an entire organ, and is thus applicable only to organs such as the breast. There are, however, US backscatter methods for reconstructing SOS, and recently Jaeger et al (2015) claimed potential resolution of about 3 (laterally) × 1 (axially) mm and SOS contrast discrimination of 0.6%. A form of backscatter US thermometry has also been evaluated for planning high intensity focused US treatments. Changes in SOS manifest in apparent tissue displacements measured using RF speckle tracking (section 2.2.1), offering potential temperature sensitivities better than 1 K (Seip et al 1996, Bamber 1997, Miller et al 2002). In practice the sensitivity of this technique is limited by variability between tissues in their strain/temperature coefficients, tissue deformation and motion (Civale et al 2013).
Whilst it is unlikely that the changes in SOS which result from a temperature rise in the region of tens of μK will be detectable in vivo, the sensitivity of SOS to local temperature changes in water after high energy deposition by ionising radiation is actively being exploited by the National Institute of Standards and Technology (NIST) (Malyarenko et al 2006) with the aim to replace water calorimetry as the national primary dosimetry standard; Malyarenko et al (2008) presented a practical 5 MHz US CT system for near real-time imaging of SOS in a water phantom which demonstrated sensitivity to sub-mK temperature changes generated by the absorption of infrared radiation. This instrument has the potential to characterise the dose profiles of therapeutic radiation beams. The authors propose improvements in sensitivity to the μK level.
5. Concluding remarks
As was indicated in figure 1, the integration of US into the RT workflow provides exciting opportunities beyond the management of inter-fraction motion, by introducing (without additional ionizing radiation exposure to normal tissues) relatively low cost, high spatial resolution, high temporal resolution imaging methods for improving: definition of the BTV for RT planning, 3D dose verification for individual patients, intra-fraction motion estimation and management, prediction and measurement of tumour response to treatment and assessment of normal tissue reaction to RT.
The methodology for US intra-fraction motion estimation has been established, providing advantages over alternative methods of high temporal sampling, non-invasiveness, ability to measure deformation and provision of continuous monitoring without additional radiation dose. Accuracy appears sufficient and, with further work, regularisation methods combined with eventual high volume rate 3D US imaging using matrix arrays and plane wave techniques look promising for providing the required reliability. System latencies seem unlikely to be a problem when using the information for real-time control of RT delivery. More clinical studies, including a range of cancer sites and the guidance of particle therapies, are required if we are to exploit the full potential of this powerful technique.
The introduction of US scanners into the treatment room and its burgeoning acceptance into the IGRT toolkit should pave the way for exciting developments in US molecular and functional imaging to be used to improve RT target definition and monitor treatment response. Conjugation of microbubbles and nanoparticles with targeting agents has opened up the possibility of acoustic and photoacoustic molecular imaging. The technological development required to translate these techniques into the clinic is underway. Work has to be done to characterise the sensitivity of these techniques to established markers of cancer that may help define a BTV and monitor treatment progression. Intrinsic US characteristics of cancer, such as abnormal vasculature or altered stiffness, can be measured with Doppler US, contrast agents or elastography. They may not only provide the means to define and monitor the target but also could be used for daily treatment verification of the BTV. The application of US to radiation response assessment appears to be an exciting area in which new technologies such as super-resolution contrast US imaging may enable deep visualisation of microvasculature and, therefore, early measurement of response to RT in vivo.
Quantitative in vivo measures of normal tissue response to RT are needed to support (1) clinical trials evaluating new RT techniques, including anti-fibrotic, anti-angiogenic and anti-hypoxia therapies, and (2) the investigation of genetic and physiological susceptibility to radiation toxicity (Alsner et al 2008). Maps of the spatial distribution of toxicity severity could be compared with dose distributions to provide greater statistical power to test the relationship between dose and toxicity (Jeraj et al 2010). US backscatter characterisation and elastography hold promise for this, potentially providing cost effective and non-invasive in vivo methods to monitor the evolution of radiation toxicity in large patient populations. The introduction of spatially registered 2D and 3D US into the simulation suite and treatment room provides automated image fusion with CT and MR planning images for multi-modality target delineation. This also provides the opportunity for longitudinal studies of treatment response using functional US imaging spatially registered to the RT target volume, normal tissue and the dose distribution.
Finally, with further development, US may offer a variety of techniques suitable for wide dissemination of cost-effective 3D dosimetry. Although US dosimetry has been investigated for many years without significant impact, substantial opportunity is present for further work. It may also play a role in providing deformable 3D phantoms that can be used to develop and validate complex and dynamic RT delivery.
Acknowledgments
T O' S, J B and E H would like to gratefully acknowledge support from the Cancer research UK Programme Award C17616/A19727 and the CRUK Cancer Imaging Centre at ICR in association with MRC & Dept of Health C1060/A16464, and NHS funding to the NIHR Biomedical Research Centre at The Royal Marsden and the ICR. SvdM is funded by GROW (School for Oncology and Developmental Biology, Maastricht University).