
Abstract
Iron-doped ZnO nanoparticles have been synthesized through high-energy ball milling of powders produced by the co-precipitation method. Fine particles with an average size down to 40 nm have been obtained after 15 min of milling. Fe3+ cations have been incorporated into the ZnO lattice within the limits of the solubility. By using multi-frequency and high-field electron paramagnetic resonance (EPR) we have resolved all electronic transitions for the S = 5/2 high-spin system and have accurately determined the EPR spin-Hamiltonian parameters. By combining data from crystallographic x-ray diffraction and EPR with the semi-empirical Newman superposition model we have found the local configurational position of Fe3+ and have confirmed the symmetry of the lattice. Results presented in this paper indicate that Fe cations most probably substitute at Zn-sites in ZnO. At nanosizes the effect of Fe3+ cations on the surface becomes remarkable: additional size effects can be observed in the EPR spectrum, which are different from the spectrum of bulk.
Export citation and abstract BibTeX RIS
1. Introduction
ZnO is one of the most intensively studied n-type metal oxides due to its direct wide band gap (3.37 eV at room temperature) and high exciton energy (60 meV). Doping ZnO with transition metal elements [1], such as Fe, Co, Mn or Cr, leads to materials with an entirely different response towards magnetic and optical excitations. Such new materials are commonly known as diluted magnetic semiconductors (DMS) [2–4]. Upon doping with transition metal ions, such as Fe3+ [5], Cr3+ [6], Co2+ [7] and Mn2+, DMS materials based on ZnO do not only display ferromagnetism at room temperature [8] but simultaneously also exhibit semiconducting properties [3]. Recently, Mn-doped ZnO revealed ferromagnetism above room temperature [9], which is important for its application in new spintronic devices (spin LEDs, spin valve transistors) and magneto-optic components. However, there are also studies that report there is no indication of ferromagnetism or antiferromagnetism [10]. The same discrepancy applies to Fe-doped ZnO [11–13]. It was reported that Fe3+ can act as a spin qubit, which makes this material attractive for its possible usage in quantum computers [14]. The effect of Fe doping on the structural [15, 16], optical [15–17], electronic [12–14, 18, 19] and magnetic [5, 11, 12, 16, 20] properties of ZnO has been investigated experimentally for many years. Very recently it was reported that Fe-doped ZnO even shows an enhanced ability to kill certain human cancer cells [21]. Numerous theoretical studies, which are mainly focused on the defect structure of tetrahedral Fe3+ centers, also exist [22–24]. However, due to insufficient analytical characterization of the materials and the lack of data from advanced electron paramagnetic resonance (EPR) techniques, which precludes the unambiguous determination of spin-Hamiltonian parameters for Fe3+ incorporated into ZnO, the local position of Fe3+ in the ZnO lattice and the sign of the zero-field splitting (ZFS) parameters remain unclear and are still a matter of debate [12–14, 19, 20, 22–25].
In most previous EPR studies, Fe3+ in ZnO was investigated either using EPR at only one single EPR frequency or by examining samples with very high Fe concentrations above the solubility limit. Reliable data on spin-Hamiltonian parameters for Fe-doped ZnO was not available. In this work, we aim at combining a more complete experimental data set from high-frequency and multi-frequency EPR with calculations based on the semi-empirical superposition model (SPM) [26] to yield information on the local environment of Fe3+ cations in ZnO. The SPM correlates structural data (bond distances and angles) and intrinsic parameters (strongly depending on the crystal field) with spin-Hamiltonian parameters; this allows extraction of spin-Hamiltonian parameters from simulations [27] of EPR spectra and their subsequent matching with the calculated data obtained from the SPM. We also investigate 'size effects' in Fe-doped ZnO by multi-frequency and ultra-high-field EPR spectroscopy.
2. Experimental
To synthesize Fe-doped ZnO nanoparticles, various methods were applied, such as chemical pyrophoric reaction [11], thermal decomposition of metal precursors [28], sol–gel [15], mechanical alloying [29] and plasma-assisted molecular-beam epitaxy [30] methods. In this work, we introduce a facile, inexpensive, effective, environmentally friendly and very fast way of producing Fe-doped ZnO powder by using a co-precipitation method that allows for easy incorporation of metal ions into the lattice and the adjustment of the particle size by applying subsequent high-energy ball milling [31] for various durations.
Zinc chloride and iron(III) chloride were prepared by dissolving the respective 99.999% metal rods in 37% hydrochloric acid. Both solutions were mixed to produce 0.01 mol% iron(III) chloride and a 0.99 mol% zinc chloride solution (starting solution mixture). The final ZnO solid was prepared by co-precipitation with potassium hydroxide. The precipitate was filtered, washed with water and dried (precursor). The calcination was performed for 5 h at 900 °C, and the final product was investigated in this work as the 'as received' sample. The milling of ZnO powder was carried out by using a PULVERISETTE 7 premium line (Fritsch) mill at room temperature. Diamagnetic zirconium oxide milling media with 10 mm balls at a speed of 800 rpm and a ball-to-powder weight ratio of 20 : 1 was used for various milling times (from 0 to 14 min).
To check crystallinity, stoichiometry and the purity of the nanopowders, x-ray diffraction (XRD) was applied with a STOE IPDS2 powder diffractometer equipped with a Cu Kα radiation source at a wavelength of λ = 0.154 nm. Samples were measured by Debye–Scherrer geometry.
X-band (9.86 GHz) and Q-band (33.9 GHz) EPR measurements were performed on a Bruker EMX spectrometer (Karlsruhe, Germany) with an H011 cavity at room temperature. The magnetic field was read using an NMR gaussmeter (ER 035M, Bruker); as a standard magnetic-field marker, polycrystalline DPPH with g = 2.0036 was used for the accurate determination of the resonance magnetic-field values. Magnetic-field-modulated continuous-wave EPR experiments at high microwave frequency (112 GHz) were performed at room temperature at the National High Field Magnetic Laboratory in Tallahassee, Florida, using a multiplied solid-state source for the microwave radiation, set up without a resonator, and detecting the radiation with a InSb hot-electron bolometer.
3. Theoretical background
In the structure of the hexagonal ZnO : Fe3+ system, each trivalent iron (Fe3+) cation possesses five unpaired electrons in the 3d shell (3d5) and is expected to occupy Zn2+ sites with trigonal type-I (C3v) symmetry. The energy levels of the ground spin state of Fe3+ (with the electron-spin quantum number S = 5/2) at C3v (trigonal) symmetry in ZnO can be described by the spin Hamiltonian of the form [32–35]
where the first term represents the electron Zeeman (Ze) interaction. Here, μB denotes the Bohr magneton, B0 the external magnetic field and g the electronic g-matrix, which can be considered isotropic with a value close to that of the free electron (g(free-electron) = 2.0023). For Fe3+ this g value is typically giso = 2.002 [36, 37]. The second term represents the ZFS contribution consisting of ZFS parameters  and
and  associated with the extended Stevens operators
  .
.
The coefficients  in equation (1) are related to the conventional second-rank (D) and fourth-rank (a and F) spectroscopic parameters by [22]
4. Results and discussion
XRD patterns obtained from the as-received (no milling) and milled Zn1–xFexO (x = 0.01, 1 mol% Fe) powders are shown in figure 1(a). All samples exhibit one single phase with a wurtzite lattice structure, thus excluding the presence of any secondary phase. All detectable diffraction peaks in figure 1(a) belong to the ZnO phase (International Center for Diffraction Data Card no: 70–8070, Bravais lattice: primitive hexagonal, a = b = 0.324 nm and c = 0.520 nm). The particle sizes were determined by using Scherrer's equation, D = kλ/(β cos θ), where D is the mean grain size, k is Scherrer's constant (k = 0.9 at half the maximum intensity (FWHM)), λ is the x-ray wavelength, β is the FWHM of a diffraction peak, and θ is the diffraction angle. Figure 1(b) shows the variation of the average crystallite size of ZnO particles as a function of the milling time. The average crystallite size of ZnO decreases from 165 to about 48 nm with prolonged milling time. Very sharp diffraction peaks of ZnO are observed for the as-received powder; however, considerable peak broadening accompanied by a drastic attenuation of peak intensity is detected with increasing milling time, see figure 1(a). Such 'size effects' in XRD profiles were observed by us not only for different sample systems, such as ferroelectric PbTiO3 [38–40], but also in the case of ZnO for different types of milling, such as freezer milling [41] or high-energy ball milling [42]. Size effects observed in XRD profiles have been attributed to the increase of internal strain in smaller particles introduced by the milling process [38–43].
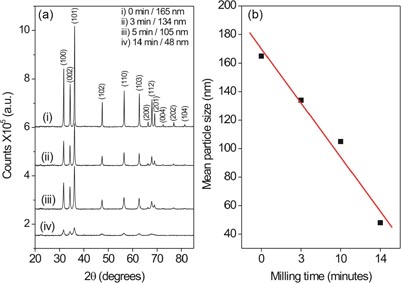
Figure 1. (a) XRD patterns of Zn1–x FexO (x = 0.01) powders obtained after different periods of ball milling (0–14 min). (b) Average crystallite sizes extracted from the data depicted in (a).
Download figure:
Standard image High-resolution imageThe simulated angular dependence of the EPR spectrum of Fe3+ and the experimental Q-band EPR powder spectrum for the unmilled ZnO sample with an average particle size of 165 nm are presented in figure 2. The simulation of the rotation pattern was obtained by using the EasySpin program package written for Matlab [27]. The function sphgrid has been used with the following parameters: 33.98 GHz (microwave frequency), 2.0065 (g-factor),  = 612 MHz and |a–F| = 108 MHz (see equation (2) for the meanings of a and F), and the final 'roadmap' was simulated for ϕ = 0 and 0 ≤ θ ≤ π/2 with the standard polar representation magnetic field versus θ. Due to lattice deformations at nanosizes, random internal strain distributes the ZFS parameter values, in particular the axial component. The manifestation of this distribution is exactly the same as observed, i.e. the broadening of EPR spectra with a reducing of the particle size [43]. Thus, we always added a distribution term to the axial ZFS (σ = 3% of
  ) parameter in the simulation script to obtain optimal simulations of the experimental EPR spectra. There is no doubt that the spectrum in figure 2, that was obtained using Q-band EPR, is caused by Fe3+ cations in ZnO [14, 19, 25, 44]. The EPR lines are designated a, b, c, d and e in figure 2, where c indicates the central transition (+1/2 ⇔ –1/2) and a, b, d and e indicate peripheral ones (–5/2 ⇔ –3/2, –3/2 ⇔ –1/2, +1/2 ⇔ +3/2, +3/2 ⇔ +5/2). The assignment p+ (a and b in figure 2) and p– (d and e in figure 2) belong to the electronic transitions between the negatively and positively signed magnetic spins, respectively. The assignment enables us to distinguish the following allowed transitions: p+,90°: (–1/2 ⇔ –3/2) ⊥; c,90°; c,0°; c,42°: (1/2– ⇔ 1/2)⊥, ||,41°; and p–,90°: (3/2 ⇔ 1/2) ⊥. As depicted in figure 2, the central transitions c,90°; c,0°; c,41° and the peripheral ones p+,90° and p–,90° are simulated and match very well the corresponding EPR lines. The outermost peripheral transitions are very weak because they arise from the parallel orientation of low statistical weight. In particular the central transition (c) has three extreme points appearing from the perpendicular, the parallel and an extremum depending on the angle θ at 41°. Thus, we observed three strongly angular-dependent EPR lines for the central transition. So far, a similar angular orientation has been observed for Fe-doped ZnO, either for cw [19] or echo-detected [14] X-band EPR, but not for Q-band EPR. Due to the high sensitivity of higher field EPR (here, Q-band) we observed a complete matching of extremum points.

Figure 2. Simulated angular dependence of EPR resonances from Fe3+ with the derivation of the corresponding Q-band EPR powder spectrum of ZnO (165 nm mean particle size) measured at room temperature. dI/dB is the first derivative of the absorption EPR signal with respect to the magnetic field B.
Download figure:
Standard image High-resolution imageFor the characterization of Fe3+ cations in a non-cubic environment it is advantageous to acquire and analyze powder spectra at various microwave frequencies. Figures 3(a)–(d) show X, Q and W-band EPR data of ZnO powders recorded at 290 K. At first inspection, the increase of the microwave frequency, and thus the magnetic field, causes a simplification of the EPR powder spectrum compared to that obtained at a lower magnetic field and microwave frequency, and consequently renders simulations of high-field EPR spectra more reliable. At higher magnetic fields the spin states are close to pure Sz states (with z aligned along the direction of B) and only ms → ms±1 transitions are allowed. Fe3+ EPR spectra of ZnO have been presented in some articles; however, in most of them [11, 13, 20, 28] EPR has revealed a single broad line mostly of Lorentzian shape. This broadening was mainly attributed to ferromagnetic exchange interactions between Fe3+ cations [13, 20, 28]. However, in addition to the aforementioned effects, we believe that the main reason for this kind of line broadening could be due to a Fe2O3 secondary phase, which may form in the grain boundaries during the preparation stage of the material. Thus, the solubility limit of Fe in ZnO is quite important for the incorporation of it into the lattice. Note, that the broad Fe2O3 EPR signal, which resembles the broad (above ~50 mT linewidth) EPR spectra of Fe-doped ZnO [13, 20, 28], can also be found elsewhere [45, 46]. Here, our X, Q and W-band results, shown in figures 3(a)–(d), clearly indicate the incorporation of Fe3+ cations into the ZnO cell within the solubility limit; thus, limited spectral broadening is observed in the present study. From broad EPR lines it is typically not easy to extract ZFS parameters and the g-factor. Therefore, from one single and broadened unresolved spectral line, typically only the effective g-factor of Fe may be obtained. In the present case, having a very narrow EPR linewidth of only 1 mT, we are able to determine accurate parameters associated with a trigonal Fe3+ center. These are listed in table 1 and are compared with values from the literature.
Table 1. Spin-Hamiltonian parameters obtained from the spectral simulation of X-, Q- and W-band EPR spectra of Fe3+-doped ZnO. The conversion relations given in equation (2) [22] for the  apply to the conventional ZFS parameters (D, a and F). Other experimentally determined parameters are also listed for comparison. The ZFS parameters are converted from their original units into units of cm–1.
| g-factor | [PS: Present study] | [PS] | [52] | [53] | |
|---|---|---|---|---|---|
| 2.0065(2) | 2.0041 ± 0.00117 | 2.0062 | |||
| in MHz | in 10–4 cm–1 | ||||
 |
–612(1) |  |
612.61 | 593.77 ± 0.7~a | 595.16a |
| A | 120(1) | a | 40.04 | 46.36 ± 1.2 | 41.13 |
| F | 11.8(1) | F | 3.94 | 10.72 ± 1.2 | — |
| (a–F) | 108.2(1) | (a–F) | 36.10 | 35.64 ± 1.2 | 37.10 |
 |
–0.616(3) |  |
–12.33 | –11.88 ± 0.4 | –12.37 |
 |
18.88(3) |  |
377.50 | 437.09 ± 11.3 | 387.8 |
aThese experimental values were given negative in their source papers.
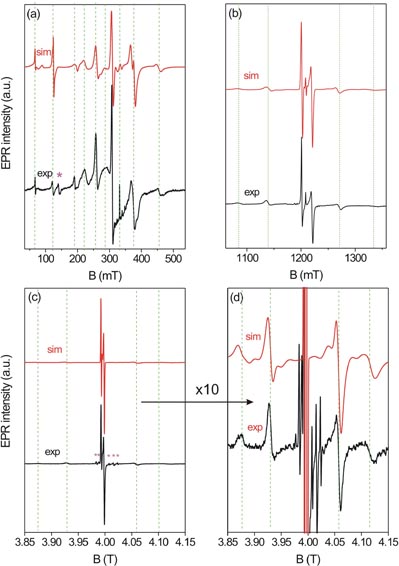
Figure 3. EPR measurements for the 165 nm Fe3+ doped ZnO at 290 K and their simulations. (a) X-band (9.8 GHz) (b) Q-band (33.9 GHz) and (c) 112 GHz (W-band) and (d) enlargement of (c) by a factor of 10. The (*) in (a) indicates impurities in the X-band EPR resonator and the six (*) in (c) indicate Mn2+ hyperfine lines arising from the sample holder which were only detected at high-field EPR (112 GHz).
Download figure:
Standard image High-resolution imageThe discussion on zinc and oxygen vacancies largely diverges in the literature: a number of studies support the idea that the zinc vacancies are responsible for charge compensation in Fe-doped ZnO [11, 25, 47]; however, it has also been suggested that oxygen vacancies can play a role in charge compensation [48]. Nonetheless, the discussion is still ongoing, and in some cases it is reported that ferromagnetism may be induced by defects in such vacancies [49]. Induction of ferromagnetism has also been reported for SnO2 semiconductors due to the fact that positively charged monovalent O vacancies can induce local magnetic moments in the material and that the magnetic coupling between two positively charged vacancies is ferromagnetic [50, 51].
To investigate size effects by EPR, the room temperature X-band spectra of Fe3+-doped ZnO particles (165 nm, 105 and 48 nm) are shown in figure 4. At first glance, the EPR spectrum of the 48 nm ZnO sample is very different from those of the samples with grain sizes of 165 and 105 nm. We did not observe strong spectral changes when going from 165 to 105 nm. One can recognize that in the 48 nm ZnO sample most iron transitions merge towards each other and are no longer detectable. In general, in the Fe3+ spectrum the remaining peaks are broadened when going to smaller mean particle sizes. Besides the broadening effect, the central ZFS peaks (labeled as c in figure 2) approach each other and their separation decreases with decreasing mean particle size. The peaks appear to merge into a broad and asymmetric line. It is generally believed that the broad EPR signal of Fe3+ cations in ZnO is a clear indication of ferromagnetism [13, 20, 28]. This kind of broadening can also be observed in the EPR data of our samples displayed in figure 4, thus indicating enhanced ferromagnetic behavior due not to the exchange interactions between Fe cations, but to the reduction of the dimension of nanocrystals from 165 to 48 nm. The coalescing of Fe3+ lines into a single broad line around g~2 can indeed be rationalized by the core–shell model [41, 42, 53–55]. In the case of undoped ZnO nanoparticles, we recently distinguished two EPR signals arising from the interior hexagonal core and the outer shell where the shell signal (surface defects) increases and the core signal (bulk defects) decreases by reducing the particle size [41, 42]. However, in Fe-doped ZnO this kind of distinct separation of shell and core EPR signal is not possible due to the high intensity of the Fe3+ signal in relation to intrinsic defect signals. Nevertheless, at nanosizes the effect of Fe cations on the surface (shell) increases in weight, and thus additional spectral changes can be observed in the EPR spectrum. This is largely due to the increase of anisotropy in particles with a distribution of sizes and changes in their morphologies [40, 41].

Figure 4. (a) Comparison of X-band EPR spectra of 165 nm (as received), 105 nm (5 min milled) and 48 nm (14 min milled) ZnO : Fe3+ samples. (b) X-band EPR spectral simulation (sim) and EPR experimental (exp) spectra of 48 nm (14 min milled) ZnO : Fe3+ sample.
Download figure:
Standard image High-resolution image5. Analysis of the local environment of Fe3+ cations in Fe-doped ZnO: application of an SPM calculation for ZFS parameters
In order to determine the local structure and the exact position of the Fe3+ cations in the hexagonal ZnO host, we employed the semi-empirical SPM. This model was first introduced by Newman [26] to correlate the geometrical structure and EPR spectroscopic information, and has proven to be very useful in probing the local structure and configuration of paramagnetic ions inside a host lattice. The SPM enables the determination of the spin-Hamiltonian parameters from a given defect structure, or vice versa [56]. It is mainly based on the assumption that the spin-Hamiltonian parameters of a paramagnetic ion are built up of individual contributions of neighboring constituents, where the interaction between the next-nearest neighbors is ignored. In this approximation, the ZFS parameters for an Fe3+ cation accommodated in the tetrahedral coordination of Fe3+ and O2− ions can be determined from a linear superposition of four single ligand contributions.
We predicted the ZFS parameters in equation (1) by using the SPM [26, 56]—the expressions for the ZFS parameters  in a tetrahedrally coordinated center have been outlined recently [57, 58]. The following equations were derived for the [Fe–O4]5– ligand complex in ZnO at a Zn2+ site exhibiting C3v symmetry:
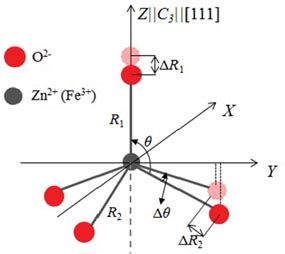
where R0 is the reference distance, and R1 and R2 are the distances of the ligand along the c||[1 1 1] axis and the distances of the other three ligands, respectively. θ is the angle between the trigonal c-axis (as the EPR main axis) and the Fe3+ cation–O2– neighbor interconnection axis. The crystal structure of ZnO is shown in figure 5. The local structure parameters are R1 = 0.196 nm, R2 = 0.198 nm and θ = 109.4712° for the Zn2+ site [19]. The other parameters  and tk in equations (3) and (
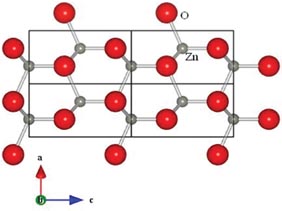
Figure 5. Crystal structure of ZnO. The orientation of the crystallographic axes is shown.
Download figure:
Standard image High-resolution imageFor Fe3+ in ZnO, the (IPs)  and tk have been published [59, 60]. Two different second-rank parameter sets (
 and t2) in [59], and only one fourth-rank parameter set (
  and t4) in [60], were provided with the values listed in table 2. For SPM application in addition to the IPs, a reference distance R0 should be included in a combined set, which is known as the SPM parameter set [61]. In our calculations, we adopt the values gathered in set A given in table 2 and the reference distance R0 by choosing R0≈Ravg[62], which is generally considered as the M–O interaction distance, where M is the cation metal ion, i.e. Zn2+ in the present case.
Table 2. Values for the input model parameter (MP) determined for Fe3+ cations in ZnO;  are in 10–4 cm–1, R0 in nm.
| Set | Ref. |  |
t2 | Ref. |  |
t4 | R0(for both  &) &) |
|---|---|---|---|---|---|---|---|
| A | [59] | 15480 | 3 | [60] | –12 | 14 ± 1 | — |
| A(–) | –15480 | 3 | –12 | 14 | 0.1975 nm | ||
| A(+) | +15480 | 3 | –12 | 14 | 0.1975 nm |
Using the model parameters and data from the host crystal structure for the Zn2+ site, we calculated the ZFS parameters for Fe3+ cations in ZnO. The results are presented in table 3 (Calc.a). As expected, the calculated parameters deviate from the experimental ones. When a Fe3+ cation substitutes for Zn2+, charge compensation is required for this substitution. Furthermore, as the ionic radii are quite different (the ionic radius of Zn2+ (0.074 nm) is considerably larger than that of Fe3+ (0.064 nm)) one can expect local structural distortions around the Zn2+ site.
Table 3. Distortion parameters obtained from SPM calculations for iron-doped ZnO nanopowders. All distortion parameters are in nm for ΔR and degrees for Δθ.
| MPs |  |
 |
 |
ΔR1 | ΔR2 | Δθ | |
|---|---|---|---|---|---|---|---|
| Calc.a | A(–) | –475.1 | –13.78 | 339.74 | — | — | — |
| Calc.b | A(–) | –612.6 | –14.33 | 339.74 | –0.000564 | — | — |
| Calc.c | A(–) | –612.5 | –13.76 | 325.79 | — | 0.000594 | — |
| Calc.d | A(–) | –612.6 | –13.59 | 341.62 | — | — | –0.1806 |
| Calc.e | A(–) | –612.6 | –13.68 | 333.59 | — | 0.000298 | –0.0904 |
| Calc.f | A(–) | –612.6 | –12.33 | 377.49 | 0.000687 | –0.001178 | –0.7400 |
| Calc.a | A(+) | 475.1 | –13.78 | 339.74 | — | — | — |
| Calc.b | A(+) | –612.6 | –10.01 | 339.74 | 0.004704 | — | — |
| Calc.c | A(+) | –612.7 | –13.94 | 467.51 | — | –0.004464 | — |
| Calc.d | A(+) | –612.5 | –15.34 | 323.16 | — | — | +1.4822 |
| Calc.f | A(+) | –612.6 | –12.33 | 377.57 | 0.002073 | –0.001610 | +0.2780 |
aCalculations on host crystal structure data (ΔR1 = ΔR2= Δθ =0).
bCalculations based on the direct matching of the distortion parameter ΔR1 to the experimental ZFS parameters  to reveal ΔR1,max.
cCalculations based on the direct matching of the distortion parameter ΔR2 to the experimental ZFS parameters
to reveal ΔR1,max.
cCalculations based on the direct matching of the distortion parameter ΔR2 to the experimental ZFS parameters  to reveal ΔR2,max.
dCalculations based on the direct matching of the distortion parameter Δθ to the experimental ZFS parameters
to reveal ΔR2,max.
dCalculations based on the direct matching of the distortion parameter Δθ to the experimental ZFS parameters  to reveal Δθmax.
eCalculations based on the direct matching of the distortion parameters both ΔR2 and Δθ to the experimental ZFS parameters
to reveal Δθmax.
eCalculations based on the direct matching of the distortion parameters both ΔR2 and Δθ to the experimental ZFS parameters  .
fCalculations based on the direct matching of all the distortion parameters ΔR1, ΔR2 and Δθ to the experimental ZFS parameters both
.
fCalculations based on the direct matching of all the distortion parameters ΔR1, ΔR2 and Δθ to the experimental ZFS parameters both  and
and  .
.
Understanding the influence of impurity ions on local properties of a relevant structure is crucial for technological applications of materials. The process to reveal a picture of the local structural distortion around a transition metal ion needs to be based on some definite modeling approaches (Calc.a–Calc.f), which are defined in the footnotes of table 3. For the present ZnO : Fe3+ system, the local structural distortion for [FeO]5– clusters can be determined in terms of three distortion parameters, ΔR1, ΔR2 and Δθ, which are illustrated in figure 6. The results for ZFS parameters and the corresponding distortion parameters are also presented in table 3 for several modeling approaches.
Figure 6. Structural distortions around the [Fe–O4]5– complexes located at the substitutional (C3v) Zn2+ sites.
Download figure:
Standard image High-resolution image
It should be noted that IP  was provided as positive in its source paper as in our MP A(+). However, for the first approach (Calc.a), A(+) yields a positive
  , which is in contrast to the negative value of
  from the experiment. Thus, we also carried out calculations using A(–), which yields a negative
  . As can be seen from table 3, using either the MP A(+) or the MP A(–), it is possible to obtain a very good agreement between the theoretical and experimental data of both second-rank (
 ) and fourth-rank (
 and
and  ) ZFS parameters. The positive/negative sign in ΔR corresponds to an elongation/compression in the ligands' distances, whereas those in Δθ correspond to an increase/decrease in θ, respectively. The same system was previously studied by Li et al [22] and independently by Yang [23] by applying a different theoretical method based on diagonalizing the complete energy matrices. ΔR = –0.0119 nm (for both R1 and R2) and Δθ = 0.339o were obtained by Li et al [22], and a Δθ of only 0.475°–0.562° by Yang [23] with respect to the experimental findings [52]. These values describe considerably stronger distortions for the ligand distances with respect to the ones (from both A(+) and A(–)) determined here, and an increase in θ similar to that of A(+). Consequently, the above comparison indicates that the obtained distortions are quite reasonable and the results from MP A(+) are more plausible than those from MP A(–).
6. Conclusions
We synthesized Zn1−xFexO (x = 0.01) nanoparticles by using the co-precipitation method with subsequent high-energy ball milling for various durations. Various mean particle sizes ranging from 165 to 45 nm were obtained. We observed the EPR signal of the isolated Fe3+ cation, which strongly indicates that the Fe cations most likely localize Zn-sites in the ZnO lattice. However, there is always the possibility that iron could also enter at interstitial positions or localize on particle surfaces. EPR line broadening effects, which are indicative of strong ferromagnetic behavior, were only observed for smaller particle sizes. By using the semi-empirical SPM model we confirmed the spin-Hamiltonian parameters that were obtained from an analysis of EPR spectra.
Acknowledgments
This study was financially supported by the Deutsche Forschunsgemeinschaft (Grant: Er 662/1-1). EE is grateful to Dr P Jakes for sample preparation, Dr M Ade for XRD measurements, Professor R Böttcher (University of Leipzig), S Repp (University of Freiburg) and Professor R-A Eichel (FZ Jülich) for valuable discussions. We gratefully acknowledge support by Mrs S Tu. The National High Magnetic Field Laboratory is supported by the National Science Foundation through Cooperative Agreement No DMR-1157490, the US Department of Energy (DOE) and the State of Florida.