

Abstract
Wood defects and grain angle correlate strongly with timber strength and grading. In this study a laser transillumination imaging method was developed to determine wood defects and grain angle. The method uses a near infrared laser light source which illuminates a wood sample with a round beam and the image generated by the light transmitted through the sample is captured for further analysis. In basic and flawless wood, the transmitted light pattern is an ellipse and wood defects and grain angle deviation will change the shape, size and location of the ellipse. The method could be used for determining the strength of wood, grading sawn timber, studying finger and glue joints, estimating moisture and differentiating between heartwood and sapwood.
Export citation and abstract BibTeX RIS
1. Introduction
Wood is a chemically and physically non-homogeneous material. In ideal wood, grain direction is oriented straight from the base to the top of a tree. The wood grain can also exist in a spiral form around the tree core. This phenomenon is common in pine and occurs especially when trees grow in infertile places [1]. Irregular points in wood, like knots, cause the basic grain direction of wood to deviate from the ideal case [2].
Wood grain direction affects the mechanical properties of wood. The most important characteristic is the bending strength. Wood with a straight or almost straight grain has a high bending strength and is therefore desired for example in the wood construction industry where buildings, halls and bridges have a long span. Also wood industries, like furniture, boat and small airplane construction, prefer straight grained wood.
In knots, grain direction deviates by 45–90° from that of basic wood. Because knots have a specific visual appearance due to their grain direction, they can be readily observed and analysed using transillumination method. Knots impact the strength of wood mainly because wood grain direction changes considerably in the vicinity of knots [3]. Wood breakage usually starts from the steepest deviation point of the grain angle rather than from the knot itself. The most important timber grading criteria are size, amount and location of knots.
In this paper, the transillumination of wood denotes a measuring technique in which near infrared light is used to illuminate the wood sample. The image generated by the light transmitted through the sample is photographed on the other side of the sample. Literature provides several studies concerning the use of transillumination of wood using conventional near infrared light sources or laser light. In 1952, wood was transilluminated by NIR-light to measure slant grained wood [4] and in publication [5] living knots from wood were detected using the same principle. Silvennoinen et al [6] and Matthews et al [7] have studied the determination of grain angle on the surface of wood veneer with lasers as a light source. Wood veneer has also been studied to determine grain angle deviation by examining the scattering pattern of transmitted light on the other side of the veneer [8]. Hirvonen et al have presented a study in which the strength of wood was estimated by grain deviation in the wood surface [9]. Authors of the publication [10] have utilized differences in reflected laser beams to determine wood surface grain angles. Tolonen, Simonaho and Silvennoinen [11] have developed a method and device to measure the diving angle of wood grain. They have analysed ellipse-shaped images created by laser light reflected from the wood surface. Also other laser-based techniques have been used for non-destructive detection of defects. For example, scanning laser Doppler vibrometry (SLDV) has been used for diagnostics of artworks such as mosaics, ceramics and inlaid wood [12]. The SLDV defect detection works well for ceramics but was less successful for organic material such as inlaid wood. Also optical coherence tomography (OCT) has been used to visualize the internal defects, rots and structure of biological turbid scattering media [13, 14].
To our knowledge, there are no reported studies concerning light transmission measurement through thick (>10 mm) wood samples, only thin samples like veneer have been examined. In this paper, we present a potential method for the detection of structural irregularities in wood and grain direction. The method is based on the changed features of the light pattern after it has travelled through wood and is tested with some typical samples. The near infrared laser light travels through a wood sample (thickness 30 mm or more) and an image is captured on the other side of the sample. The round shape of the incoming light turns into an ellipse or other light patterns. The total intensity of the image and the centre of mass of this light pattern is calculated and used to determine the grain angle at that point. In basic wood, when the timber is sawn along a radial or in a tangential direction, the light pattern is an ellipse in the middle of the captured image without any lateral shift. When the sample contains grain deviation, for example due to a knot or sawing direction, light patterns (other than ellipses) can be observed or their location varies.
2. Propagation of light in wood
Wood is a physically and therefore also optically inhomogeneous material. Figure 1 illustrates cross-sectional surface and tangential sectional surface of the pine (Pinus sylvestris L.) cell structure. It is obvious how wood cell structure differs in early wood and late wood and in the longitudinal (horizontal), radial and tangential directions. There are also other deviances in the structure such as rays and resin channels. Tracheid cells or the grains of the wood cover 90–95% of volume in conifer wood. Tracheid cells are long, narrow and oriented in a longitudinal direction. In early wood the tracheid are about 30 µm thick and in late wood about 20 µm. The lengths of the tracheid are 2–4 mm. Early and late wood also differ in density and colour [1, 2, 15].

Figure 1. (a) Cross-sectional surface and (b) tangential sectional surface of the cell structure of pine (Pinus sylvestris L.); 1—early wood, 2—late wood, 3—resin channel, 4—rays and 5—tracheids [18, p 77].
Download figure:
Standard image High-resolution imageFigure 2 illustrates the structure of a wood cell wall and middle lamella. The cell wall consists of four layers: primary wall and three different secondary cell walls; outer (S1), middle (S2) and inner cell wall (S3). The middle lamella mainly consists of lignin and it glues the cells together. The main part of the cellulose is in the secondary cell walls. The S2 layer is the thickest layer in the cell and contains 80–95% of fibre material. The S1 and S3 layers are thin and their microfibril molecules are twisted almost transversely to the fibre axis. In the S2 layer the microfibrils trace a steep spiral around the fibre axis. The microfibrils in every layer are highly crystalline and in the secondary wall the crystal alignment makes wood fibres birefringent [19–21].

Figure 2. The structure of the cell wall and middle lamella [2 p 96].
Download figure:
Standard image High-resolution imageThe complex structure of wood makes the development of accurate models for light propagation inside wood impossible. However, light propagation and scattering in wood have been studied. The spectral reflectance and transmittance of dried wood sample of Scots pine were studied by Palviainen [15]. Also light scattering phenomenon on wood surface was experimentally verified by three-dimensional optical grain direction measurement and anisotropy analysis of wood with a diffractive optical element (DOE) was introduced in [15]. The transmission of light in wood is affected by light absorption and scattering in wood and also the thickness of wood. Chemical components and physical structure of wood, differences in refractive indices and moisture content mainly have an influence to the absorption and scattering of light.
The propagation of light can be described by diffusion equations [16, 17]. Kienle et al [16] have studied light propagation in dry and wet softwood both experimentally and theoretically. Experiments were done spatially and time-resolved reflectance measurement and theoretic models were made by Monte Carlo simulation which consider the microstructure of wood. They have found that difference scattering between dry and wet wood are conducted from the scattering coefficients of wood, water and air. In [17], time-resolved optical spectroscopy in visible and NIR region was used to measure absorption and scattering spectra of dry and wet wood samples (Abies alba and Castanea sativa). All these studies [15–17] are based on reflectance measurements.
Below we present observations based on laboratory experiments related to this study. Initially, spectral measurements were taken through a wood sample to find the optimal light transmission wavelength band. In these measurements a spectrophotometer, a spectrograph and a halogen lamp as a broadband light source were used. The results indicated that the suitable transmission window for pine ranged from 700 to 900 nm. The same kinds of results have been expressed in [17], where absorption and scattering of dry and wet wood have been studied. For wet wood, absorption is low and scattering is smooth in spectral range (700–900 nm) both in parallel and perpendicular direction.
Heterogeneous material scatters and absorbs light in a random fashion. However, fibres in wood have a certain orientation and this ordered arrangement affects light propagation in wood. When a collimated and round beam of light is directed in the radial or tangential direction of sawed timber, the beam becomes elliptical on the other side of the timber. The shape of the ellipse is similar both in sapwood and heartwood. In knots and their vicinity, the orientation of fibres deviates from the main direction of wood fibre [1]. In fresh knots light travels readily along the knot without notable light absorption or scattering. Knots and other changes in grain direction modify the shape, location and orientation of the ellipse, providing valuable information about the wood structure. Obviously, when the wood sample is thinner the transmitted light intensity increases. However, based on our observations the shape of the ellipse remains.
Moisture in wood changes light proceeding through it. When wood is fresh and lumens filled with water, the propagation of light in the initial direction is more efficient due to lower light scattering (consequence of a smaller refractive index difference between liquid and solid) compared to dry wood where lumens are filled with air. Fresh pine (Pinus sylvestris L.) sapwood moisture content could be as high as 200% compared to dry weight and in heartwood the moisture level is about 30–40%. The amount of moisture in sapwood and heartwood alters light propagation. Sapwood and heartwood structures and extractive agents like resin also affect the propagation of light.
3. Materials and methods
Samples were made from fresh pine (Pinus sylvestris) logs. They consisted mainly of sapwood and the average moisture content of the samples at measuring time was approximately 130% compared to dry weight. The samples were cut in a tangential direction from the fresh log and stored in a freezer until measuring. The front and back surfaces of the sample were planed smooth. There were three sample boards and their dimensions were 95 mm × 42 mm × 1800 mm. Only the middle section of the boards was measured so that the measurement area was 700 mm in total. Images were taken from both sides and edges at 20 mm intervals. In total 352 images of one sample were taken. Figure 3 shows an example of the sample board photographed on both sides. In the text below, the illumination surface of the board is denoted as the front and the imaging surface as the back side of the board.

Figure 3. Both sides of the sample board L3.
Download figure:
Standard image High-resolution imageThe laser light, Cavilux LP, has 500 W pulse power (peak). The laser generates partly linearly polarized light at 810 ± 10 nm, which matches the light transmission window of pine well. The laser emits 10 µs light pulses at 4000 Hz for 3 s. After the light pulses, the laser cools for 60 s. The diameter of the collimated laser light beam was 22 mm. Detection was conducted with a Pixelink PL-B741EF camera which has a 1280 × 1024 pixel resolution and a spectral operation range of 400–1000 nm. A Computar objective with a 25 mm focal length was used in the camera. The laser head was pressed against the sample board. The distance between the camera and the sample board was 330 mm. The measurement system setup is shown in figure 4. The measurements were conducted in a dark room and background noise was eliminated from the results.
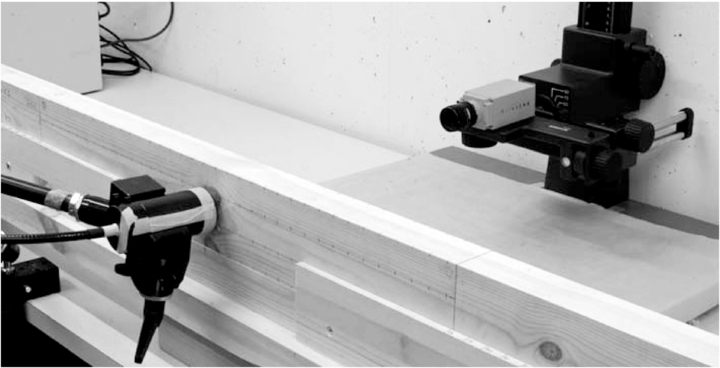
Figure 4. System setup. On the left, an optical cable from the laser and the collimator pressed against the sample board and in the upper right, the camera.
Download figure:
Standard image High-resolution image4. Results
The transillumination of samples used in this study generates an elliptical light pattern as shown in figure 5(a). Here the sample was sawn in a tangential direction and the board surface is perpendicular to the illumination plane. The wood grain direction can also be observed in the direction of board thickness. This so-called diving angle is usually zero, but can exist if the board is not sawn straight or if the wood contains a defect. The diving angle of the wood grain affects light travelling through the wood. Figures 5(b) and (c) are the transillumination images of samples which have a non-zero diving angle. Grain deviation can be estimated from the side images. When the grains are perpendicular to the main propagation direction of the light, the ellipse is located in the centre of the image (figure 5(a)). In this case the grain diving angle is 0°. As the diving angle increases, the location of the ellipse changes as in figures 5(b) and (c). The shape remains elliptical in all cases.
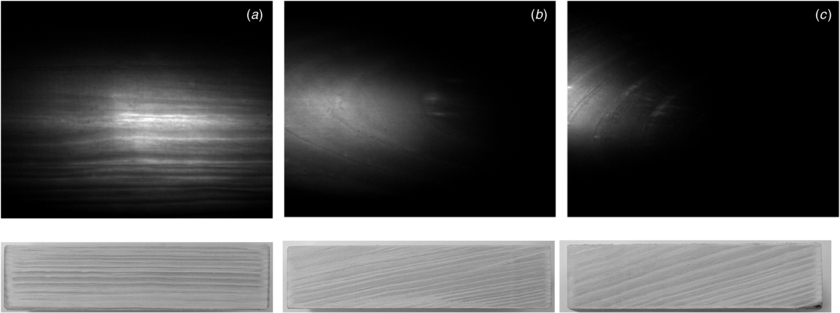
Figure 5. (Top) the effects of grain diving angle, and (bottom) images of the side of the wood sample. In (a) the diving angle is 0°, in (b) approx. 10° and in (c) approx. 20°.
Download figure:
Standard image High-resolution imageThe total intensity of the image and the centre of mass of intensity (CMI) can be calculated from the greyscale images. CMI can be used to determine the grain angle of the wood at a certain point of the board. Information concerning the centre of mass can be expressed in a vector with length and direction. CMI was calculated from the transillumination images with the Matlab program. First, the total intensity of the greyscale image was calculated using the sum value of all the pixels and by decreasing background noise. CMI was calculated using the centre of mass equation [22, p. 195]. The intensity centre of an image without sample defines the origin for the calculus. Then CMI is calculated, i.e. the vector's length is the distance from the origin and the direction is the angle in comparison to the chosen reference angle.
Figure 6 illustrates the transillumination of correct wood. On the left is the front side of the board, in the middle the back side of the board and on the right the transillumination image. The black spot and the grey circle describe the origin and illuminated area, respectively. Any changes in the shape or place of the ellipse indicate structural irregularity in the wood. The grey arrow on the transillumination image marks the vector of the CMI from the origin of the illumination. In this case the vector length R is small and thus the CMI is almost in the middle of the image. It can be concluded that there are no defects or grain deviation in this area. Additionally, a change in moisture content of the wood sample can cause changes in the brightness of the image. For example, in sapwood and heartwood moisture content can vary to a great extent.
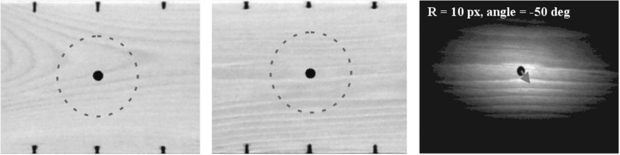
Figure 6. Transillumination of correct wood. On the left is the front side of the board, in the middle the back side of the board and on the right the transillumination image. The black spot describes the centre of the laser light.
Download figure:
Standard image High-resolution imageIn figure 7 the front side of the board sample looks correct. On the other side a large edge knot can be seen. The grains circulate the knot causing great changes in grain direction. They also change the diving angle because the grains go around the knot. This causes a location shift of the imaging ellipse and furthermore, changes in the shape of the ellipse. Figure 8 illustrates the transillumination of a fresh knot. On the front side the laser light partly hits the knot which traverses the board slantwise. The knot carries the light to one side of the image. This can be explained by the knot grain direction, which is longitudinal or relatively parallel to the laser light and also moisture content and higher scattering coefficient of the knot compared to basic wood. If the knot is dry, light travels differently. In such a case, the light does not primarily travel along the knot and the dry knot appears as a black or black and white spot.

Figure 7. Change in grain direction and diving angle alters the location and shape of the ellipse. On the left is the front side of the board, in the middle the back side of the board and on the right the transillumination image. The black spot describes the centre of the laser light.
Download figure:
Standard image High-resolution image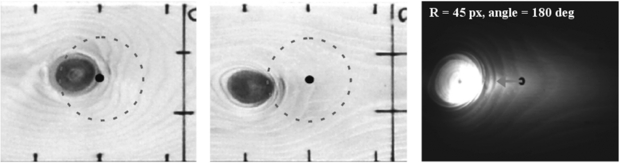
Figure 8. The transillumination of a knot. On the left is the front side of the board, in the middle the back side of the board and on the right the transillumination image. The black spot describes the centre of the laser light.
Download figure:
Standard image High-resolution image
5. Discussion
A suitable transmission window for the transillumination of wood was studied using spectral measurements and the wavelength of 810 nm was selected. There are also other useable wavelength bands, but unfortunately suitable high-power commercial lasers do not exist for this application. Laser technology is also developing in the NIR-spectral range and it is possible that there will be efficient lasers for higher wavelengths.
Laser illumination technology has advanced within recent years. Additionally, computer vision cameras have been developed. In 2008 (when our transillumination of wood research started), it was possible to study an approx. 40 mm thick sapwood sample with laser light and obtain a useful image. The maximum thickness for heartwood was less than 30 mm. Nowadays, the corresponding thicknesses are approx. 65 and 35 mm, respectively. In the future, cameras will become even more sensitive and lasers more efficient and in consequence it will be possible to analyse thicker wood boards by the method proposed in this study.
The laser used in this study needs to cool for 60 s between every image. Therefore the measurement time is not convenient for real field measurements. The measurement time would be shorter, if for example liquid cooling could be used. In our set-up, the most expensive component is the power laser. However, the transillumination measurement system is much cheaper than x-rays. We assume that the price of the measurement system will be reasonable in the near future.
When transillumination technology is mature enough to enable fast and continuous operation, extensive measurements of pine boards should be done to confirm the functionality of the transillumination method. Data processing should also be improved so that all the collected information can be used to study the inner structures of wood. The transillumination of wood can also be used for measuring moisture content and differentiating between heartwood and sapwood, determining the strength of wood, grading sawn timber and studying finger and glue joints.
Grain direction can be estimated with CMI in a two-dimensional plane. Therefore vector direction cannot unambiguously determine grain direction. For example, in the knot case (figure 8) the grain direction of the knot confuses the determining of the grain angle of the wood sample. In addition, examining the shape and size of the ellipses could give additional information about grain direction.
Pine and spruce are the main wood species used in the timber industry especially for construction. This study only concerns the pine, but it is possible to examine other wood species. Spectral measurements were conducted for seven different wood species and thus the best suitable wavelengths are known for hardwoods such as birch, aspen and alder in addition to pine and spruce.
The simulation of light propagation in wood has not been done, but it could generate further information about the interaction between wood and near infrared light.
6. Conclusions
In this paper, we propose a potential method to determine the inner defects of wood and grain angle deviation. In the method, a wood sample is illuminated by near infrared laser light, which travels through the sample. A greyscale image is taken by a camera on the other side of the sample. The total intensity of the image and the centre of mass of a light pattern is calculated and used to determine the grain angle at a certain point of the sample. With the transillumination method, knots and other inner wood defects can be located and identified. The grain direction near any defect usually differs from the grain direction of basic wood and consequently defects can be observed. In fresh knots light travels readily along the knot contrary to the case of dry knots in which light propagation is hindered due their lower water content.
The transillumination method can be used to study the inner structures of sawn timber. At present, the method is useable for about 30–50 mm thick timber depending on the heartwood rate. However, laser and camera technologies are advancing swiftly making use of the method in sawmills desirable. Furthermore, more study is needed to ensure the reliable operation of the method and to develop image interpretation and data processing. This method could be utilized for grading sawn timber, determining the strength of wood, inspecting the quality of finger and glue joints and estimating moisture content and differentiating between heartwood and sapwood.
Acknowledgments
The work in this study was conducted in the PUNOS research project in CEMIS-Oulu, University of Oulu, Finland. The authors gratefully acknowledge the Finnish Funding Agency for Technology and Innovation (TEKES), UPM Kymmene Timber, Cavitar Oy and Pixact Oy for their financial support.