


Abstract
The visible light radiated by some high temperature objects (less than 1200 °C) almost lies in the red and infrared waves. It will interfere with structured light projected on a forging surface if phase measurement profilometry (PMP) is used to measure the shapes of objects. In order to obtain a clear deformed pattern image, a 3D measurement method based on blue sinusoidal structured light is proposed in this present work. Moreover, a method for filtering deformed pattern images is presented for correction of the unwrapping phase. Blue sinusoidal phase-shifting fringe pattern images are projected on the surface by a digital light processing (DLP) projector, and then the deformed patterns are captured by a 3-CCD camera. The deformed pattern images are separated into R, G and B color components by the software. The B color images filtered by a low-pass filter are used to calculate the fringe order. Consequently, the 3D shape of a high temperature object is obtained by the unwrapping phase and the calibration parameter matrixes of the DLP projector and 3-CCD camera. The experimental results show that the unwrapping phase is completely corrected with the filtering method by removing the high frequency noise from the first harmonic of the B color images. The measurement system can complete the measurement in a few seconds with a relative error of less than 1 : 1000.
Export citation and abstract BibTeX RIS
1. Introduction
Natural objects radiate electromagnetic waves continuously with radiation energy that is closely related to temperature. Generally, materials with higher temperature produce higher radiation energy, and begin to radiate visible electromagnetic waves [1–3] at about 500 °C. Great difficulties in measuring the objects' dimensions using contact measurement methods result from the higher radiation energy and visible light for the objects at high temperatures. Currently, non-contact measurement methods of the shape of high temperature objects include 3D scanning method, binocular visual method, coordinate measuring machines, etc. However, some drawbacks, including narrow measuring range and lower measuring efficiency [4–8], limit the corresponding application to some extent. Hoteye, a system established by the University of Michigan, the Ohio State University, and the OGT Company, can measure the 3D shape of a 10 cm × 10 cm hot forging in 10s with an accuracy of 0.1 mm. It has been applied in measuring the dimensions of small forgings but it is difficult to be used for large forgings. LamCam-Forge, a forgings measurement system developed in Germany, can measure the 3D shape of hot forgings by a laser scanning technique. The scanning procedure is time-consuming and cannot be utilized to measure large dimension hot forgings. Liu et al proposed a method to detect the dimensions of hot forgings based on binocular visual. However, the length, rather than the 3D shape of a hot forging, is obtained using this measurement system. Fu et al proposed a measurement system for hot-state cylindrical shell forgings by combining laser scanning technology and infrared temperature measurement technology. This technology can measure the inner and outer diameters of the forgings with an error of less than 1 mm.
Phase measurement profilometry (PMP) has been widely used in automatic processing CAD/CAM, computer vision, and reverse engineering [9, 10] because of its advantages of high efficiency, stability, high accuracy, and a large measurement range. However, visible light radiated by the objects over 500 °C will interfere with structured light projected onto the surface and make it difficult to obtain a clear deformed pattern image with fine sinusoidal properties. It is rather critical for the implementation of 3D shape measurement to obtain a deformed pattern image with fine sinusoidal property of the structured light.
Some high temperature metals exposed to air can be oxidized, and their surface is always covered by a brittle oxide layer. This can be broken resulting in disjointedness in the profile making it impossible to correctly unwrap the discontinuities [11]. The problem may be resolved by the temporal phase unwrapping algorithm. The phase unwrapping at each pixel relies only on its own sequence of phase maps along the time axis and is independent of the other pixels in the temporal phase unwrapping algorithm [12]. These temporal phase unwrapping algorithms are based on multi-frequency heterodyne or Gray code algorithms. The projector projects a set of binary grating images onto the surface of the measured object in order to determine the order of the phase-shifting fringe pattern in the Gray code algorithm. The image binarization is greatly affected by the reflectivity of the object surface. However, the surface of the high temperature object with a large reflectivity variation caused by the non-uniform oxide layer will result in some errors in binarization and failure in phase unwrapping. By contrast, the multi-frequency heterodyne is not sensitive to the surface reflectivity of the object surface and its calculating process is more stable. Hence, the multi-frequency heterodyne is applied as the unwrapping phase algorithm in the present work [13]. The multi-frequency heterodyne includes dual frequency heterodyne, 3-frequency heterodyne, and 4-frequency heterodyne methods, etc. The dual frequency heterodyne needs a higher accuracy of the wrapped phase maps to calculate the unwrapping phase. The 4-frequency heterodyne requires more fringe pattern images projected onto the object. Therefore, the 3-frequency heterodyne method is widely adopted to measure the discontinuous object in the engineering field. However, intensity errors of the deformed pattern image can also lead to incorrect values of the unwrapping phase [14, 15], and therefore, it is important to reduce the intensity errors of the deformed pattern image for the unwrapping phase.
2. 3D shape measurement method for high temperature objects
2.1. Radiation wavelength–temperature relationship of objects
Planck's law shows the relationship between radiation energy and radiation wavelength of black-bodies at different temperatures [1]. As shown in figure 1 and described as:

where E is monochromatic radiation intensity (W cm−2 μm−1),  W μm cm−2,
  μm, λ is radiation wavelength.
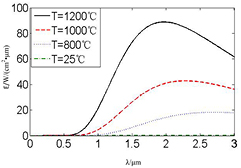
Figure 1. The relationship between radiation intensity and radiation wavelength at different temperatures of black-bodies.
Download figure:
Standard image High-resolution imageMany objects (such as heat sources) can be considered to approximate a black body. Figure 1 shows that the radiation energy of the forgings is mainly distributed in red and infrared waves when the temperature is less than 1200 °C. It suggests that PMP might be applied to measure a shiny surface based on color structured light [16–18]. In this paper, 3D measurement of high temperature objects below 1200 °C was investigated by green or blue structured light. Since the spectrum of green structured light is in close proximity to red visible radiation, the degree of crosstalk between R and G channels is greater than that between R and B channels. In order to avoid the crosstalk among channels as much as possible, the blue structured light is proposed for the fringe projection.
2.2. 3D shape measurement system setup
The measurement system is shown in figure 2. It consists of a digital light processing (DLP) projector, a 3-CCD camera and a computer. Three sets of blue sinusoidal fringe pattern images with different pitch are generated by software and projected onto the object surface by the DLP projector. The deformed pattern images are captured by the 3-CCD camera which is positioned at a certain angle to the DLP projector. The images are then separated into their RGB components by software. B grayscale images are used to carry out the wrapped phase and the unwrapping phase algorithms. Finally, global coordinates of the measured object are established based on the calibration relationship between the 2D image coordinate system and the 3D global coordinate system.
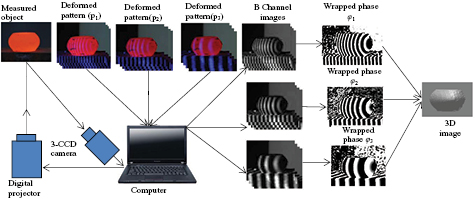
Figure 2. 3D shape measurement system setup for high temperature objects.
Download figure:
Standard image High-resolution imageIn theory, the shape measurement can be attained by substituting the monochrome camera and the band-pass filter for the 3-CCD cameras described above. The projector still projects the blue structured light onto the surface of the high temperature object. Only the blue structured light passes the band-pass filter and arrives at the CCD plane in the camera. Taking band-pass width and band-pass ripple of the filter into consideration, these factors may influence the sinusoidal properties of the deformed pattern [19]. Consequently, the former is adopted as the measurement method of a high temperature object.
2.3. System calibrations
In figure 3, oc-ucvcwc, op-upvpwp and O-XYZ represent the camera, the DLP projector and global coordinate system, respectively. Suppose B is a point on the measured object and its coordinate is (X, Y, Z) in the global coordinate system. The pixel coordinate of point B is (uc, vc) at the sensor plane (cc) of the camera and the pixel coordinate of point B is (up, vp) at the sensor plane (cp) of the projector. According to the geometry relationship of perspective projection and the relationship between the pixel coordinate system of the camera and the global coordinate system [20, 21], the following equations are established:

where sc is a scaling factor and is an unknown, Ac and Mc are the intrinsic and extrinsic parameter matrixes of the camera. Ac is a 3 × 3 matrix and Mc is a 3 × 4 matrix.
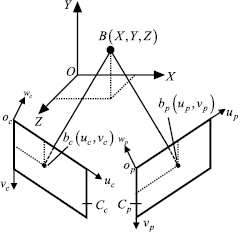
Figure 3. System calibration.
Download figure:
Standard image High-resolution imageThe parameter matrixes of the camera are obtained by using the Matlab camera calibration toolbox with checkerboard. The camera is calibrated as follows: (1) Moving the checkerboard, the camera captures eight checkerboard images at different positions from the camera. (2) Using the eight checkerboard images, the parameter matrixes and distortion coefficient of the camera are obtained by the Matlab calibration toolbox.
Similarly, the relationship between the projector coordinate system and the global coordinate system is established:

where sp is a scaling factor and is an unknown, Ap and Mp are the intrinsic and extrinsic parameter matrixes of the projector. Ap is a 3 × 3 matrix and Mp is a 3 × 4 matrix.
Viewed as an inverse camera, the calibration of the projector requires a red/blue checkerboard because the reflectivity of the red is close to the blue about white light. The calibration procedure includes the following steps [22–24]:
- (1)
- (2)The projector projects a series of horizontal and vertical phase-shifting images onto the checkerboard and the camera captures the deformed pattern images, as shown in figures 4(c) and (d). Using the four-step phase-shifting algorithm and the 3-frequency heterodyne algorithm, the horizontal and vertical wrapped phase and unwrapping phase maps are calculated as shown in figures 4(e)–(h). The unwrapping phase values of each grid corner are obtained by using a linear interpolation algorithm including the horizontal and vertical unwrapping phase.
- (3)According to the horizontal and vertical unwrapping phase values of each grid corner, the position of the grid corner is found in the projected image. Thus the Digital Micro-mirror Device (DMD) image of the projector is obtained as shown in figure 4(i).
- (4)The position of the checkerboard changed and steps 1–3 are repeated, which provides eight DMD images calibrating the projector.
- (5)The eight DMD images are then used to calculate the intrinsic and extrinsic parameters using the Matlab camera calibration toolbox.
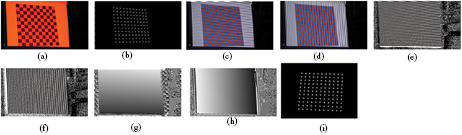
Figure 4. Projector DMD image capturing flow chart: (a) red/blue checkerboard with red light illumination, (b) grid corner, (c) horizontal fringe patterns, (d) vertical fringe patterns, (e), (f) wrapped phase maps, (g), (h) unwrapping phase maps, and (i) DMD image.
Download figure:
Standard image High-resolution imageup is given by:
where Φ(uc, vc) is the unwrapping phase of point B, W is the resolution of the DLP projector in the horizontal direction and N is the resolution of the camera in the horizontal direction. sc, sp, vp, X, Y and Z are six unknowns in equations (2) and (3). Since there are six unknowns and six linearly independent equations in equations (2) and (3), the global coordinate (X, Y, Z) of point B can be obtained to solve these six equations. Hence, the key is to solve the unwrapping phase Φ(uc, vc) for the global coordinate of point B.
Two orders of radial and tangential distortions are considered when the intrinsic and extrinsic parameters are calculated using the Matlab calibration toolbox. The calibration accuracies of the camera and projector are 0.03 pixels and 0.22 pixels after the unwrapping phase is compensated by the Look-up table algorithm. The measurement accuracy is greater than 2 × 10⁻⁴ within the measurement volume size [25]. The algorithms between the Matlab calibration toolbox and Robert Sitnik are consistent with only an accurate calibration model required. However, Sitnik's calibration method takes all unknown parameters into consideration including all existing objective aberrations. The measurement uncertainty within 10−4 can be found with respect to the measurement volume size [26]. This new method can be applied for calibration. The global coordinate is defined by polynomials of the unwrapping phase. Without precise placement of the calibration model, these polynomials are calculated by phase distribution on a 2D-calibration model positioned manually in several unknown positions.
3. Clear deformed pattern image with fine sinusoidal property based on blue structured light
It is necessary to obtain deformed pattern images with fine sinusoidal properties, as mentioned above. An image captured by a 3-CCD camera indicates the visible radiation spectrum(1200 °C) is mainly composed of red waves, as shown in figure 5(a). The color forging image is then separated into R, G and B components by software, as shown in figures 5(b)–(d). Figures 5(b) and (d) show that the forging grayscale value of the B component is close to or even less than the grayscale value of its surrounding environment when the forging grayscale value of the R color component tends toward the saturated state (255). Through software analysis, the forging grayscale value of the B color component is less than 30. It provides enough grayscale scope (30–255) for the sinusoidal fringe pattern to be used as the proposed method.
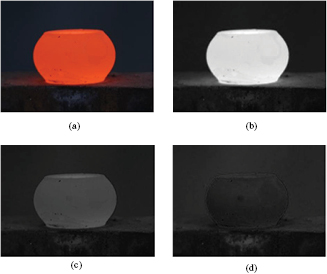
Figure 5. The color forging image(1200 °C) and its RGB components: (a) forging image(1200 °C), and (b)–(d) R, G and B components.
Download figure:
Standard image High-resolution imageIn the laboratory, a blue sinusoidal fringe pattern image is projected onto the forging surface (1200 °C). The deformed pattern image captured by the 3-CCD camera is shown in figure 6(a). The deformed pattern of the image is interfered with by the high temperature radiation and becomes blurred in figure 6(a). In order to obtain deformed pattern images with fine sinusoidal properties, the color image is separated into R, G and B color components by software, as shown in figures 6(b)–(d). According to the channel separation, B color images with good sinusoidal property are used to carry out the unwrapping phase algorithm. In our present work, all experiments adopt the tube forging which is pressed into a cake shape in the upsetting process.
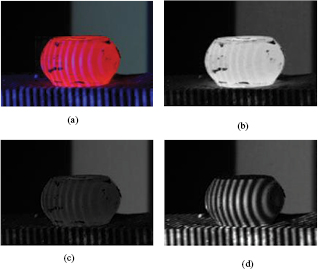
Figure 6. The color deformed pattern image and its RGB components: (a) color deformed pattern, and (b)–(d) R, G and B components.
Download figure:
Standard image High-resolution image4. Correction of unwrapping phase based on filtering method
4.1. Principle of 3-frequency heterodyne
Resolving the unwrapping phase is critical to implementing the shape measurement rapidly for the measured object. Therefore, the wrapped phase calculated by B grayscale images should be unwrapped using the 3-frequency heterodyne algorithm which is mentioned above.
The 3-frequency heterodyne algorithm means that three sets of fringe images are required to project onto the measured object because the unwrapping phase is calculated by three wrapped maps. The unwrapping phase at each pixel is calculated by the values of the pixel at three wrapped phase maps and independent of other pixels. Therefore, the phase is not affected by the discontinuities on the object surface. Simultaneously, the independence of other pixels eliminates the phase error in the spatial propagation.
Suppose the fringe pitch of three sets of sinusoidal fringe patterns is p1, p2 and p3, respectively. Each set of the fringe patterns includes four phase-shifting images. The phase shift between neighboring images is 90°. A four-step phase-shifting algorithm is used to compute the three wrapped phase maps.  is given by:
where Iji(x, y) is the intensity of each pixel in the deformed patterns, φj(x, y) is wrapped phase. Two phase maps(φ1 and φ2), whose pitch is p1 and p2, respectively, subtract from each other to set up another phase map φ12 whose pitch is p12 according to the 3-frequency heterodyne principle. p12 is given by:
The phase maps, whose pitch is p12 and p3 respectively, subtract from each other to obtain the unwrapping phase, whose pitch is p. p is defined as:
Select p1 = 20, p2 = 30 and p3 = 64. According to equations (6) and (7), the values of p12 and p can be determined as 60 and 960, respectively, as shown in figure 7.
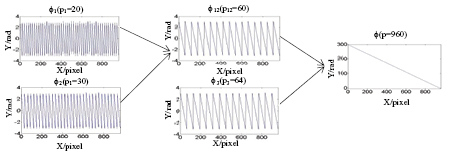
Figure 7. The principle of 3-frequency heterodyne.
Download figure:
Standard image High-resolution image4.2. Correction of unwrapping phase based on filtering method
Suppose Q is a point on the deformed pattern images. Its pixel coordinates are (x, y) and the three wrapped phase values are φ1(x, y), φ2(x, y) and φ3(x, y), corresponding to three wrapped phase maps. The orders of the point Q are N1 + ▵n1, N2 + ▵n2 and N3 + ▵n3 on three wrapped phase maps φ1, φ2 and φ3, respectively. m12 + ▵m12 is the synthetic fringe order of the point on the synthetic phase map constructed by φ1 and φ2. N1, N2, N3 and m12 are the integer parts of the order and the ▵n1, ▵n2, ▵n3 and ▵m12 are the fractional parts of the order. The relationship between the order and wrapped phase is expressed as equations (8) and (9):

Solving equations (8) and (9) for ▵m12 and m12, we obtain:
Computing m12 whose pitch is p12 is the key to the 3-frequency heterodyne method because the errors of m12 lead to the incorrect unwrapping phase. Since m12 is an integer, the error of m12 must be limited to the range between −0.5 to +0.5 when m12 is rounded. It means that the errors of φ1, φ2 and φ3 must be within the scope shown in equation (12). Outside the scope, the value of m12 is incorrect. From equation (11), it can be obtained:
where dm12, dφ1, dφ2 and dφ3 are the errors of m12, φ1, φ2 and φ3 respectively, and p12 is the pitch of the synthetic fringe constructed by φ1 and φ2.
Although the deformed pattern image with fine sinusoidal property is obtained, as mentioned in section 3, there are still errors in grayscale value (intensity) about the deformed pattern image induced by ambient noise, quantization of digital equipment, micro lens, etc. Hence, B color images contain high frequency components in addition to the fundamental frequency component, shown in figures 8(d)–(f). Ideally, the deformed pattern should only contain fundamental frequency components in the frequency domain [27]. Moreover, the high frequency component in the B components will reduce the accuracy of the wrapped phase and lead to incorrect values of the unwrapping phase.
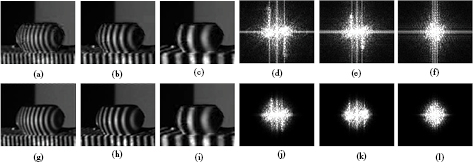
Figure 8. The B color images and the images filtered. (a)–(c) deformed patterns, pitch = 20, 30, 64, (d)–(f) FT images, pitch = 20, 30, 64, (g)–(i) deformed pattern filtered, pitch = 20, 30, 64, and (j)–(l) FT images, pitch = 20, 30, 64.
Download figure:
Standard image High-resolution imageThere are three color channels in the DLP projection and camera system. The crosstalk between the neighboring channels should be considered because it will lower measurement accuracy. This will be studied in future work. Here, we focus on resolving and correcting the unwrapping phase.
In this paper, a filtering method is proposed to improve the accuracy of the unwrapping phase. The deformed pattern images are filtered by a Butterworth lowpass filter to remove the high frequency from the fundamental frequency component. The deformed pattern images are filtered and their Fourier transform (FT) images are shown in figures 8(g)–(l). Figures 9(a) and (b) are cross-section plots of the 70th row in figures 8(c) and (i). It can be seen that better sinusoidal property is present in the filtered deformed pattern images than the initial ones captured by CCD camera from figures 8 and 9.

Figure 9. The contrast figure between the deformed pattern and the deformed pattern filtered: (a) the cross-section of 70th row in figure 8(c), and (b) the cross-section of the 70th row in figure 8(i).
Download figure:
Standard image High-resolution image and m12 are calculated by the deformed pattern images and the
  and
and  are calculated by the filtered deformed pattern images. The unwrapping phase map Φj is calculated by the wrapped phase maps
  . The equation
  is adopted to calculate the unwrapping phase
  corresponding to the wrapped phase
  . Φj is expressed by equation (13):
m12 is shown in figure 10(a). The incorrect values are obtained when they are rounded according to equation (11). Moreover, the unwrapping phase Φ1 is shown in figure 10(b) by solving equation (13). Because there is a one-to-one correspondence between the incorrect value of m12(x, y) and the unwrapping phase Φ1(x, y), there are certain incorrect values in figure 10(b). Figures 10(c) and (d) are cross-section plots of the 90th row in figures 10(a) and (b) which indicate the values of m12(90, 87) and Φ1(90, 87) are incorrect. The correction to the unwrapping phase  is expressed as:
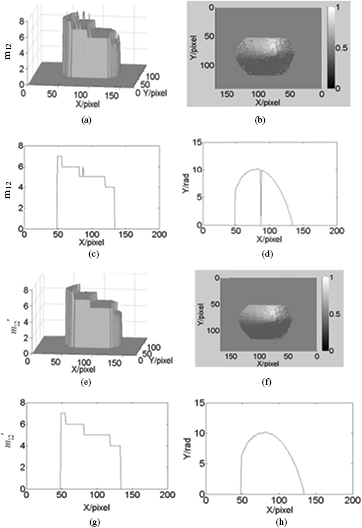
Figure 10. Unwrapping phase correction: (a) m12, (b) Φ1, (c) the 90th row of m12, (d) the 90th row of Φ1, (e)  , (f)
, (f)  , (g) the 90th row of
  , and (h) the 90th row of
  .
.
Download figure:
Standard image High-resolution imageThe unwrapping phase  can be corrected by adding or subtracting the integer times of
  using the filtering method from equation (14). Therefore,
  at discontinuities on the forging surface is not influenced by the filtering method proposed in this paper.
  and
and  in figures 10(e) and (f) indicate all incorrect points are corrected. Figures 10(g) and (h) are the cross-section plots of the 90th row in figures 10(e) and (f) which indicate the correction values of m12(90, 87) and Φ1(90, 87).
5. Experiments
To verify the efficiency of the measurement system, the 3D shape of the forging at 1200 °C was measured. Three sets of fringe pattern images were projected on the forging and the camera captured the deformed pattern images. The deformed pattern images were then processed to solve the unwrapping phase. By the channel separation method presented in this paper, fine sinusoidal properties of deformed pattern images were obtained. Then, the unwrapping phase was corrected entirely through the filtering method proposed in this paper. According to the calibration parameter matrixes of the DLP projector and the camera in advance, the 3D size of the forging could be determined in a few seconds. The resolutions of the DLP projector and the camera are 768 × 1024 and 600 × 800, respectively. The 3D shape of the forging is shown in figure 11. The size of the forging is 63 mm in height and 114 mm in width (the maximum diameter).
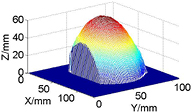
Figure 11. 3D shape of the hot forging.
Download figure:
Standard image High-resolution imageIt is difficult to confirm the measurement accuracy of the method because the variation in the thermal expansion and the contraction stress of the metal will disturb the result. In order to verify the accuracy, the size of the plane at room temperature is measured by the method presented in this paper. The plane is measured at about 1500 mm away, as shown in figure 12. Figure 12 displays the measured plane, an image of the deformed pattern, the B component, the wrapped phase, the unwrapping phase, and the measurement result. The RMS of the reconstructed plane is 0.8362 mm and the maximum error is 1.4785 mm. The relative error of measurement is less than 1 : 1000.

Figure 12. Experimental results of plane: (a) the measured plane, (b) color deformed pattern, (c) B component, (d) wrapped phase, (e) unwrapping phase, and (f) measurement result of plane.
Download figure:
Standard image High-resolution image
The blue structured light projected by the projector and red radiation by the high temperature object are located in two different channels. Experimental results demonstrate that a clear deformed pattern with fine sinusoidal properties can be obtained in 5 m using the projector with 3000 lm when blue structured light is projected onto the hot forging at 1200 °C.
6. Conclusions
In this paper, a measurement method based on blue structured light has been developed for a 3D shape of high temperature objects below 1200 °C. The blue sinusoidal fringe images are projected onto the high temperature object's surface through a DLP projector and the deformed pattern images are captured by a 3-CCD camera. B color components with fine sinusoidal properties are obtained by the channel separation method. B color images contain high frequency components which can lead to incorrect values of the unwrapping phase. The key step to correct the unwrapping phase can be achieved by the filtering method. The 3D shape of high temperature objects can be obtained using the method. The relative error of measurement is less than 1 : 1000 using the method presented in our present work. The measurement system can complete the measurement in a few seconds and the efficiency is higher than the laser scanning method and the coordinate measuring method.